Strategy vault / Trend following
Relative Body Index Crossover Strategy
This strategy mainly uses the moving average crossover signals of the relative body ratio (RB) of daily candlesticks to determine the trend, together with stop loss and take profit for automated trading. The…
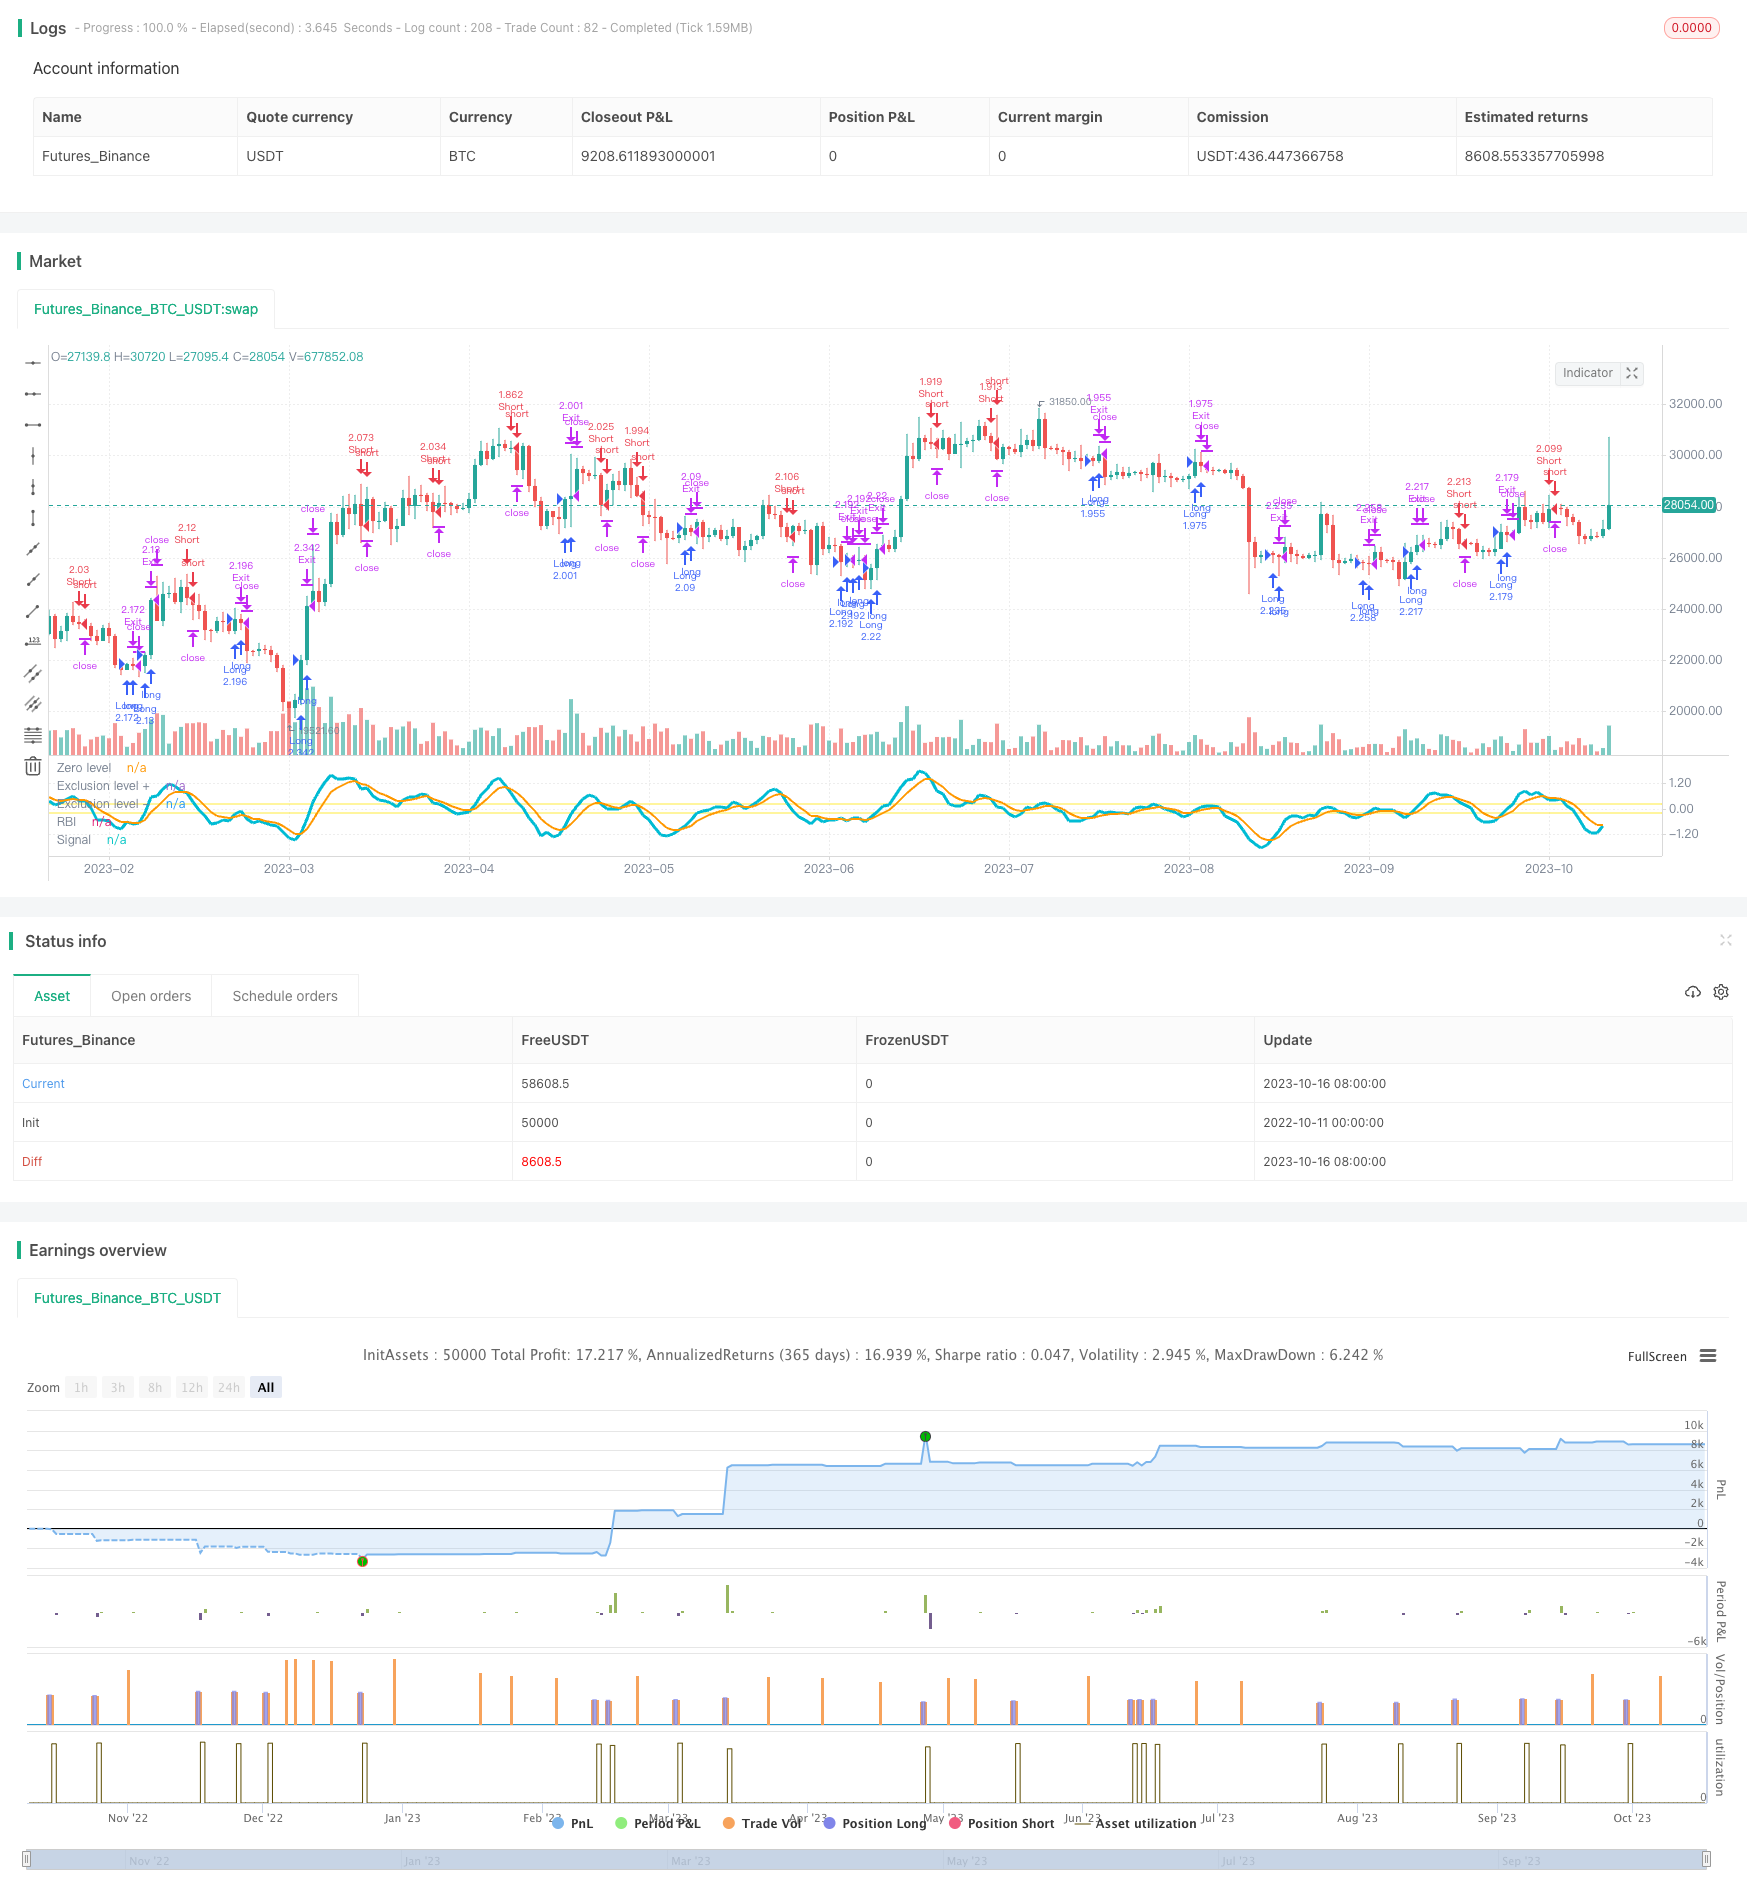
Overview
This strategy mainly uses the moving average crossover signals of the relative body ratio (RB) of daily candlesticks to determine the trend, together with stop loss and take profit for automated trading. The "Relative Body Strength" in the strategy name refers to the moving average of the relative body strength of daily candlesticks.
Strategy Logic
The strategy is based on Vitelot's RBI indicator, which calculates the moving average of the relative body ratio (RB) of daily candlesticks. The RB is calculated as:
The formula calculates the ratio of the real body to the full length of the candlestick for bullish candles, taking positive values; and negative values for bearish candles. RB ranges from -1 to 1.
The RBI indicator uses the moving average of RB to filter out noise and capture the essence of market trends. A buy signal is generated when RBI crosses above its signal line, and a sell signal when crossing below.
To avoid false signals during uncertain bullish phases, the strategy also checks if the closing price is above the 13-period EMA before generating a true buy signal for long position. Similarly, only when the close is below the 13 EMA will the short position be executed.
The strategy also implements stop loss and take profit to control risks and lock in profits. After opening position, profit will be trailed based on the set points, with a fixed stop loss in points.
Advantage Analysis
RBI filters out significant noise and captures market trend characteristics, avoiding false signals from ranging markets.
Using moving average filter avoids false signals effectively during uncertain bullish phases, reducing losses from shorts.
Stop loss and take profit helps reduce loss risk on individual positions and lock in profits, improving overall profitability.
The strategy has few parameters and is easy to understand, suitable for automated trading.
Risk Analysis
The strategy relies solely on RBI, any wrong signals from the indicator could lead to failure.
Poor parameter tuning of the indicator could also worsen the quality of trading signals.
No technical indicators can completely avoid losses in certain market conditions.
Stop loss set too tight may result in too frequent stop outs; too wide may lead to large losses on single positions.
Insufficient drawdown control could lead to account wipeout risks.
Optimization Directions
Different parameter combinations can be tested to optimize the RBI parameters.
Additional indicators could be added for signal filtering and quality improvements.
Machine learning can be used to train and optimize the stop loss and take profit parameters.
Risk management strategies can be added to control overall position sizing and risk exposure.
Different holding periods like overnight holdings or short term scalping could be explored.
Conclusion
Overall this is a relatively simple and straightforward trend following strategy. It uses RBI crossover to determine trend direction, with additional filters and stop loss/take profit to control risks, effectively avoiding false signals from ranging markets. But no technical indicators can completely avoid risks. Continuous improvements such as parameter optimization, risk management are still needed for long term stable excess returns. The logic is clear and easy to understand, suitable for automated trading. It is a very practical trend following strategy.
Parameters
| Name | Default | What it controls |
|---|---|---|
| v_input_1 | 5 | MA1 Period |
| v_input_2 | 5 | Signal Period |
| v_input_3 | 0.2 | Exclusion level |
| v_input_4 | false | Calculate the binary version |
| v_input_5 | false | Treshold Long |
| v_input_6 | false | Treshold Short |
| v_input_7 | 300 | SL Activation |
| v_input_8 | true | SL Trigger |
| v_input_9 | 120 | TP Activation |
| v_input_10 | true | TP Trigger |
| v_input_11 | true | From Month |
| v_input_12 | true | From Day |
| v_input_13 | 2019 | From Year |
| v_input_14 | 6 | To Month |
| v_input_15 | 19 | To Day |
| v_input_16 | 2020 | To Year |
Source Pine Script
/*backtest
start: 2022-10-11 00:00:00
end: 2023-10-17 00:00:00
period: 1d
basePeriod: 1h
exchanges: [{"eid":"Futures_Binance","currency":"BTC_USDT"}]
*/

//@version=3
strategy("RBI Backtest /w TSSL", shorttitle="RBI Strategy", overlay=false, default_qty_type = strategy.percent_of_equity, default_qty_value = 100, initial_capital = 10000, slippage = 5)
// RBI:
//  The EMA of the relative body (RB) of Japanese candles is evaluated.
//  The RB of a candle (my definition) is simply the ratio of the body with respect to its full length
//  and taken positive for bull candles and negative for bear candles:
//      e.g. a bull "marubozo" has RB=1 a bear "marubozo" has RB=-1;
//      a "doji" has RB=0.
//  This simple indicator grasps the essence of the market by filtering out a great deal of noise.
//
//  A flag can be selected to calculate its very basic binary version, where a bull candle counts as a one
//  and a bear candle counts as a minus one.
//
//  Enter (or exit) the market when the signal line crosses the base line.
//  When the market is choppy we have a kind of alternating bear and bull candles so that
//  RBI is FLAT and usually close to zero.
//  Therefore avoid entering the market when RBI is FLAT and INSIDE the Exclusion level.
//  The exclusion level is to be set by hand: go back in history and check when market was choppy; a good
//  way to set it is to frame the oscillations of RBI whe price was choppy.
//
//  RBI is more effective when an EMA of price is used as filtering. I found EMA(13) to be
//  a decent filter: go long when base crosses signal upwards AND closing price is above EMA(13);
//  same concept for going short.
//
//  As any other indicator, use it with responsibility: THERE CAN'T BE A SINGLE MAGIC INDICATOR winning
//  all trades.
//
//  Above all, have fun.
//
// Vitelot/Yanez/Vts March 31, 2019

par1 = input(5, title="MA1 Period")
par2 = input(5, title="Signal Period")
exclusion = input(0.2, title="Exclusion level")

useBin = input(false, title="Calculate the binary version")

treshold_long = input(0, title="Treshold Long")
treshold_short = input(0, title="Treshold Short")

fixedSL = input(title="SL Activation", defval=300)
trailSL = input(title="SL Trigger", defval=1)
fixedTP = input(title="TP Activation", defval=120)
trailTP = input(title="TP Trigger", defval=1)

FromMonth = input(defval = 1, title = "From Month", minval = 1, maxval = 12)
FromDay   = input(defval = 1, title = "From Day", minval = 1, maxval = 31)
FromYear  = input(defval = 2019, title = "From Year", minval = 2017)
ToMonth   = input(defval = 6, title = "To Month", minval = 1, maxval = 12)
ToDay     = input(defval = 19, title = "To Day", minval = 1, maxval = 31)
ToYear    = input(defval = 2020, title = "To Year", minval = 2017)
start     = timestamp(FromYear, FromMonth, FromDay, 00, 00)  // backtest start window
finish    = timestamp(ToYear, ToMonth, ToDay, 23, 59)        // backtest finish window
startTimeOk()  => true // create function "within window of time" if statement true

ynSimple(t) =>
    s = (close>open)? 1: -1
    ema(sum(s,t),t)

ynRel(t) =>
    s = (close-open)/(high-low)
    ema(sum(s,t),t)

yn = useBin? ynSimple(par1): ynRel(par1)
sig = ema(yn,par2)


plot(yn, color=aqua, title="RBI", linewidth=3, transp=0)
plot(sig, color=orange, title="Signal", linewidth=2, transp=0)

hline(0, color=white, title="Zero level", editable=false)
hline(exclusion, color=yellow, title="Exclusion level +", editable=true, linestyle=line)
hline( 0-exclusion, color=yellow, title="Exclusion level -", editable=true, linestyle=line)

long = crossover(yn,sig) and yn < treshold_long
short = crossover(sig,yn)  and yn > treshold_short

// === STRATEGY - LONG POSITION EXECUTION ===
strategy.entry("Long", strategy.long, when= long and startTimeOk())
strategy.exit("Exit", qty_percent = 100, loss=fixedSL, trail_offset=trailTP, trail_points=fixedTP)
strategy.exit("Exit", when= short)
// === STRATEGY - SHORT POSITION EXECUTION ===
strategy.entry("Short", strategy.short, when= short and startTimeOk())
strategy.exit("Exit", qty_percent = 100, loss=fixedSL, trail_offset=trailTP, trail_points=fixedTP)
strategy.exit("Exit", when= long)
Published by ChaoZhang on the FMZ strategy square · last modified 2023-10-18. Collected in the Quant Trading Vault. Unvalidated research: re-test with your own data and costs before trusting it.
Build this with AgenKit
A spec is not a trading system. Paste this into your coding agent and AgenKit runs a specialist team — architecture, test-first build, risk gates, review — with paper trading on by default.
/agenkit build a production-grade trading bot with a backtest engine, risk controls and paper trading by default from strategies/Relative-Body-Index-Crossover-Strategy.md- npx agenkit install engineering-kit in your project
- Paste the command into your agent and approve each phase
- Get tests, backtest, risk controls and a paper-trading switch
Understand it first
Before you run this, read the lesson behind the idea and how to backtest it honestly. Specs like this one are the survivors of an unknown number of trials; deflate their results accordingly.
Related specs
- 200 EMA VWAP MFI Trend Following StrategyPine Script · Trend following · 1d
- 4 EMA Trend StrategyPine Script · Trend following · 1d
- ADX MA and EMA Long Only Trend Tracking StrategyPine Script · Trend following · 1d
- ATR Dynamic Trend Following and EMA Crossover Trading StrategyPine Script · Trend following · 1d
- ATR and Moving Average Crossover Hybrid StrategyPine Script · Trend following · 1h
- ATR and T3 Moving Average StrategyPine Script · Trend following · 5m