Strategy vault / Mean reversion
Relative Strength Index Long Short Strategy
This strategy generates trading signals by comparing the RSI indicator of a cryptocurrency with the RSI indicator of a crypto market index to judge the relative value of the cryptocurrency against the crypto market.
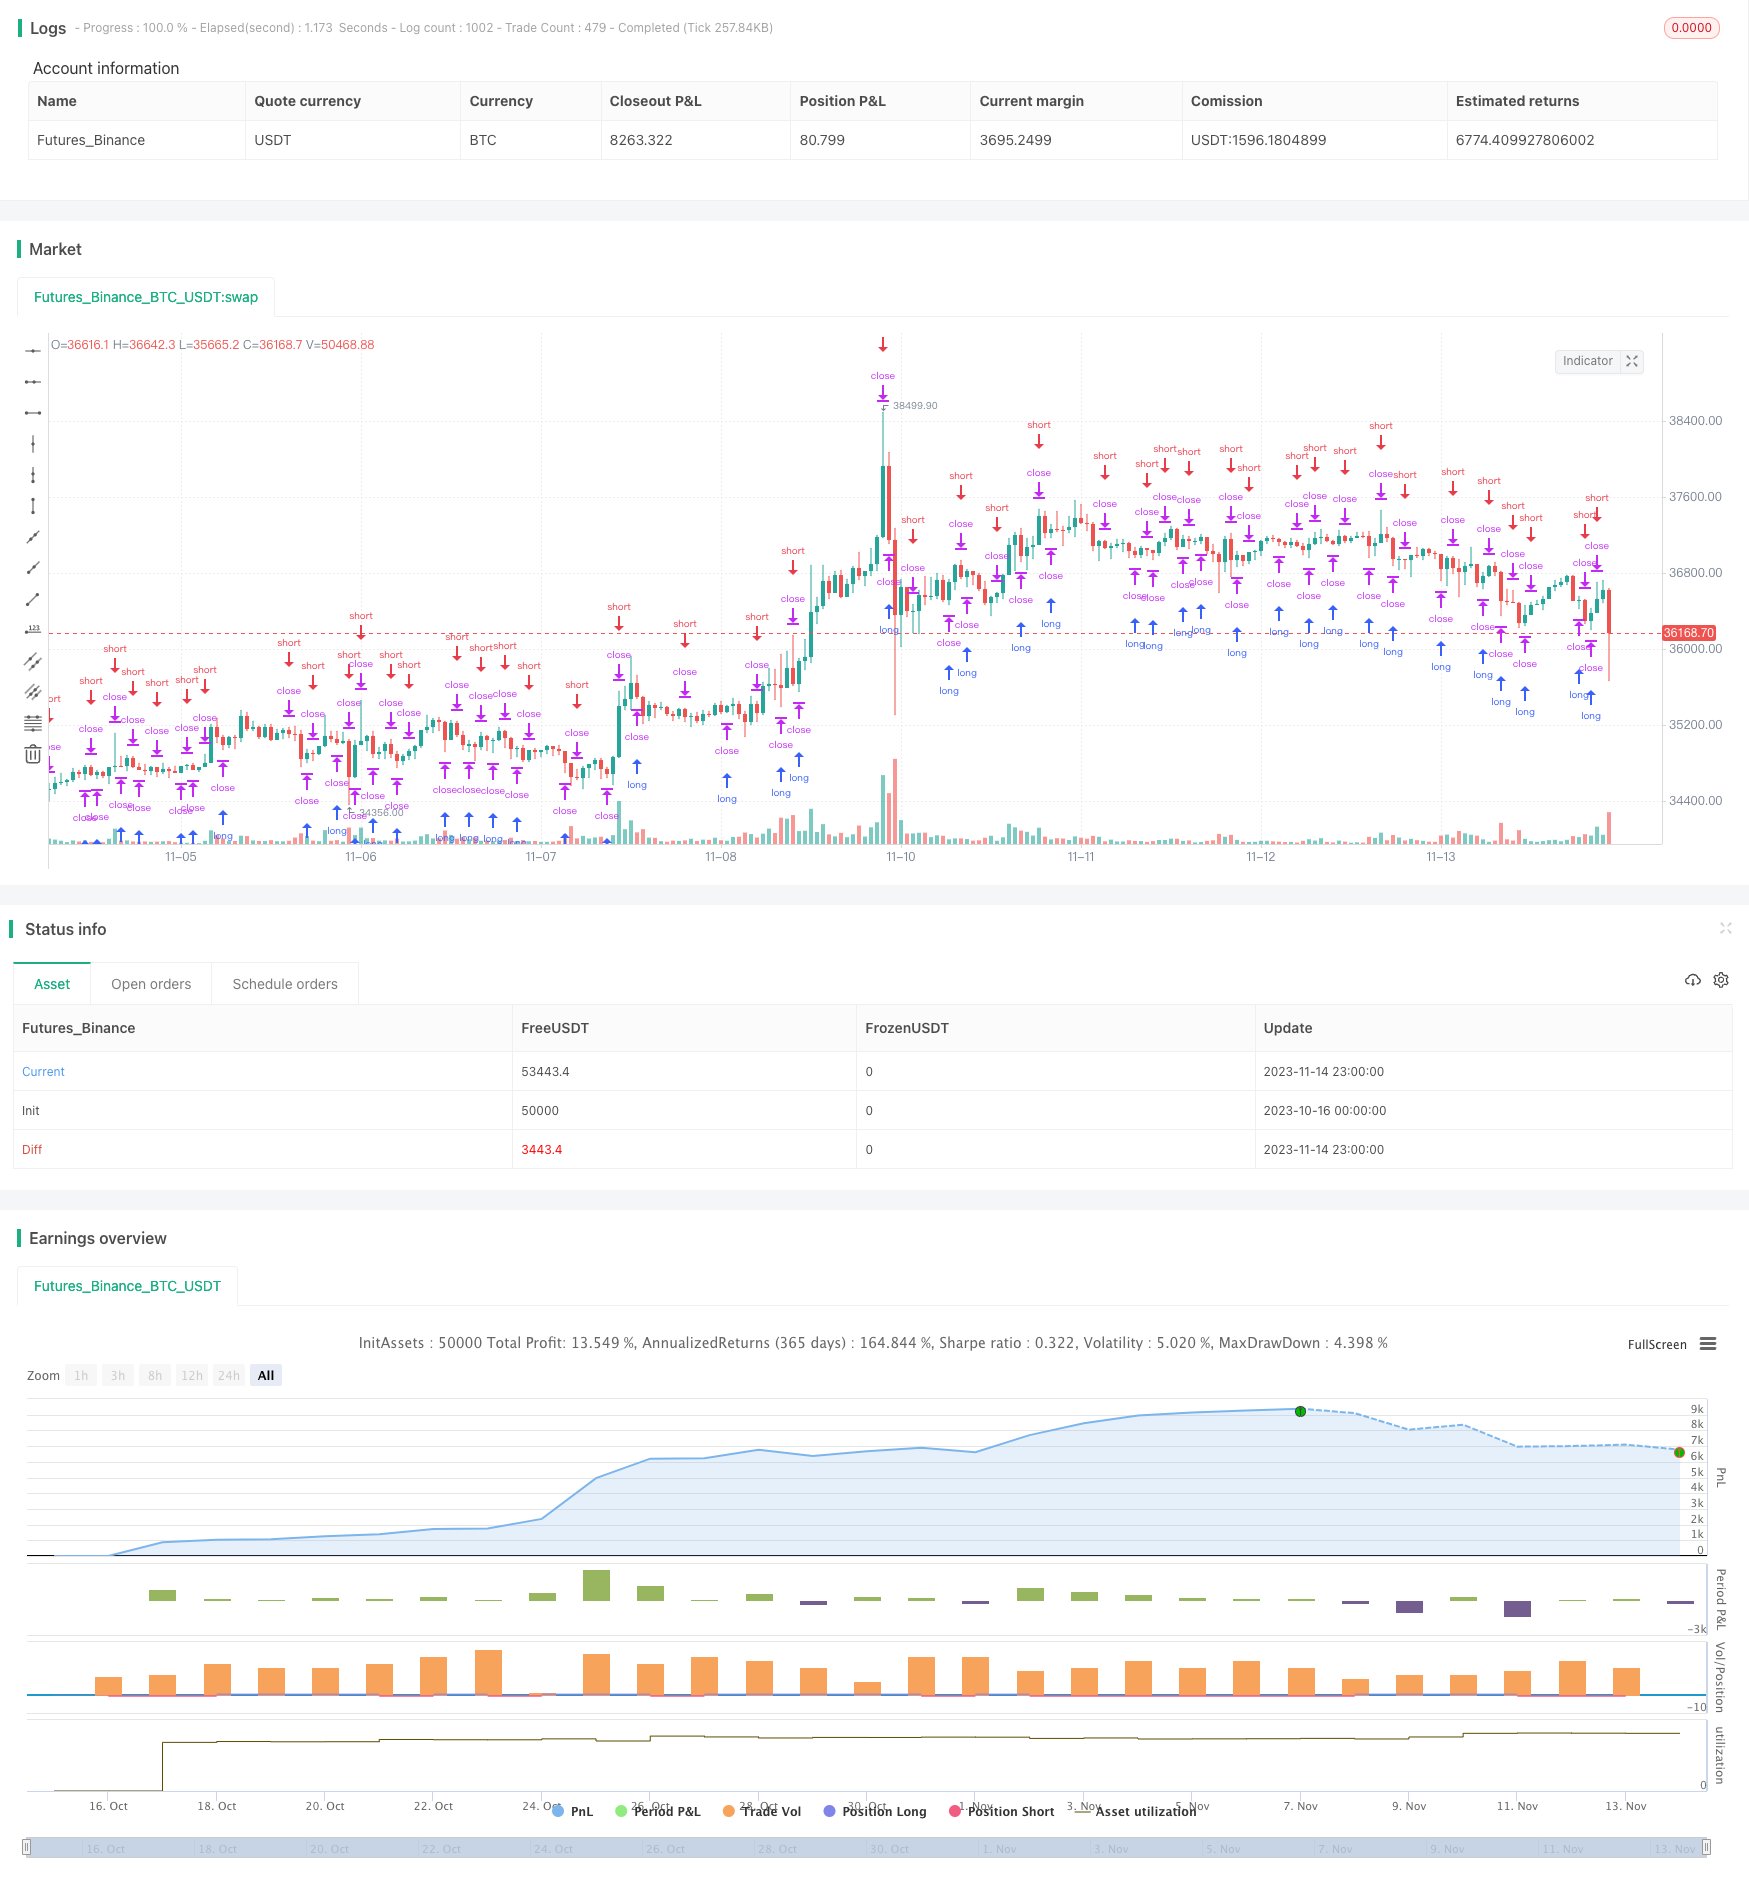
Overview
This strategy generates trading signals by comparing the RSI indicator of a cryptocurrency with the RSI indicator of a crypto market index to judge the relative value of the cryptocurrency against the crypto market.
Strategy Logic
The strategy allows selecting a crypto market index first, such as total market cap, total market cap excluding Bitcoin, market cap of other coins, etc. It also selects a higher time frame of the crypto index, default to daily. Then it calculates the RSI of the selected cryptocurrency and the RSI of the crypto index, and generates a relative strength index based on their ratio. When the relative strength index crosses above the specified parameter, a buy signal is generated. When it crosses below, a sell signal is generated.
The core logic is that when the RSI of the cryptocurrency is stronger than the crypto index, it means the coin is relatively undervalued compared to the market, and has the potential to become overvalued, so it can be bought. When the coin RSI is weaker than the market index, it means the coin is relatively overvalued compared to the market, and has the potential to become undervalued, so it can be sold. The relative strength index allows more accurate valuation judgments.
Advantage Analysis
The biggest advantage of this strategy is that it uses the relative strength index, which allows more accurate valuation of cryptocurrencies, instead of solely relying on technical indicators of a single coin to make decisions, avoiding the pitfall of looking at things in isolation.
The relative strength index takes into account the overall market environment's impact on individual coins, and can capture the market rotation rhythm and sector rotations, and dig out valuable coins from the market.
Also, the strategy provides multiple index selections, which can be optimized for different market environments to ensure the strategy's effectiveness.
Risk Analysis
The main risk of this strategy is that the relative strength index is merely a valuation tool, and cannot completely avoid trading risks arising from the technical patterns of individual coins.
For example, if the coin has entered an obvious head-and-shoulders top reversal pattern, and the market structure has changed, relying solely on the relative strength buy signals could lead to losses.
Therefore, the strategy needs to combine the technical patterns of the individual cryptocurrencies themselves to avoid unfavorable trades at critical technical points.
Another risk is if the selected index is inappropriate, and has low correlation with the cryptocurrency, then the indicating power of the relative strength index would be largely compromised. This requires optimizing the index selection based on the correlation between different coins and market indices.
Optimization Directions
The strategy can be optimized in the following aspects:
Add stop loss strategies to cut losses in time when prices reverse.
Optimize index selection, match different indices for different coins to increase correlation.
Add multiple time frame combinations, such as confirming daily signals with 4h signals, to increase signal reliability.
Add machine learning algorithms to adaptively determine the threshold for the relative strength index, instead of using fixed parameters.
Incorporate other indicators like sentiment analysis, fundamental analysis to form a more comprehensive valuation system.
Conclusion
The relative strength index strategy judges the relative valuation of cryptocurrencies by comparing their strength against market indices, and generates trading signals. Its advantage lies in incorporating market analysis dimensions and capturing market rhythms. But it also has risks that need optimization, such as adding stop loss, time frame combinations, adaptive threshold etc. to improve performance. If properly implemented, this strategy can play an important role in crypto algorithmic trading.
Parameters
| Name | Default | What it controls |
|---|---|---|
| v_input_1 | 2016 | Backtest Start Year |
| v_input_2 | true | Backtest Start Month |
| v_input_3 | true | Backtest Start Day |
| v_input_4 | 2030 | Backtest Stop Year |
| v_input_5 | 12 | Backtest Stop Month |
| v_input_6 | 30 | Backtest Stop Day |
| v_input_7 | 4 | length of rsi comparison |
| v_input_8 | true | correlation crossover |
| v_input_string_1 | 0 | Index selection: CRYPTOCAP:TOTAL2 | CRYPTOCAP:TOTAL | CRYPTOCAP:OTHERS | CRYPTOCAP:USDT | CRYPTOINDEX:CIX100 | CRYPTOCAP:BTC.D | CRYPTOCAP:BTC |
| v_input_string_2 | 0 | higher time frame reference index: 120 | 2 | 5 | 10 | 15 | 30 | 45 | 60 | 90 | 1 | 150 | 240 | 360 | 720 | D | 3D | W | M |
| v_input_9 | true | Color Hull according to trend? |
Source Pine Script
/*backtest
start: 2023-10-16 00:00:00
end: 2023-11-15 00:00:00
period: 1h
basePeriod: 15m
exchanges: [{"eid":"Futures_Binance","currency":"BTC_USDT"}]
*/

//@version=5
strategy('RSI correlation with cryptoindices [strategy version]', overlay=false)

// Testing Start dates
testStartYear = input(2016, 'Backtest Start Year')
testStartMonth = input(1, 'Backtest Start Month')
testStartDay = input(1, 'Backtest Start Day')
testPeriodStart = timestamp(testStartYear, testStartMonth, testStartDay, 0, 0)
//Stop date if you want to use a specific range of dates
testStopYear = input(2030, 'Backtest Stop Year')
testStopMonth = input(12, 'Backtest Stop Month')
testStopDay = input(30, 'Backtest Stop Day')
testPeriodStop = timestamp(testStopYear, testStopMonth, testStopDay, 0, 0)
testPeriod() =>
    time >= testPeriodStart and time <= testPeriodStop ? true : false

len = input(4, title='length of rsi comparison')
correlationcrossover = input(1, title='correlation crossover')
IndexSwitch = input.string('CRYPTOCAP:TOTAL2', title='Index selection', options=['CRYPTOCAP:TOTAL2', 'CRYPTOCAP:TOTAL', 'CRYPTOCAP:OTHERS', 'CRYPTOCAP:USDT', 'CRYPTOINDEX:CIX100', 'CRYPTOCAP:BTC.D', 'CRYPTOCAP:BTC'])
IndexHTF = input.string('120', title='higher time frame reference index', options=['1', '2', '5', '10', '15', '30', '45', '60', '90', '120', '150', '240', '360', '720', 'D', '3D', 'W', 'M'])
switchColor = input(true, 'Color Hull according to trend?')
ref = request.security(IndexSwitch, IndexHTF, close[1], lookahead=barmerge.lookahead_on)
RSI_ref = ta.rsi(ref, len)
RSI_close = ta.rsi(close, len)
relative = RSI_ref / RSI_close
plot(relative, color=color.new(color.blue, 0))
long = ta.crossover(relative, correlationcrossover)
short = ta.crossunder(relative, correlationcrossover)
corr = plot(correlationcrossover, color=color.new(color.green, 0), linewidth=1)
hullColor = switchColor ? relative > correlationcrossover ? #00ff00 : #ff0000 : #ff9800

//PLOT
///< Frame
Fi1 = plot(relative, title='relative', color=hullColor, linewidth=1, transp=50)
fill(Fi1, corr, title='Band Filler', color=hullColor, transp=50)

if long and testPeriod()
    strategy.entry("long", strategy.long)

if short and testPeriod()
    strategy.entry("long", strategy.short)

// alertcondition(long, title='long', message='long')
// alertcondition(short, title='short', message='short')
Published by ChaoZhang on the FMZ strategy square · last modified 2023-11-16. Collected in the Quant Trading Vault. Unvalidated research: re-test with your own data and costs before trusting it.
Build this with AgenKit
A spec is not a trading system. Paste this into your coding agent and AgenKit runs a specialist team — architecture, test-first build, risk gates, review — with paper trading on by default.
/agenkit build a production-grade trading bot with a backtest engine, risk controls and paper trading by default from strategies/Relative-Strength-Index-Long-Short-Strategy.md- npx agenkit install engineering-kit in your project
- Paste the command into your agent and approve each phase
- Get tests, backtest, risk controls and a paper-trading switch
Understand it first
Before you run this, read the lesson behind the idea and how to backtest it honestly. Specs like this one are the survivors of an unknown number of trials; deflate their results accordingly.
Related specs
- ATR and EMA based Dynamic Take Profit and Stop Loss Adaptive StrategyPine Script · Mean reversion · 1h
- Adaptive Mean Reversion Trading Strategy Based on Chande Momentum OscillatorPine Script · Mean reversion · 1d
- Adaptive RSI Oscillator Dynamic Trading Strategy with Threshold OptimizationPine Script · Mean reversion · 1d
- Advanced 15 Minute Chart Trading Signal StrategyPine Script · Mean reversion · 3h
- Advanced Fibonacci Retracement Trend Following and Reversal Trading StrategyPine Script · Mean reversion · 3h
- Advanced Momentum EMA Trend Following with RSI Overbought Oversold Trading StrategyPine Script · Mean reversion · 1d