Strategy vault / Mean reversion
Relative Strength Index Long term Quant Strategy
This strategy is called "Relative Strength Index Long-term Quant Strategy", abbreviated as RSI Long-term Strategy. By calculating the moving average of the rise and fall ranges within a certain period, the RSI…
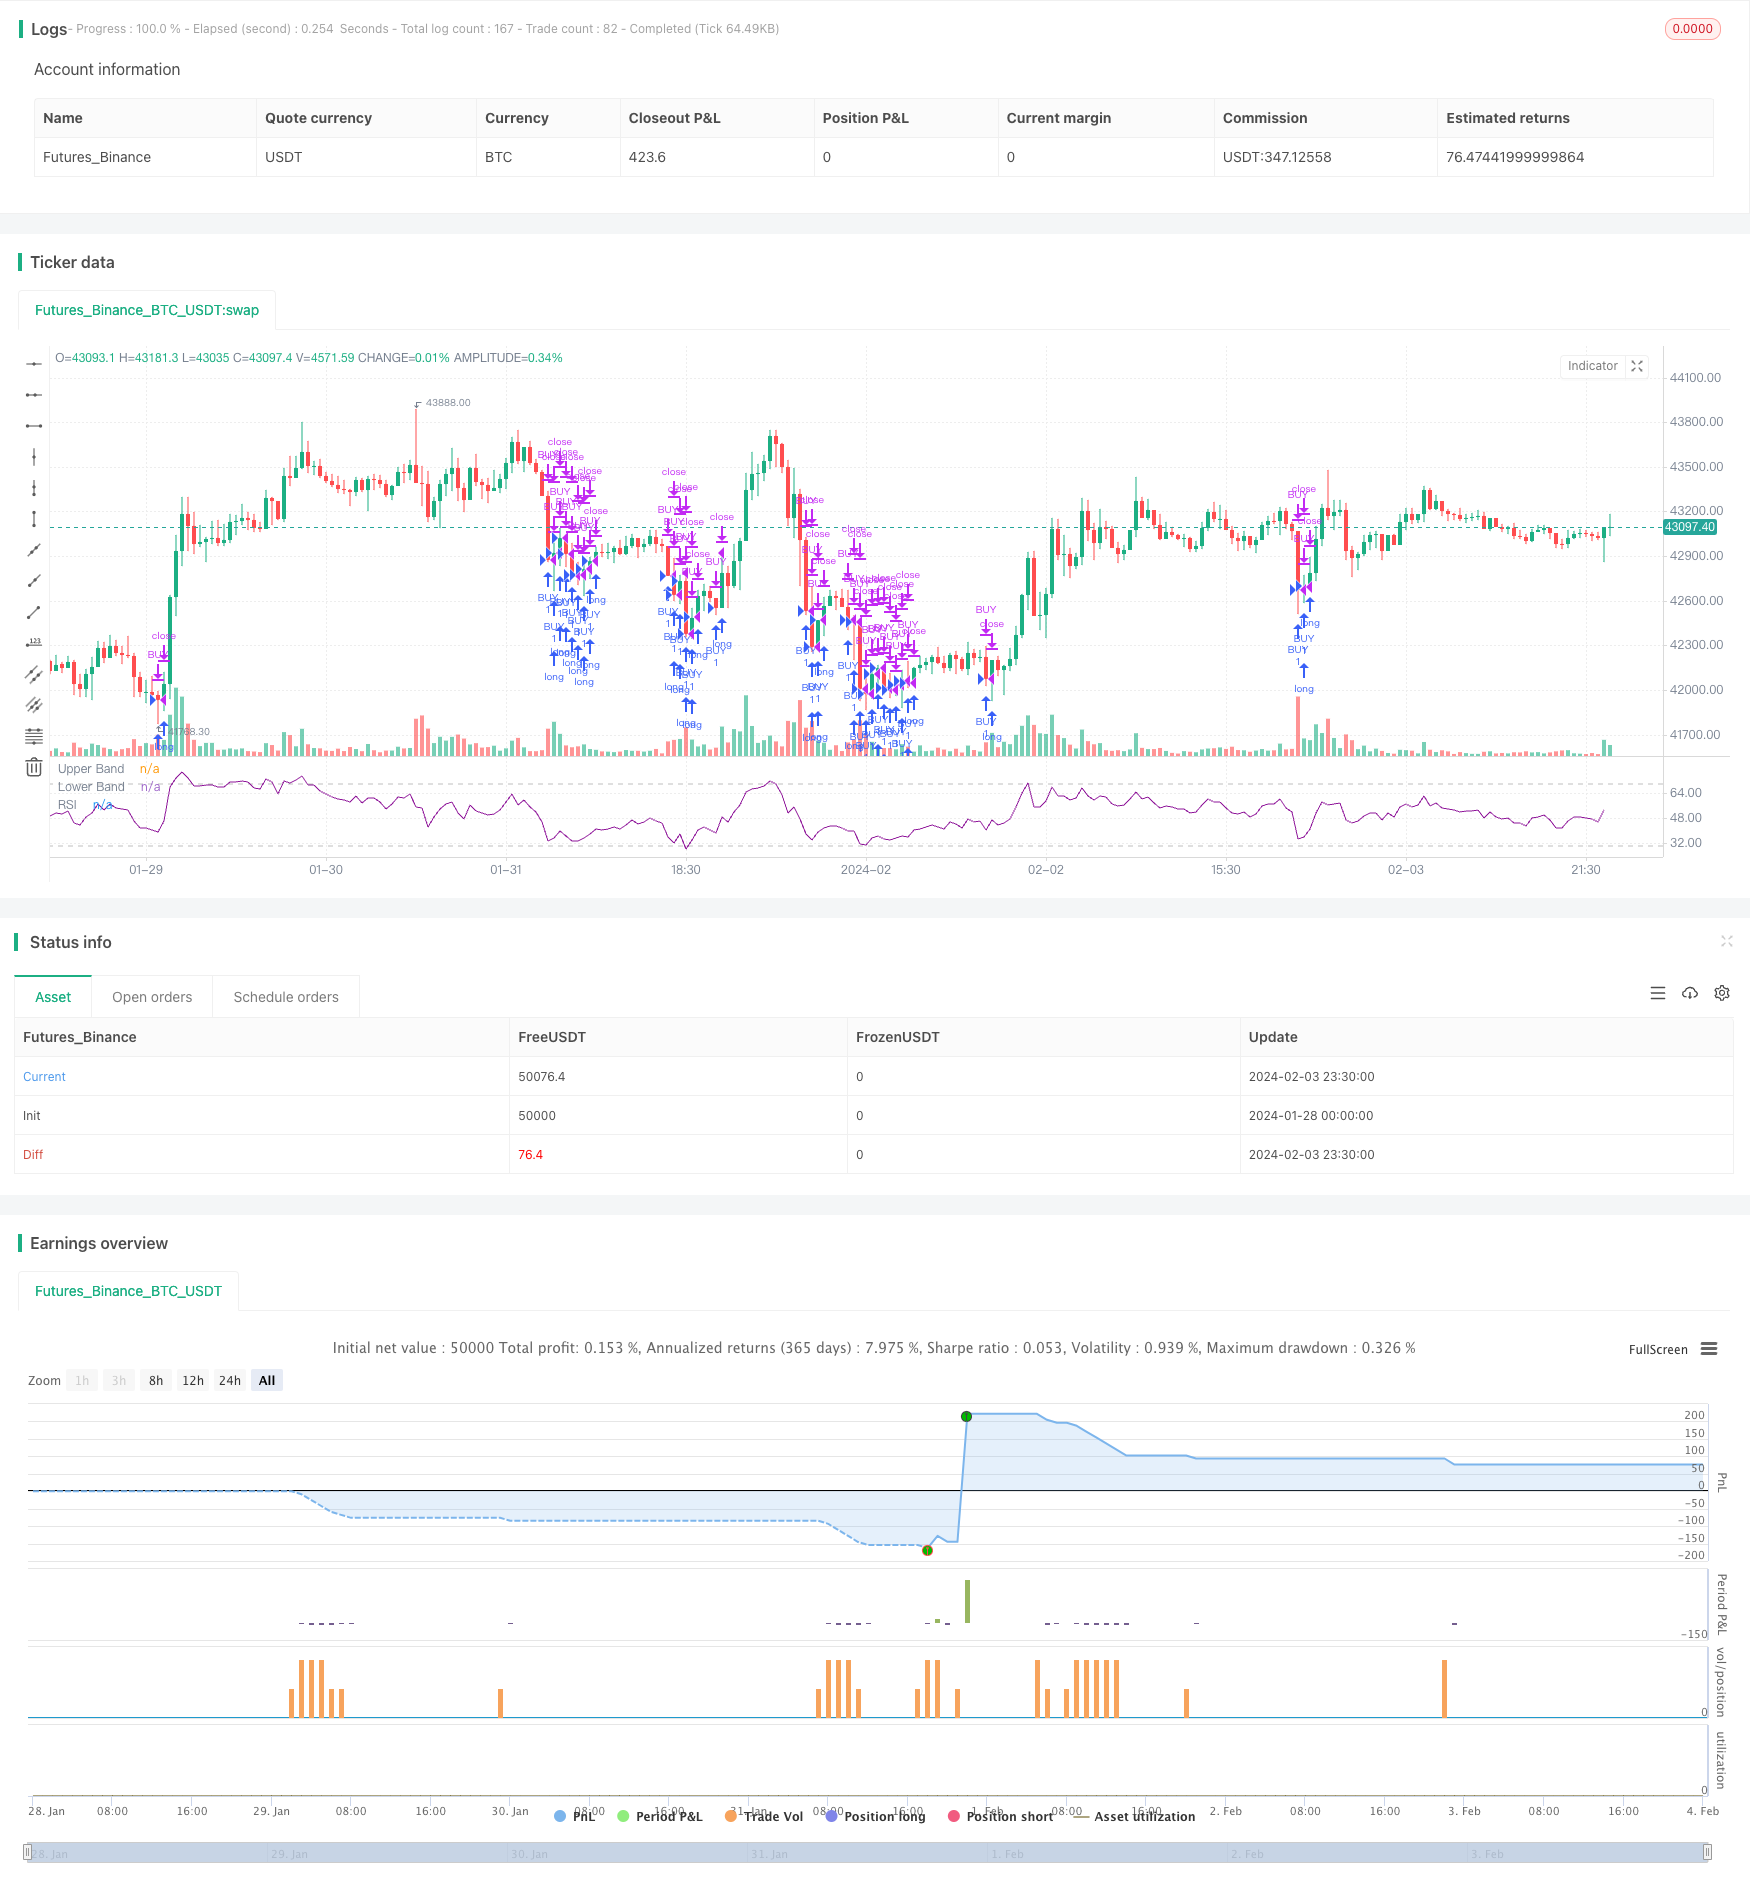
Overview
This strategy is called "Relative Strength Index Long-term Quant Strategy", abbreviated as RSI Long-term Strategy. By calculating the moving average of the rise and fall ranges within a certain period, the RSI technical indicator is constructed and overbought and oversold lines are set to judge the timing of the market. When the RSI is lower than the set oversold line, long positions are gradually built in the long-term hold.
Strategy Principle
The core indicator of this strategy is Relative Strength Index (RSI). The RSI indicator compares the average increase and decrease over a period of time to determine whether the current security price is overestimated or underestimated. Its calculation formula is:
RSI = 100 - 100 / (1 + UP / DOWN)
Where UP is the average amplitude of the closing price rise in the last n days; DOWN is the average amplitude of the closing price decline in the last n days. The index oscillates between 0-100 intervals. Above 70 is the overbought zone and below 30 is the oversold zone.
This strategy sets RSI parameter Length=14 to calculate RSI based on 14-day closing prices. And set the oversold line Rsvalue=40, that is, RSI below 40 is determined to be oversold. When the RSI of the day is below 40, the buy window is opened, and positions are gradually built in the oversold area, and the final closing time is set to sell out after exceeding the closing time.
Advantage Analysis
The biggest advantage of this strategy is that by using the RSI indicator to determine the timing of the market, the capture of low prices is realized. When the RSI is below 40, it is an oversold state, which means that the previous decline was too large and there is a chance of a rebound. At this time, gradually build a position to obtain a better cost. When the RSI is above 70, it is in an overbought state, which means that the market may have peaked and positions could be reduced.
In addition, the strategy adopts a gradual position building approach to reduce the risk of a single entry. The construction window serves as the high point of the position, and the final closing time serves as the low point of the position to achieve long-term investment.
Risk Analysis
This strategy mainly relies on the RSI technical indicator, which has some lag. Especially when the market changes suddenly, the RSI may not be able to react in time. At this time, blindly following the RSI indicator to build a position may result in limited profits or increased losses.
In addition, the strategy provides probabilistic trading signals. Even if the RSI is below 40, it does not mean that there is 100% chance of a rebound. The probability that the price will hit a new low after building a position also exists. At this point, a good stop loss strategy is needed to control maximum losses.
Optimization Directions
The strategy can be optimized in the following areas:
Combine multiple stocks for portfolio trading. Single stocks are more easily affected by specific events, while portfolios can diversify individual stock risks.
Add a stop loss strategy to further control risks. For example, add a trailing stop loss to stop loss exit when prices continue to fall.
Optimize the position building strategy. For example, use time-weighted average price for gradual position building in the over-interval, rather than full position establishment.
Combine with other indicators to filter signals, such as momentum indicators, moving averages, etc., to avoid blindly following the RSI.
Summary
This strategy determines the overbought and oversold areas by constructing the RSI indicator, gradually establishes long positions in the oversold area, and sets the final closing time to achieve long-term holding. Compared with short-term trading, this strategy is more suitable as a long-term quantitative investment tool. Its advantages lie in capturing low prices and controlling costs, while the risks lie in indicator lag and signal misguidance. In the future, it can be improved in many ways such as portfolio optimization, stop loss strategies, position building optimization.
Parameters
| Name | Default | What it controls |
|---|---|---|
| v_input_1 | 14 | Length |
| v_input_2_close | 0 | Source: close | high | low | open | hl2 | hlc3 | hlcc4 | ohlc4 |
| v_input_3 | 40 | RSvalue |
| v_input_4 | true | From Month |
| v_input_5 | true | From Day |
| v_input_6 | 2015 | From Year |
| v_input_7 | 3 | To Month |
| v_input_8 | true | To Day |
| v_input_9 | 2022 | To Year |
Source Pine Script
/*backtest
start: 2024-01-28 00:00:00
end: 2024-02-04 00:00:00
period: 30m
basePeriod: 15m
exchanges: [{"eid":"Futures_Binance","currency":"BTC_USDT"}]
*/

//@version=4
strategy(title="Relative Strength Index", shorttitle="RSI")
len = input(14, minval=1, title="Length")
src = input(close, "Source", type = input.source)
up = rma(max(change(src), 0), len)
down = rma(-min(change(src), 0), len)
rsi = down == 0 ? 100 : up == 0 ? 0 : 100 - (100 / (1 + up / down))
plot(rsi, "RSI", color=#8E1599)
band1 = hline(70, "Upper Band", color=#C0C0C0)
band0 = hline(30, "Lower Band", color=#C0C0C0)
fill(band1, band0, color=#9915FF, title="Background")
Rsvalue = input(defval = 40, title = "RSvalue", minval = 20, maxval = 75)


FromMonth = input(defval = 1, title = "From Month", minval = 1, maxval = 12)
FromDay   = input(defval = 1, title = "From Day", minval = 1, maxval = 31)
FromYear  = input(defval = 2015, title = "From Year", minval = 999)
ToMonth   = input(defval = 3, title = "To Month", minval = 1, maxval = 12)
ToDay     = input(defval = 1, title = "To Day", minval = 1, maxval = 31)
ToYear    = input(defval = 2022, title = "To Year", minval = 999)
start     = timestamp(FromYear, FromMonth, FromDay, 00, 00)
finish    = timestamp(ToYear, ToMonth, ToDay, 23, 59)
booking   = timestamp(ToYear, ToMonth, ToDay, 23, 59)

window()  => time >= start and time <= finish ? true : false
endtrade() => time >= booking ? true : false


longCondition = rsi< Rsvalue

if (longCondition)
    strategy.entry("BUY", strategy.long)
    strategy.close("BUY")
Published by ChaoZhang on the FMZ strategy square · last modified 2024-02-05. Collected in the Quant Trading Vault. Unvalidated research: re-test with your own data and costs before trusting it.
Build this with AgenKit
A spec is not a trading system. Paste this into your coding agent and AgenKit runs a specialist team — architecture, test-first build, risk gates, review — with paper trading on by default.
/agenkit build a production-grade trading bot with a backtest engine, risk controls and paper trading by default from strategies/Relative-Strength-Index-Long-term-Quant-Strategy.md- npx agenkit install engineering-kit in your project
- Paste the command into your agent and approve each phase
- Get tests, backtest, risk controls and a paper-trading switch
Understand it first
Before you run this, read the lesson behind the idea and how to backtest it honestly. Specs like this one are the survivors of an unknown number of trials; deflate their results accordingly.
Related specs
- ATR and EMA based Dynamic Take Profit and Stop Loss Adaptive StrategyPine Script · Mean reversion · 1h
- Adaptive Mean Reversion Trading Strategy Based on Chande Momentum OscillatorPine Script · Mean reversion · 1d
- Adaptive RSI Oscillator Dynamic Trading Strategy with Threshold OptimizationPine Script · Mean reversion · 1d
- Advanced 15 Minute Chart Trading Signal StrategyPine Script · Mean reversion · 3h
- Advanced Fibonacci Retracement Trend Following and Reversal Trading StrategyPine Script · Mean reversion · 3h
- Advanced Momentum EMA Trend Following with RSI Overbought Oversold Trading StrategyPine Script · Mean reversion · 1d