Strategy vault / Mean reversion
Relative Strength Index Stop Loss Strategy
This strategy is based on the Relative Strength Index (RSI) indicator, combined with stop loss and daily loss limit mechanisms, to algorithmically trade Nvidia stocks. Its trading decisions rely on RSI signals to…
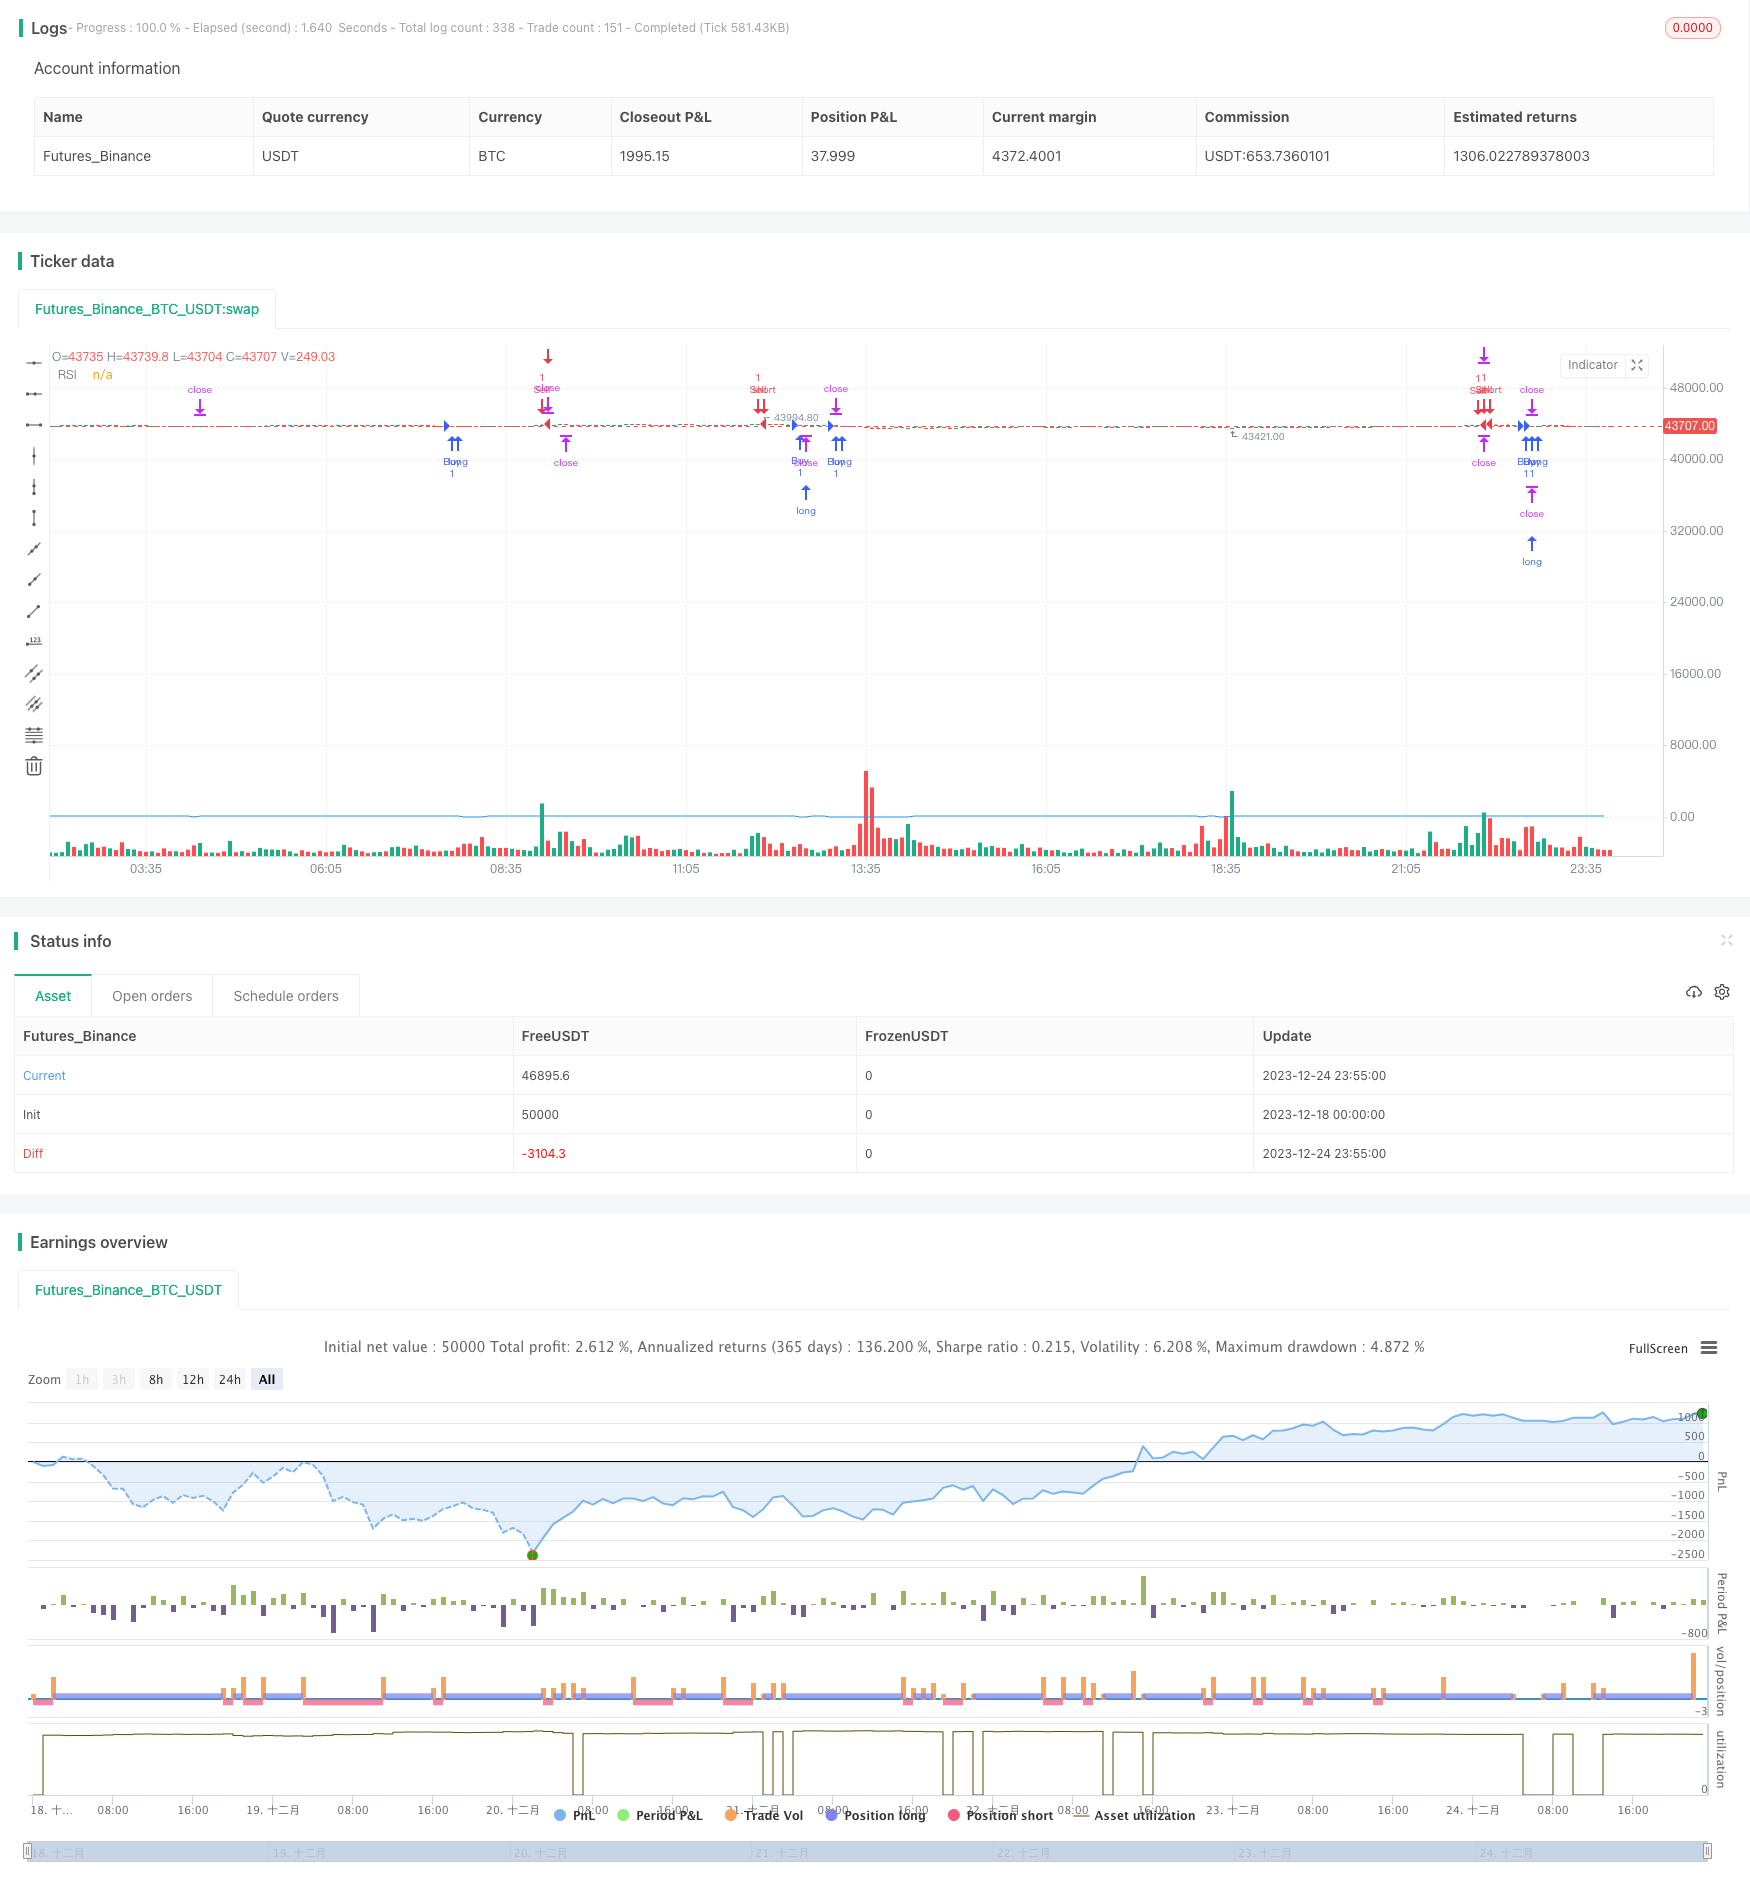
Overview
This strategy is based on the Relative Strength Index (RSI) indicator, combined with stop loss and daily loss limit mechanisms, to algorithmically trade Nvidia stocks. Its trading decisions rely on RSI signals to identify overbought and oversold conditions, establishing long and short positions accordingly. Meanwhile, the strategy sets stop loss points to limit single bet losses and defines maximum daily loss percentage to control overall risks.
Strategy Logic
When the RSI drops below the oversold threshold of 37, the stock price is considered undervalued, and a long position will be taken. When the RSI surpasses the overbought threshold of 75, the stock price is seen as overvalued, and a short position will be taken. Once the stock price movement hits the pre-set stop loss point, the position will be closed. If the maximum daily loss reaches 3% of the net value, all positions will be closed and no new trades will be made that day.
The core of this strategy relies on RSI signals to determine trading opportunities. RSI below 30 represents an oversold condition, indicating undervaluation of the stocks; while RSI above 70 is seen as an overbought condition, meaning overvaluation of the stocks. The strategy opens long/short positions at oversold/overbought levels, expecting price reversal for profits.
The stop loss mechanism is used to limit single bet losses. When the losses reach a preset percentage threshold, the positions will be closed by stop loss orders. This aims to avoid huge losses in a single trade. The daily loss limit constrains the total losses per day. If the loss exceeds 3% of the net value, all positions will be closed and no new trades will be made to prevent further losses that day.
Advantage Analysis
The advantages of this RSI stop loss strategy include:
- RSI overbought/oversold signals are relatively reliable for filtering noise trading opportunities
- Stop loss effectively limits risks of single bet losses
- Daily loss limit prevents huge losses in extreme market conditions
- The strategy rules are simple and easy to understand and implement
- Customizable RSI parameters and stop loss points suit different market environments
Risk Analysis
Some risks of this strategy include:
- RSI as a technical analysis tool cannot fully predict price trends and their timepoints
- Improper stop loss positioning may lead to premature stop loss or oversized losses
- Daily loss limit can prematurely stop trading that day, missing potential opportunities
- Inappropriate parameter settings (e.g. RSI length, overbought/oversold thresholds) can undermine strategy efficacy
- Insufficient backtest may overestimate actual profits in live trading
Optimization Directions
Some ways to optimize the strategy:
- Test optimal combinations of RSI parameters and overbought/oversold thresholds in different markets and timeframes
- Calculate statistically optimal stop loss percentage based on historical data
- Evaluate risk-return profiles of different daily loss limit levels
- Test across a basket of stocks and design a stock pooling algorithm to improve stability
- Incorporate other indicators e.g. MACD, KD to design dynamic stop loss and dynamic position sizing
- Introduce machine learning models to improve strategy returns
Conclusion
The RSI stop loss strategy integrates the strengths of technical indicators and risk control mechanisms to filter noise and control trading risks to a certain extent. With simple and clear rules, it can serve as an introductory quantitative trading strategy. However, its parameters and stop loss mechanisms have room for further optimization, with some uncertainty in probabilistic payoff. In conclusion, this strategy provides a template reference for beginners but needs prudent assessment and tuning for practical usage.
Parameters
| Name | Default | What it controls |
|---|---|---|
| v_input_1 | 15 | RSI Length |
| v_input_2 | true | Stop Loss Percentage |
Source Pine Script
//@version=5
strategy("RSI Strategy with Daily Loss Limit", overlay=true)

// Define RSI conditions
rsiValue = ta.rsi(close, 7)
rsiLength = input(15, title="RSI Length")
rsiOverbought = 75
rsiOversold = 37

// Define stop-loss percentage
stopLossPercent = input(1, title="Stop Loss Percentage") / 100

// Enter long (buy) when RSI is below 40 with stop-loss
if (rsiValue < rsiOversold)
    strategy.entry("Buy", strategy.long)

// Exit long when RSI is above 80 or when stop-loss is hit
if (rsiValue > rsiOverbought)
    strategy.exit("Buy", from_entry="Buy", loss=close * stopLossPercent)

// Enter short (sell) when RSI is above 80 with stop-loss
if (rsiValue > rsiOverbought)
    strategy.entry("Sell", strategy.short)

// Exit short when RSI is below 40 or when stop-loss is hit
if (rsiValue < rsiOversold)
    strategy.exit("Sell", from_entry="Sell", loss=close * stopLossPercent)

// Track account equity
equityLimit = strategy.equity * 0.97  // Set the daily loss limit to 3%

// Enter long (buy) when RSI is below 40
if (rsiValue < rsiOversold)
    strategy.entry("Buy", strategy.long)

// Exit long when RSI is above 80 or when stop-loss is hit
if (rsiValue > rsiOverbought)
    strategy.exit("Buy", from_entry="Buy", loss=close * stopLossPercent)

// Enter short (sell) when RSI is above 80
if (rsiValue > rsiOverbought)
    strategy.entry("Sell", strategy.short)

// Exit short when RSI is below 40 or when stop-loss is hit
if (rsiValue < rsiOversold)
    strategy.exit("Sell", from_entry="Sell", loss=close * stopLossPercent)

// Plot RSI on the chart
plot(rsiValue, title="RSI", color=color.blue)

// Stop trading for the day if the daily loss limit is reached
if (strategy.equity < equityLimit)
    strategy.close_all()
Published by ChaoZhang on the FMZ strategy square · last modified 2023-12-26. Collected in the Quant Trading Vault. Unvalidated research: re-test with your own data and costs before trusting it.
Build this with AgenKit
A spec is not a trading system. Paste this into your coding agent and AgenKit runs a specialist team — architecture, test-first build, risk gates, review — with paper trading on by default.
/agenkit build a production-grade trading bot with a backtest engine, risk controls and paper trading by default from strategies/Relative-Strength-Index-Stop-Loss-Strategy.md- npx agenkit install engineering-kit in your project
- Paste the command into your agent and approve each phase
- Get tests, backtest, risk controls and a paper-trading switch
Understand it first
Before you run this, read the lesson behind the idea and how to backtest it honestly. Specs like this one are the survivors of an unknown number of trials; deflate their results accordingly.
Related specs
- ATR and EMA based Dynamic Take Profit and Stop Loss Adaptive StrategyPine Script · Mean reversion · 1h
- Adaptive Mean Reversion Trading Strategy Based on Chande Momentum OscillatorPine Script · Mean reversion · 1d
- Adaptive RSI Oscillator Dynamic Trading Strategy with Threshold OptimizationPine Script · Mean reversion · 1d
- Advanced 15 Minute Chart Trading Signal StrategyPine Script · Mean reversion · 3h
- Advanced Fibonacci Retracement Trend Following and Reversal Trading StrategyPine Script · Mean reversion · 3h
- Advanced Momentum EMA Trend Following with RSI Overbought Oversold Trading StrategyPine Script · Mean reversion · 1d