Relative Volume Price Strategy
The relative volume price strategy is a quantitative trading strategy based on abnormal trading volume and price volatility. This strategy compares the current trading volume with the historical average to determine…
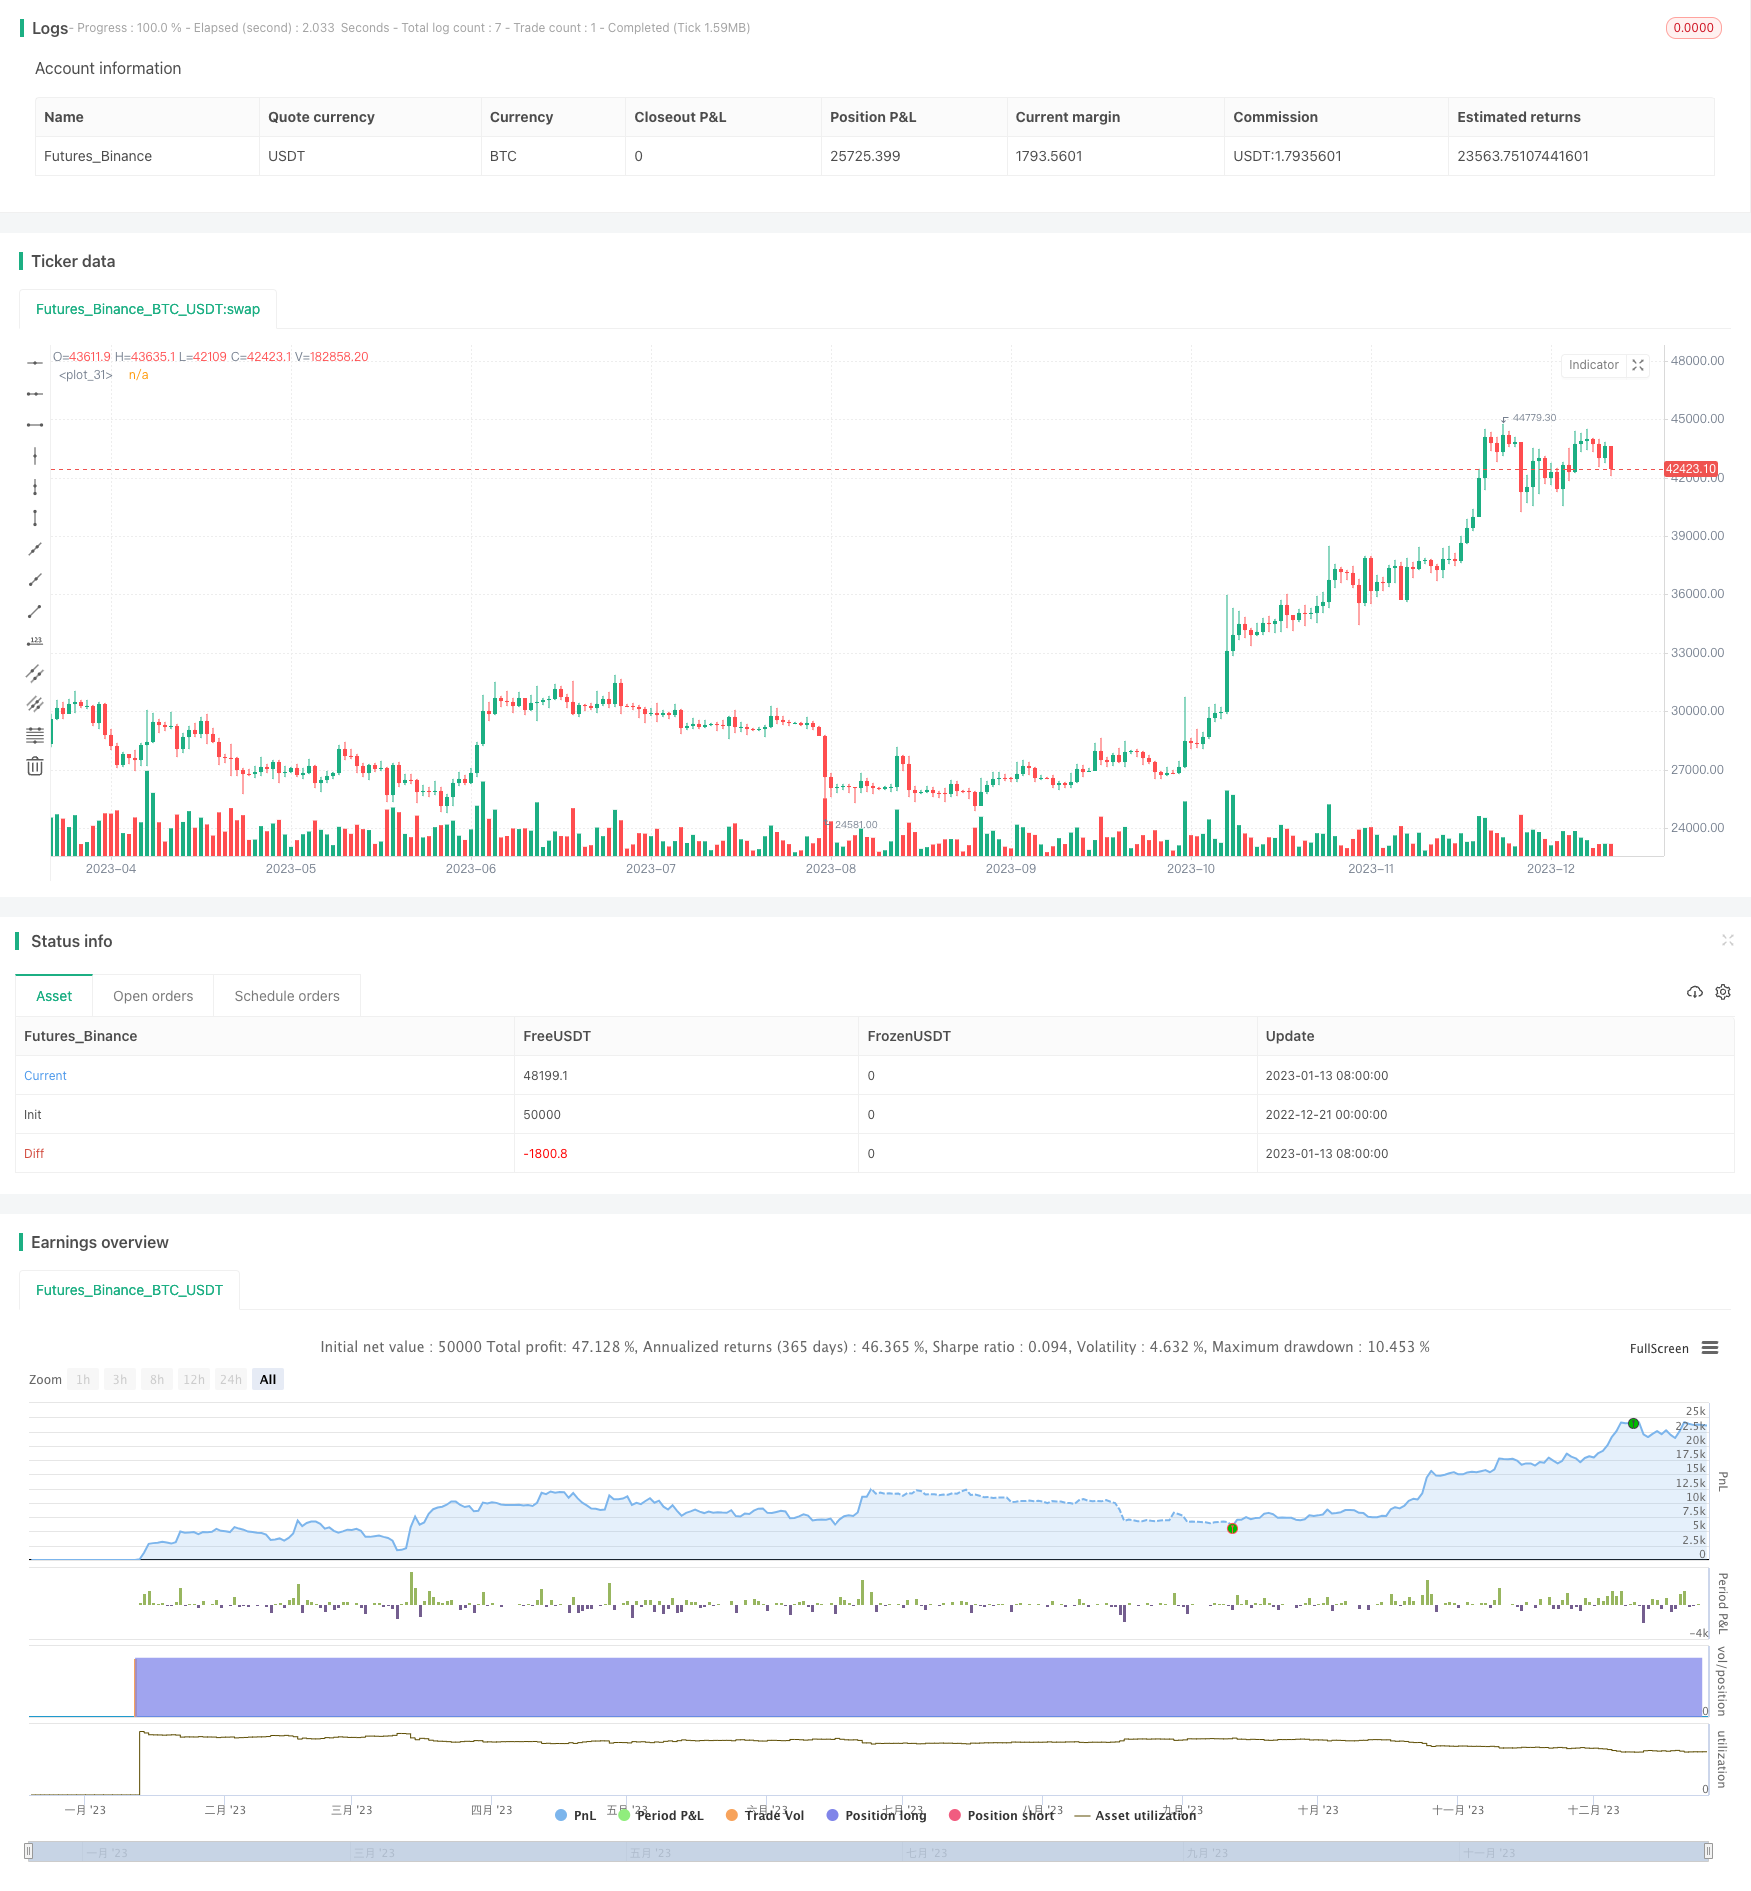
Overview
The relative volume price strategy is a quantitative trading strategy based on abnormal trading volume and price volatility. This strategy compares the current trading volume with the historical average to determine if the trading volume is abnormal. It also combines the average true range interval to determine if the price is relatively stable. When trading volume increases abnormally and the price is relatively stable, it is considered an entry signal.
Strategy Principle
The core logic of the relative volume price strategy is based on two indicators for judgment: relative trading volume and price fluctuation range.
First, we calculate the simple moving average of trading volume over the most recent 20 periods as the historical average trading volume. Then we set a multiple parameter (such as 1.5 times). When the current trading volume is greater than 1.5 times the average trading volume, we consider the trading volume to be abnormal and belonging to a "relative volume" situation.
Secondly, we calculate the average true range (ATR) over the most recent 14 periods as a measure of price volatility. At the same time, we calculate the standard deviation of the average volatility. If the current true volatility is between the average plus or minus one standard deviation, we consider the price fluctuation to be in a relatively stable range.
When the above two conditions are met at the same time, a long signal is issued to open a long position. During the holding period, twice the ATR is used as the stop loss level, and the highest price minus twice the ATR is used as the take profit level.
Advantage Analysis
The biggest advantage of the relative volume price strategy is that it captures price trends brought about by abnormal trading volume. When trading volume surges, it represents a change in the attitude of market participants, which often signals price breakouts and the formation of new trends. By comparing the relationship between trading volume and historical averages, the strategy can effectively determine the timing of abnormal trading volume.
On the other hand, the strategy also considers the volatility rate, so that signals occur during relatively stable price periods. This avoids the huge risk of loss caused by chasing highs during violent fluctuations. It also increases profit opportunities because trends usually start breaking through after relative stability.
Risk Analysis
The biggest risk of this strategy is that the trading volume indicator cannot be 100% certain of new trends. Surges in trading volume may be false breakouts and prices quickly reverse. In such cases, the strategy suffers greater losses.
To reduce losses, appropriately adjust the parameters of "relative volume" and set stricter criteria for judging abnormal trading volume. Or add other judgment indicators, such as analyzing the increase in trading volume to see if it matches the increase in turnover.
Optimization Directions
The strategy can be optimized in the following aspects:
Add other indicators for judgment, such as change ratio, turnover, etc., to make trading volume abnormal signals more reliable.
The ATR parameter can be optimized for different stocks to more accurately determine the stable price range.
Add machine learning algorithms to actively judge abnormal trading volume, not just simple comparison with historical averages.
Use deep learning models to predict price volatility, not just based on historical ATR.
Conclusion
The relative volume price strategy captures abnormal trading volume as a characteristic signal and combines price stability judgment to issue trading signals. The strategy is simple and practical, and works well in tracking abnormal stock trading volume. But there is also a certain risk of false signals that need to be further optimized by indicator judgments to improve effectiveness.
Parameters
| Name | Default | What it controls |
|---|---|---|
| v_input_1 | timestamp(01 Apr 2016 13:30 +0000) | Backtest Start Time |
| v_input_2 | false | Define backtest end-time (If false, will test up to most recent candle) |
| v_input_3 | timestamp(01 May 2021 19:30 +0000) | Backtest End Time (if checked above) |
| v_input_4 | 14 | Length of ATR to determine volatility |
| v_input_5 | 14 | Length of ATR for trailing stop loss |
| v_input_6 | 2 | ATR Multiplier for trailing stop loss |
| v_input_7 | 20 | SMA(volume) length (for relative comparison) |
| v_input_8 | 1.5 | Multiple of avg vol to consider relative volume as being high |
Source Pine Script
/*backtest
start: 2022-12-21 00:00:00
end: 2023-12-27 00:00:00
period: 1d
basePeriod: 1h
exchanges: [{"eid":"Futures_Binance","currency":"BTC_USDT"}]
*/

// This source code is subject to the terms of the Mozilla Public License 2.0 at https://mozilla.org/MPL/2.0/
// © DojiEmoji (kevinhhl)

//@version=4
strategy("[KL] Relative Volume + ATR Strategy",overlay=true,pyramiding=1)
ENUM_LONG = "Long"

// Timeframe {
backtest_timeframe_start = input(defval = timestamp("01 Apr 2016 13:30 +0000"), title = "Backtest Start Time", type = input.time)
USE_ENDTIME = input(false,title="Define backtest end-time (If false, will test up to most recent candle)")
backtest_timeframe_end = input(defval = timestamp("01 May 2021 19:30 +0000"), title = "Backtest End Time (if checked above)", type = input.time)
within_timeframe = true
// }
len_volat = input(14,title="Length of ATR to determine volatility")
ATR_volat = atr(len_volat)
avg_ATR_volat  = sma(ATR_volat, len_volat)
std_ATR_volat = stdev(ATR_volat, len_volat)
// }

// Trailing stop loss {
ATR_X2_TSL = atr(input(14,title="Length of ATR for trailing stop loss")) * input(2.0,title="ATR Multiplier for trailing stop loss",type=input.float)
TSL_source = low
var stop_loss_price = float(0)
TSL_line_color = color.green, TSL_transp = 100
if strategy.position_size == 0 or not within_timeframe
    TSL_line_color := color.black
    stop_loss_price := TSL_source - ATR_X2_TSL
else if strategy.position_size > 0
    stop_loss_price := max(stop_loss_price, TSL_source - ATR_X2_TSL)
    TSL_transp := 0
plot(stop_loss_price, color=color.new(TSL_line_color, TSL_transp))
// }

// Signals for entry {
_avg_vol = sma(volume,input(20, title="SMA(volume) length (for relative comparison)"))
_relative_vol = _avg_vol * input(1.5,title="Multiple of avg vol to consider relative volume as being high",type=input.float)
__lowerOfOpenClose = min(open,close)
_wickRatio_lower = (__lowerOfOpenClose - low) / (high - low)
entry_signal1 = volume > _relative_vol
entry_signal2 = ATR_volat < avg_ATR_volat + std_ATR_volat and ATR_volat > avg_ATR_volat - std_ATR_volat
// }


alert_per_bar(msg)=>
    prefix = "[" + syminfo.root + "] "
    suffix = "(P=" + tostring(close) + "; atr=" + tostring(ATR_volat) + ")"
    alert(tostring(prefix) + tostring(msg) + tostring(suffix), alert.freq_once_per_bar)

// MAIN:
if within_timeframe
    if strategy.position_size > 0 and strategy.position_size[1] > 0 and (stop_loss_price/stop_loss_price[1]-1) > 0.005
        alert_per_bar("TSL raised to " + tostring(stop_loss_price))

    // EXIT ::::::::::::::::::::::::::::::::::::::::::::::::::::::::::::::::::::    // placed before entry, will re-enter if stopped out
	exit_msg = close <= strategy.position_avg_price ? "stop loss" : "take profit"
	if strategy.position_size > 0 and TSL_source <= stop_loss_price
        strategy.close(ENUM_LONG, comment=exit_msg)

    // ENTRY :::::::::::::::::::::::::::::::::::::::::::::::::::::::::::::::::::
	if entry_signal1 and entry_signal2// and entry_signal3
		entry_msg = strategy.position_size > 0 ? "adding" : "initial"
		strategy.entry(ENUM_LONG, strategy.long, comment=entry_msg)

// CLEAN UP:
if strategy.position_size == 0
	stop_loss_price := float(0)
Published by ChaoZhang on the FMZ strategy square · last modified 2023-12-28. Collected in the Quant Trading Vault. Unvalidated research: re-test with your own data and costs before trusting it.
Build this with AgenKit
A spec is not a trading system. Paste this into your coding agent and AgenKit runs a specialist team — architecture, test-first build, risk gates, review — with paper trading on by default.
/agenkit build a production-grade trading bot with a backtest engine, risk controls and paper trading by default from strategies/Relative-Volume-Price-Strategy.md- npx agenkit install engineering-kit in your project
- Paste the command into your agent and approve each phase
- Get tests, backtest, risk controls and a paper-trading switch
Understand it first
Before you run this, read the lesson behind the idea and how to backtest it honestly. Specs like this one are the survivors of an unknown number of trials; deflate their results accordingly.
Related specs
- Flexible Long Short Trading Strategy Based on Keltner ChannelsPine Script · Breakout · 1d
- Momentum Breakout Trading Strategy 435896Pine Script · Breakout · 1d
- Multi Filter Trend Breakthrough Smart Moving Average Trading StrategyPine Script · Breakout · 1h
- Multi Indicator Trend Breakout Strategy with Dynamic Stop LossPine Script · Breakout · 1d
- Advanced Long Only Dynamic Trendline Breakout StrategyPine Script · Breakout · 1d
- Bollinger Band Breakout Trading StrategyPine Script · Breakout · 2h