Strategy vault / Trend following
Relative Volume Trend Following Trading Strategy
This strategy combines relative volume indicator and price action trend judgment to build an automated trading system integrating trend following and breakout. It buys when volume increases and volatility is low, and…
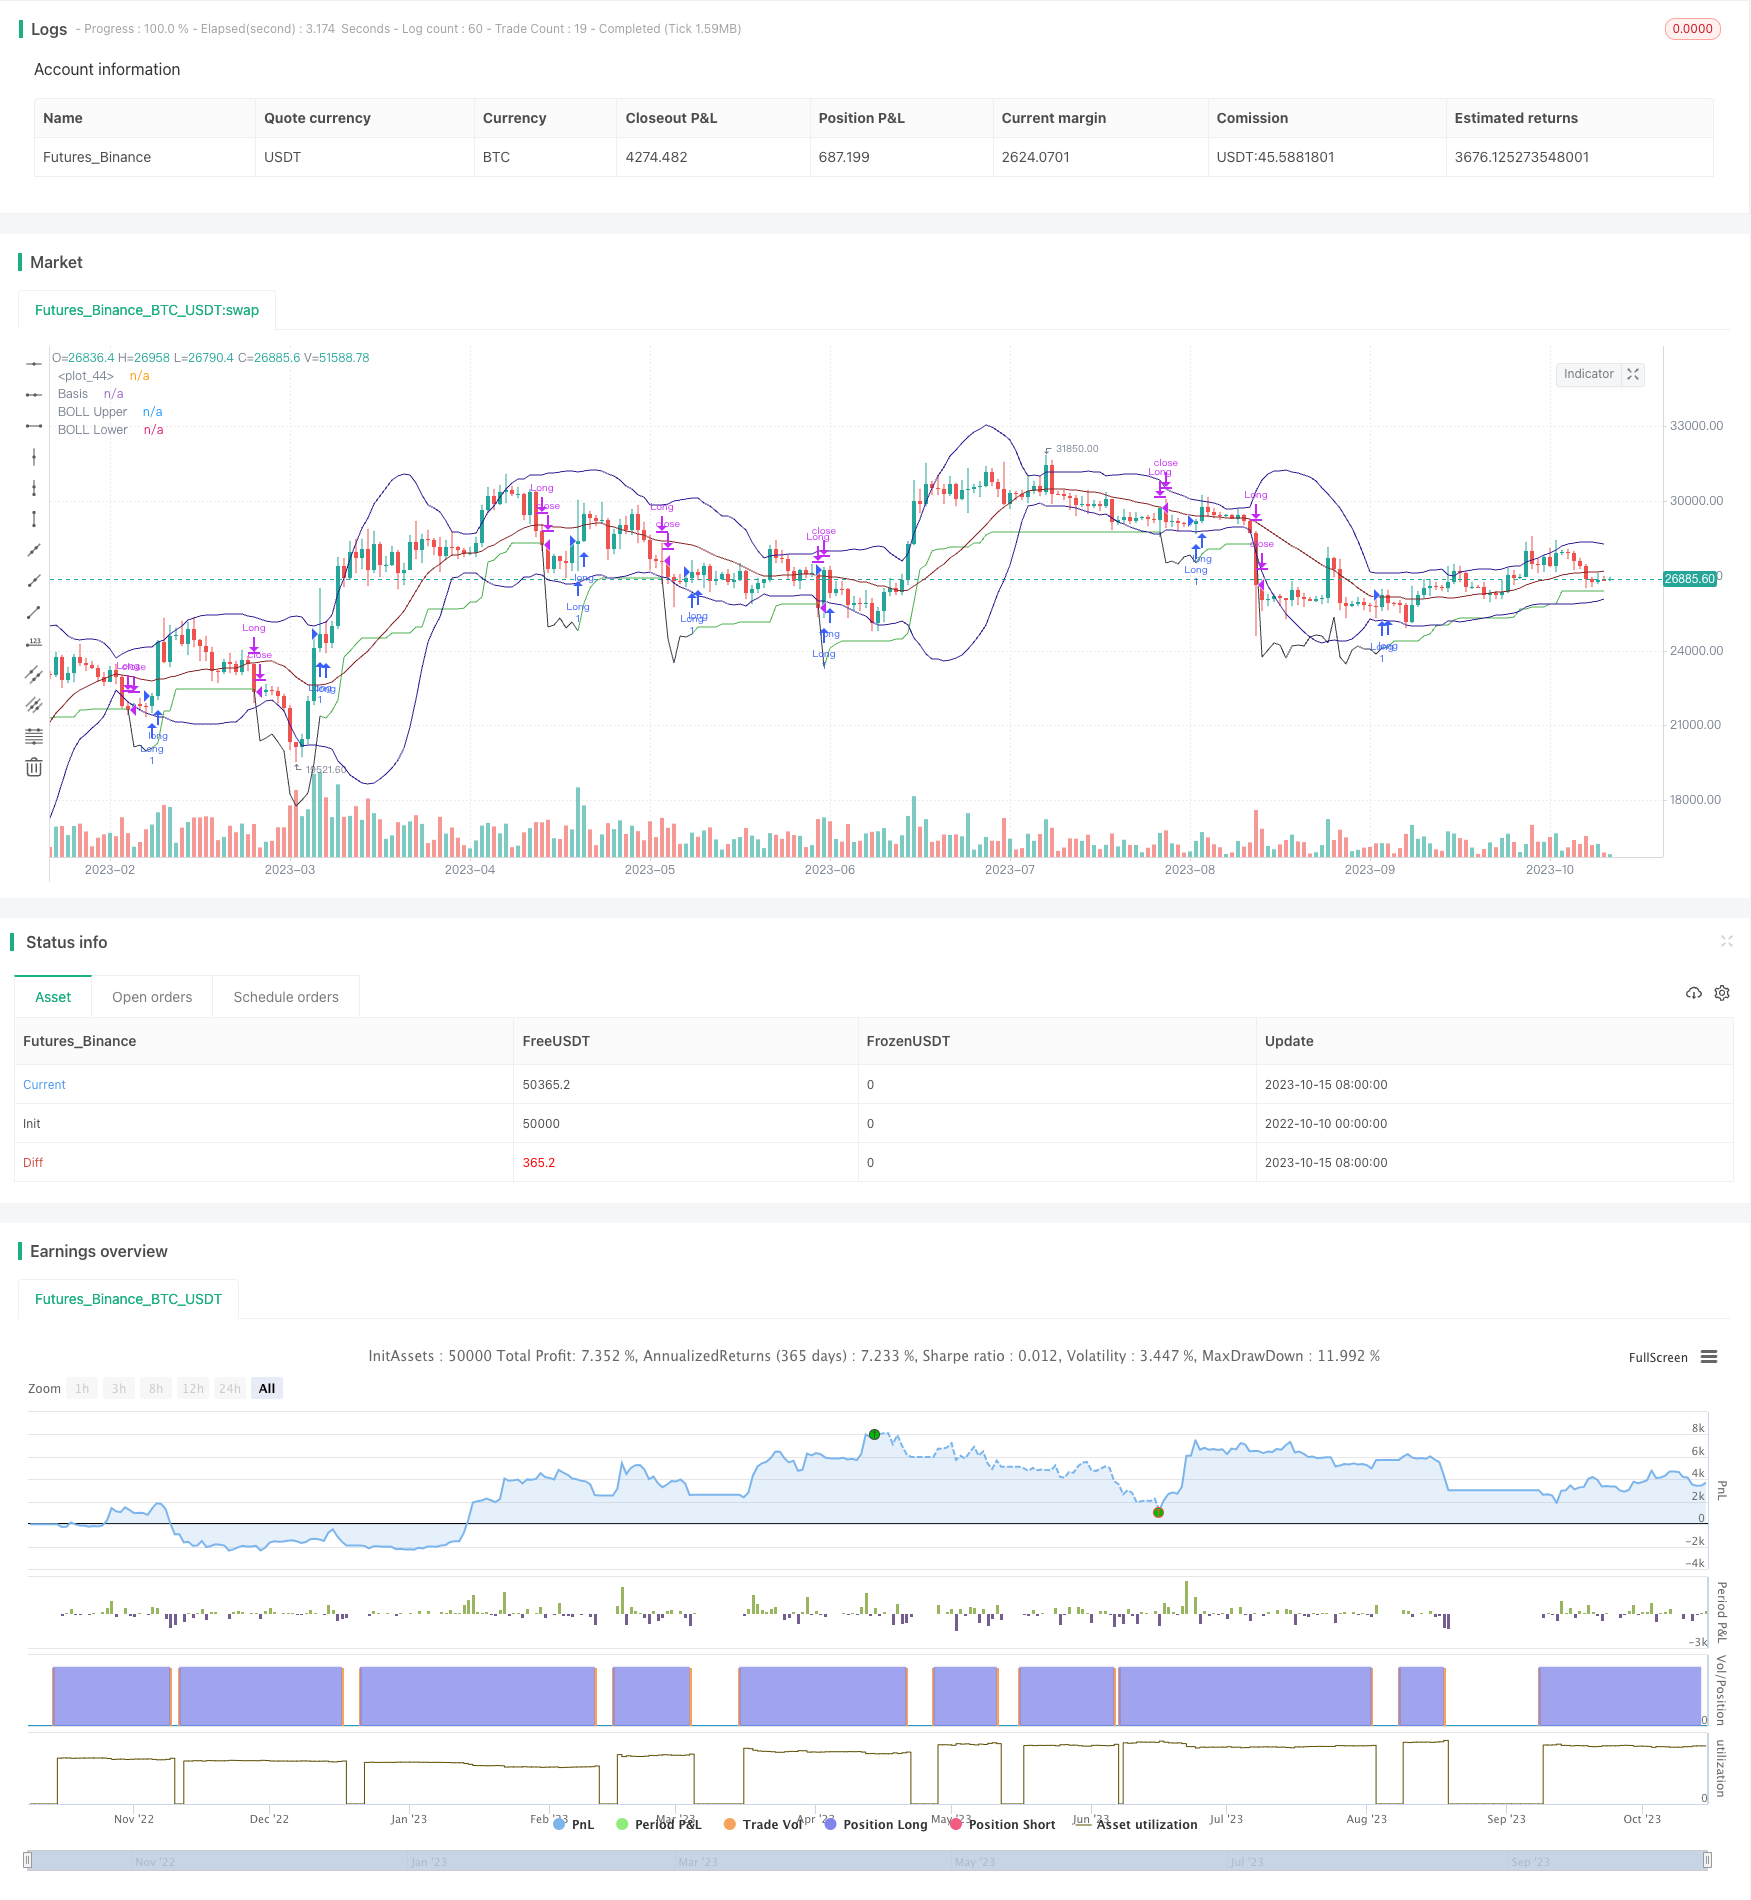
Overview
This strategy combines relative volume indicator and price action trend judgment to build an automated trading system integrating trend following and breakout. It buys when volume increases and volatility is low, and sells based on stop loss and price action.
How It Works
Use Bollinger Bands to determine if price volatility is low. Specifically by comparing ATR and BOLL band width.
Calculate the average volume of past N days, compare with current volume to see if volume has increased.
Buy when price is near low, volume increases and volatility is low.
Set stop loss, track lowest price.
Sell when price breaks below stop loss.
Sell when price forms bullish engulfing pattern.
Advantages
Combining volume and volatility filters false breakout effectively.
Trailing stop loss locks in profit maximally.
Exit signals like bullish engulfing catch trend reversal early.
Intuitive and easy to follow.
Clear rules on stop loss and take profit reduce uncertainty.
Risks
Volume indicator lags, could miss best entry point.
Exit signals like engulfing lack reliability, risks early exit.
Wider stop risks larger loss on single trade.
Needs tuning of parameters like ATR period and volume period to avoid over trading.
Need to optimize exit rules to avoid unnecessary exit.
Enhancement Opportunities
Try additional filters like MACD to improve entry signals.
Optimize ATR and volume periods to reduce over trading.
Explore other exit signals like price breaking lower band.
Research trailing stop loss to lock in more profit.
Test different holding periods for best performance.
Backtest on different products to find the best fit.
Summary
The strategy is relatively simple, using volume and price action for trend following. It has clear signals and easy tracking. But the quality of filters and exit rules can be further improved for more reliable performance. With continued efforts on parameter tuning and entry/exit design, outstanding results could be achieved.
Parameters
| Name | Default | What it controls |
|---|---|---|
| v_input_1 | timestamp(01 Apr 2016 13:30 +0000) | Backtest Start Time |
| v_input_2 | false | Define backtest end-time (If false, will test up to most recent candle) |
| v_input_3 | timestamp(01 May 2021 19:30 +0000) | Backtest End Time (if checked above) |
| v_input_4 | 10 | Length of ATR [Trailing Stop Loss] (x2) |
| v_input_5 | 5 | SMA(volume) length (for relative comparison) |
Source Pine Script
/*backtest
start: 2022-10-10 00:00:00
end: 2023-10-16 00:00:00
period: 1d
basePeriod: 1h
exchanges: [{"eid":"Futures_Binance","currency":"BTC_USDT"}]
*/

// This source code is subject to the terms of the Mozilla Public License 2.0 at https://mozilla.org/MPL/2.0/
// © DojiEmoji (kevinhhl)

//@version=4
strategy("[KL] Relative Volume Strategy",overlay=true,pyramiding=1)
ENUM_LONG = "Long"
VERBOSE_MODE = false
opened_position = false

// Timeframe {
backtest_timeframe_start = input(defval = timestamp("01 Apr 2016 13:30 +0000"), title = "Backtest Start Time", type = input.time)
USE_ENDTIME = input(false,title="Define backtest end-time (If false, will test up to most recent candle)")
backtest_timeframe_end = input(defval = timestamp("01 May 2021 19:30 +0000"), title = "Backtest End Time (if checked above)", type = input.time)
within_timeframe = true
// }

// Volatility Indicators {
// BOLL:
BOLL_length = 20, BOLL_src = close, SMA20 = sma(BOLL_src, BOLL_length), BOLL_sDEV_x2 = 2 * stdev(BOLL_src, BOLL_length)
BOLL_upper = SMA20 + BOLL_sDEV_x2, BOLL_lower = SMA20 - BOLL_sDEV_x2
plot(SMA20, "Basis", color=#872323, offset = 0)
BOLL_p1 = plot(BOLL_upper, "BOLL Upper", color=color.navy, offset = 0, transp=50)
BOLL_p2 = plot(BOLL_lower, "BOLL Lower", color=color.navy, offset = 0, transp=50)
//fill(BOLL_p1, BOLL_p2, title = "Background", color=#198787, transp=85)
// ATR v. sDev of prices
ATR_x2 = atr(input(10,title="Length of ATR [Trailing Stop Loss] (x2)"))*2
//plot(SMA20+ATR_x2, "SMA20 + ATR_x2", color=color.gray, offset = 0, transp=50)
//plot(SMA20-ATR_x2, "SMA20 - ATR_x2", color=color.gray, offset = 0, transp=50)
//plotchar(ATR_x2, "ATR_x2", "", location = location.bottom)
is_low_volat = ATR_x2 > BOLL_sDEV_x2
// }

// Trailing stop loss {
TSL_source = low

var entry_price = float(0), var stop_loss_price = float(0)

TSL_line_color = color.green
if strategy.position_size == 0 or not within_timeframe
    TSL_line_color := color.black
    stop_loss_price := TSL_source - ATR_x2
else if strategy.position_size > 0
    stop_loss_price := max(stop_loss_price, TSL_source - ATR_x2)
plot(stop_loss_price, color=TSL_line_color)

// }

// Relative volume indicator {
LEN_RELATIVE_VOL = input(5, title="SMA(volume) length (for relative comparison)")
relative_vol = sma(volume,LEN_RELATIVE_VOL)
// }

// price actions {
bar_range_ratio = abs(close-open)/(high-low)
engulfing = low < low[1] and high > high[1] and abs(close-open) > abs(close-open)[1]
// }

// MAIN:
if within_timeframe
	entry_msg = "", exit_msg = close <= entry_price ? "stop loss" : "take profit"

    // ENTRY :::::::::::::::::::::::::::::::::::::::::::::::::::::::::::::::::::::::::::::::::::::
	if close > open and volume > relative_vol and is_low_volat
		if strategy.position_size > 0
			entry_msg := "adding"
		else if strategy.position_size == 0
			entry_msg := "initial"

		if strategy.position_size == 0
			entry_price := close
			stop_loss_price := TSL_source - ATR_x2
			ATR_x2 := ATR_x2

		strategy.entry(ENUM_LONG, strategy.long, comment=entry_msg)

    // EXIT ::::::::::::::::::::::::::::::::::::::::::::::::::::::::::::::::::::::::::::::::::::::
	if strategy.position_size > 0
		bExit = false
		// EXIT: Case (A) touches trailing stop loss
		if TSL_source <= stop_loss_price
			exit_msg := exit_msg + "[TSL]"
			bExit := true
		// EXIT: Case (B)
		else if close < open and not is_low_volat and engulfing and (high-low) > ATR_x2
			exit_msg := VERBOSE_MODE ? exit_msg + "[engulfing bearish]" : exit_msg
			bExit := true
        strategy.close(ENUM_LONG, when=bExit, comment=exit_msg)

// CLEAN UP:
if strategy.position_size == 0
	entry_price := 0
	stop_loss_price := float(0)
Published by ChaoZhang on the FMZ strategy square · last modified 2023-10-17. Collected in the Quant Trading Vault. Unvalidated research: re-test with your own data and costs before trusting it.
Build this with AgenKit
A spec is not a trading system. Paste this into your coding agent and AgenKit runs a specialist team — architecture, test-first build, risk gates, review — with paper trading on by default.
/agenkit build a production-grade trading bot with a backtest engine, risk controls and paper trading by default from strategies/Relative-Volume-Trend-Following-Trading-Strategy.md- npx agenkit install engineering-kit in your project
- Paste the command into your agent and approve each phase
- Get tests, backtest, risk controls and a paper-trading switch
Understand it first
Before you run this, read the lesson behind the idea and how to backtest it honestly. Specs like this one are the survivors of an unknown number of trials; deflate their results accordingly.
Related specs
- Multi Indicator Trend Following Strategy with Bollinger Bands and ATR Dynamic Stop LossPine Script · Trend following · 1d
- Bollinger Bands and RSI Trend Following StrategyPine Script · Trend following · 1h
- Dynamic Moving Average and Bollinger Bands Cross Strategy with Fixed Stop Loss Optimization ModelPine Script · Trend following · 3h
- EMA and RSI Trend Trading StrategyPine Script · Trend following · 1d
- Fixed Range Volume Profile And Anchored VWAP Trend Identification Strategy With Dynamic Stop LossPine Script · Trend following · 1h
- Multi Period Moving Average Ribbon and MACD Crossover Strategy SystemPine Script · Trend following · 1h