Strategy vault / Mean reversion
Reverasal Indicator Strategy
This is a revasal trading strategy based on multiple technical indicators. It combines CCI, Momentum indicator, RSI and other indicators to identify potential long and short trading opportunities. The strategy…
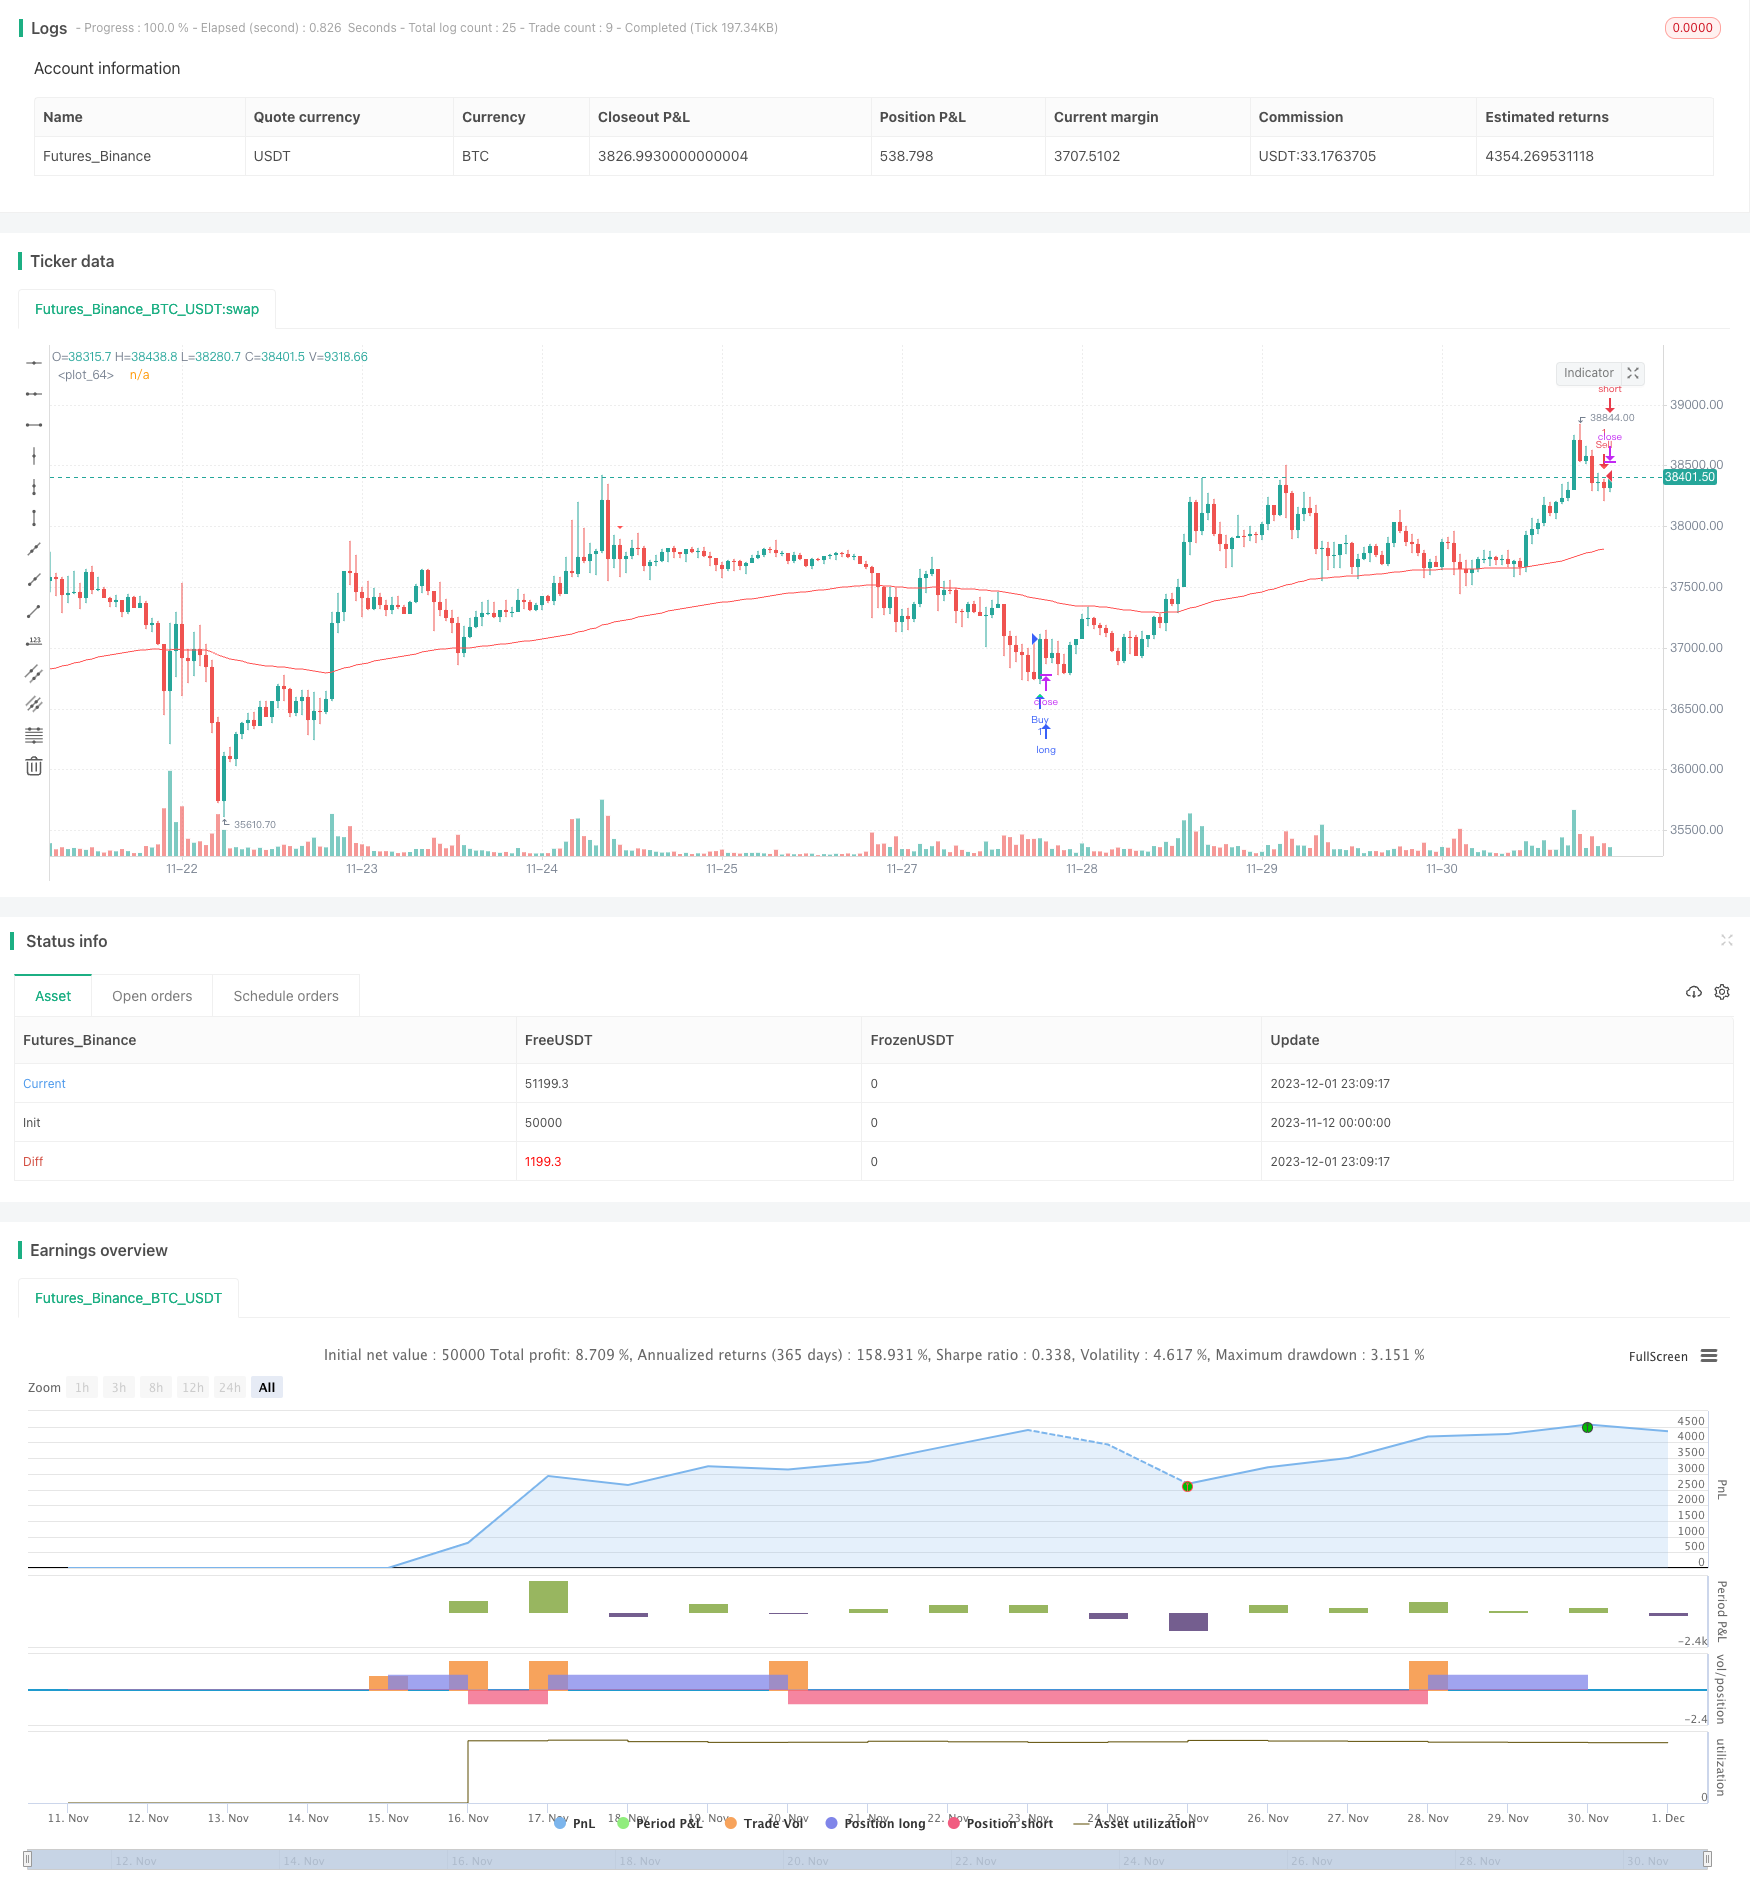
Overview
This is a revasal trading strategy based on multiple technical indicators. It combines CCI, Momentum indicator, RSI and other indicators to identify potential long and short trading opportunities. The strategy generates trading signals when indicators show overbought/oversold signals and prices pull back.
Strategy Logic
The strategy's trading signals come from a custom indicator called "Edri Extreme Points Buy & Sell". It takes into account CCI, Momentum indicator and RSI crossovers. Specific logics are:
Long signal conditions:
- The "Edri Extreme Points Buy & Sell" indicator triggers a buy signal, i.e. CCI crossing above 0 or Momentum crossing above 0, and RSI is below oversold level.
- The price pulls back to or below the 100-period EMA.
Short signal conditions:
- The "Edri Extreme Points Buy & Sell" indicator triggers a sell signal, i.e. CCI crossing below 0 or Momentum crossing below 0, and RSI is above overbought level.
- The price pulls back to or above the 100-period EMA.
The strategy can also be configured to find regular bullish/bearish divergences, generating trading signals only when RSI diverges significantly from price.
When trading signals are triggered, the strategy sets stop loss at entry price ± 2ATR, take profit at entry price ± 4ATR. This allows reasonable stop loss and take profit range based on market volatility.
Advantage Analysis
- Combining multiple indicators avoids false signals from a single indicator.
- Reversal trading style catches mid-term opportunities in range-bound markets.
- ATR-based stop loss and take profit can adjust positions based on market volatility.
- Finding divergence avoids opening positions without extreme overbought/oversold levels.
Risk Analysis
- Improper indicator parameters may lead to missing opportunities or too many wrong signals.
- Reversal trading may cause consecutive stop loss in trending markets.
- ATR has lagging effect and cannot update stop loss/take profit timely in fast-moving markets.
Solutions:
- Backtest and optimize indicator parameters to find the best combination.
- Consider suspending the strategy when trend is strong.
- Combine with other stop loss methods like moving stop loss or contrarian stop loss.
Optimization Directions
- Test different parameter combinations of CCI, Momentum length, RSI parameters, ATR multiplier etc.
- Add other filtering conditions like price patterns, volume changes etc.
- Adjust position sizing rules like ATR-based position ratio.
- Set parameter templates for different products and timeframes.
- Consider adding trend tracking to suspend reversal trading in trending markets.
Summary
The strategy mainly works for range-bound markets, capturing mid-term reversals for relatively steady gains. It helps identify short-term price stretches and generates trading signals based on multiple indicators. With proper optimization and risk management, its advantages can be effectively utilized. Still be aware the intrinsic weaknesses of reversal trading, the possibility of continuous losses in strong trends. Overall the strategy suits investors with some quant and risk management experience.
Parameters
| Name | Default | What it controls |
|---|---|---|
| v_input_string_1 | 0 | Entry Signal Source: CCI | Momentum |
| v_input_int_1 | 10 | CCI/Momentum Length |
| v_input_bool_1 | true | Find Regular Bullish/Bearish Divergence |
| v_input_int_2 | 65 | RSI Overbought Level |
| v_input_int_3 | 35 | RSI Oversold Level |
| v_input_int_4 | 14 | RSI Length |
| v_input_bool_2 | false | Plot Mean Reversion Bands on the chart |
| v_input_1 | 200 | Lookback Period (EMA) |
| v_input_float_1 | 1.8 | Outer Bands Multiplier |
Source Pine Script
/*backtest
start: 2023-11-12 00:00:00
end: 2023-12-02 00:00:00
period: 1h
basePeriod: 15m
exchanges: [{"eid":"Futures_Binance","currency":"BTC_USDT"}]
*/

// This source code is subject to the terms of the Mozilla Public License 2.0 at https://mozilla.org/MPL/2.0/
// © MagicStrategies

//@version=5
strategy("Reversal Indicator Strategy", overlay = true)

// Input settings
ccimomCross = input.string('CCI', 'Entry Signal Source', options=['CCI', 'Momentum'], tooltip='CCI or Momentum will be the final source of the Entry signal if selected.')
ccimomLength = input.int(10, minval=1, title='CCI/Momentum Length')
useDivergence = input.bool(true, title='Find Regular Bullish/Bearish Divergence', tooltip='If checked, it will only consider an overbought or oversold condition that has a regular bullish or bearish divergence formed inside that level.')
rsiOverbought = input.int(65, minval=1, title='RSI Overbought Level', tooltip='Adjusting the level to extremely high may filter out some signals especially when the option to find divergence is checked.')
rsiOversold = input.int(35, minval=1, title='RSI Oversold Level', tooltip='Adjusting this level extremely low may filter out some signals especially when the option to find divergence is checked.')
rsiLength = input.int(14, minval=1, title='RSI Length')
plotMeanReversion = input.bool(false, 'Plot Mean Reversion Bands on the chart', tooltip='This function doesn\'t affect the entry of signal but it suggests buying when the price is at the lower band, and then sell it on the next bounce at the higher bands.')
emaPeriod = input(200, title='Lookback Period (EMA)')
bandMultiplier = input.float(1.8, title='Outer Bands Multiplier', tooltip='Multiplier for both upper and lower bands')


// CCI and Momentum calculation
momLength = ccimomCross == 'Momentum' ? ccimomLength : 10
mom = close - close[momLength]
cci = ta.cci(close, ccimomLength)
ccimomCrossUp = ccimomCross == 'Momentum' ? ta.cross(mom, 0) : ta.cross(cci, 0)
ccimomCrossDown = ccimomCross == 'Momentum' ? ta.cross(0, mom) : ta.cross(0, cci)

// RSI calculation
src = close
up = ta.rma(math.max(ta.change(src), 0), rsiLength)
down = ta.rma(-math.min(ta.change(src), 0), rsiLength)
rsi = down == 0 ? 100 : up == 0 ? 0 : 100 - 100 / (1 + up / down)
oversoldAgo = rsi[0] <= rsiOversold or rsi[1] <= rsiOversold or rsi[2] <= rsiOversold or rsi[3] <= rsiOversold
overboughtAgo = rsi[0] >= rsiOverbought or rsi[1] >= rsiOverbought or rsi[2] >= rsiOverbought or rsi[3] >= rsiOverbought

// Regular Divergence Conditions
bullishDivergenceCondition = rsi[0] > rsi[1] and rsi[1] < rsi[2]
bearishDivergenceCondition = rsi[0] < rsi[1] and rsi[1] > rsi[2]

// Entry Conditions
longEntryCondition = ccimomCrossUp and oversoldAgo and (not useDivergence or bullishDivergenceCondition)
shortEntryCondition = ccimomCrossDown and overboughtAgo and (not useDivergence or bearishDivergenceCondition)


// Mean Reversion Indicator
meanReversion = plotMeanReversion ? ta.ema(close, emaPeriod) : na
stdDev = plotMeanReversion ? ta.stdev(close, emaPeriod) : na
upperBand = plotMeanReversion ? meanReversion + stdDev * bandMultiplier : na
lowerBand = plotMeanReversion ? meanReversion - stdDev * bandMultiplier : na


// Plotting
plotshape(longEntryCondition, title='BUY', style=shape.triangleup, text='B', location=location.belowbar, color=color.new(color.lime, 0), textcolor=color.new(color.white, 0), size=size.tiny)
plotshape(shortEntryCondition, title='SELL', style=shape.triangledown, text='S', location=location.abovebar, color=color.new(color.red, 0), textcolor=color.new(color.white, 0), size=size.tiny)

plot(upperBand, title='Upper Band', color=color.new(color.fuchsia, 0), linewidth=1)
plot(meanReversion, title='Mean', color=color.new(color.gray, 0), linewidth=1)
plot(lowerBand, title='Lower Band', color=color.new(color.blue, 0), linewidth=1)

// Entry signal alerts
alertcondition(longEntryCondition, title='BUY Signal', message='Buy Entry Signal')
alertcondition(shortEntryCondition, title='SELL Signal', message='Sell Entry Signal')
alertcondition(longEntryCondition or shortEntryCondition, title='BUY or SELL Signal', message='Entry Signal')

ema100 = ta.ema(close, 100)
plot(ema100, color=color.red)

// Define trading signals based on the original indicator's entry conditions
// Buy if long condition is met and price has pulled back to or below the 100 EMA
longCondition  = longEntryCondition and close <= ema100
// Sell if short condition is met and price has pulled back to or above the 100 EMA
shortCondition = shortEntryCondition and close >= ema100

// Strategy Entries
if longCondition
    strategy.entry("Buy", strategy.long)
if shortCondition
strategy.entry("Sell", strategy.short)Published by ChaoZhang on the FMZ strategy square · last modified 2023-12-13. Collected in the Quant Trading Vault. Unvalidated research: re-test with your own data and costs before trusting it.
Build this with AgenKit
A spec is not a trading system. Paste this into your coding agent and AgenKit runs a specialist team — architecture, test-first build, risk gates, review — with paper trading on by default.
/agenkit build a production-grade trading bot with a backtest engine, risk controls and paper trading by default from strategies/Reverasal-Indicator-Strategy.md- npx agenkit install engineering-kit in your project
- Paste the command into your agent and approve each phase
- Get tests, backtest, risk controls and a paper-trading switch
Understand it first
Before you run this, read the lesson behind the idea and how to backtest it honestly. Specs like this one are the survivors of an unknown number of trials; deflate their results accordingly.
Related specs
- MACD RSI and EMA StrategyPine Script · Mean reversion · 1d
- ATR and EMA based Dynamic Take Profit and Stop Loss Adaptive StrategyPine Script · Mean reversion · 1h
- Advanced Momentum EMA Trend Following with RSI Overbought Oversold Trading StrategyPine Script · Mean reversion · 1d
- Customizable Non Repainting HTF MACD MFI Scalable Bot StrategyPine Script · Mean reversion · 1d
- Dynamic Adaptive Multi Timeframe Trend Following and Range Reversal Hybrid StrategyPine Script · Mean reversion · 2d
- Four Indicator Momentum Reversal StrategyPine Script · Mean reversion · 45m