Reversal Momentum Breakout Strategy
The Reversal Momentum Breakout Strategy is a quantitative trading strategy that generates trading signals using price reversal and momentum indicators. Based on the theory of "momentum leads price", this strategy…
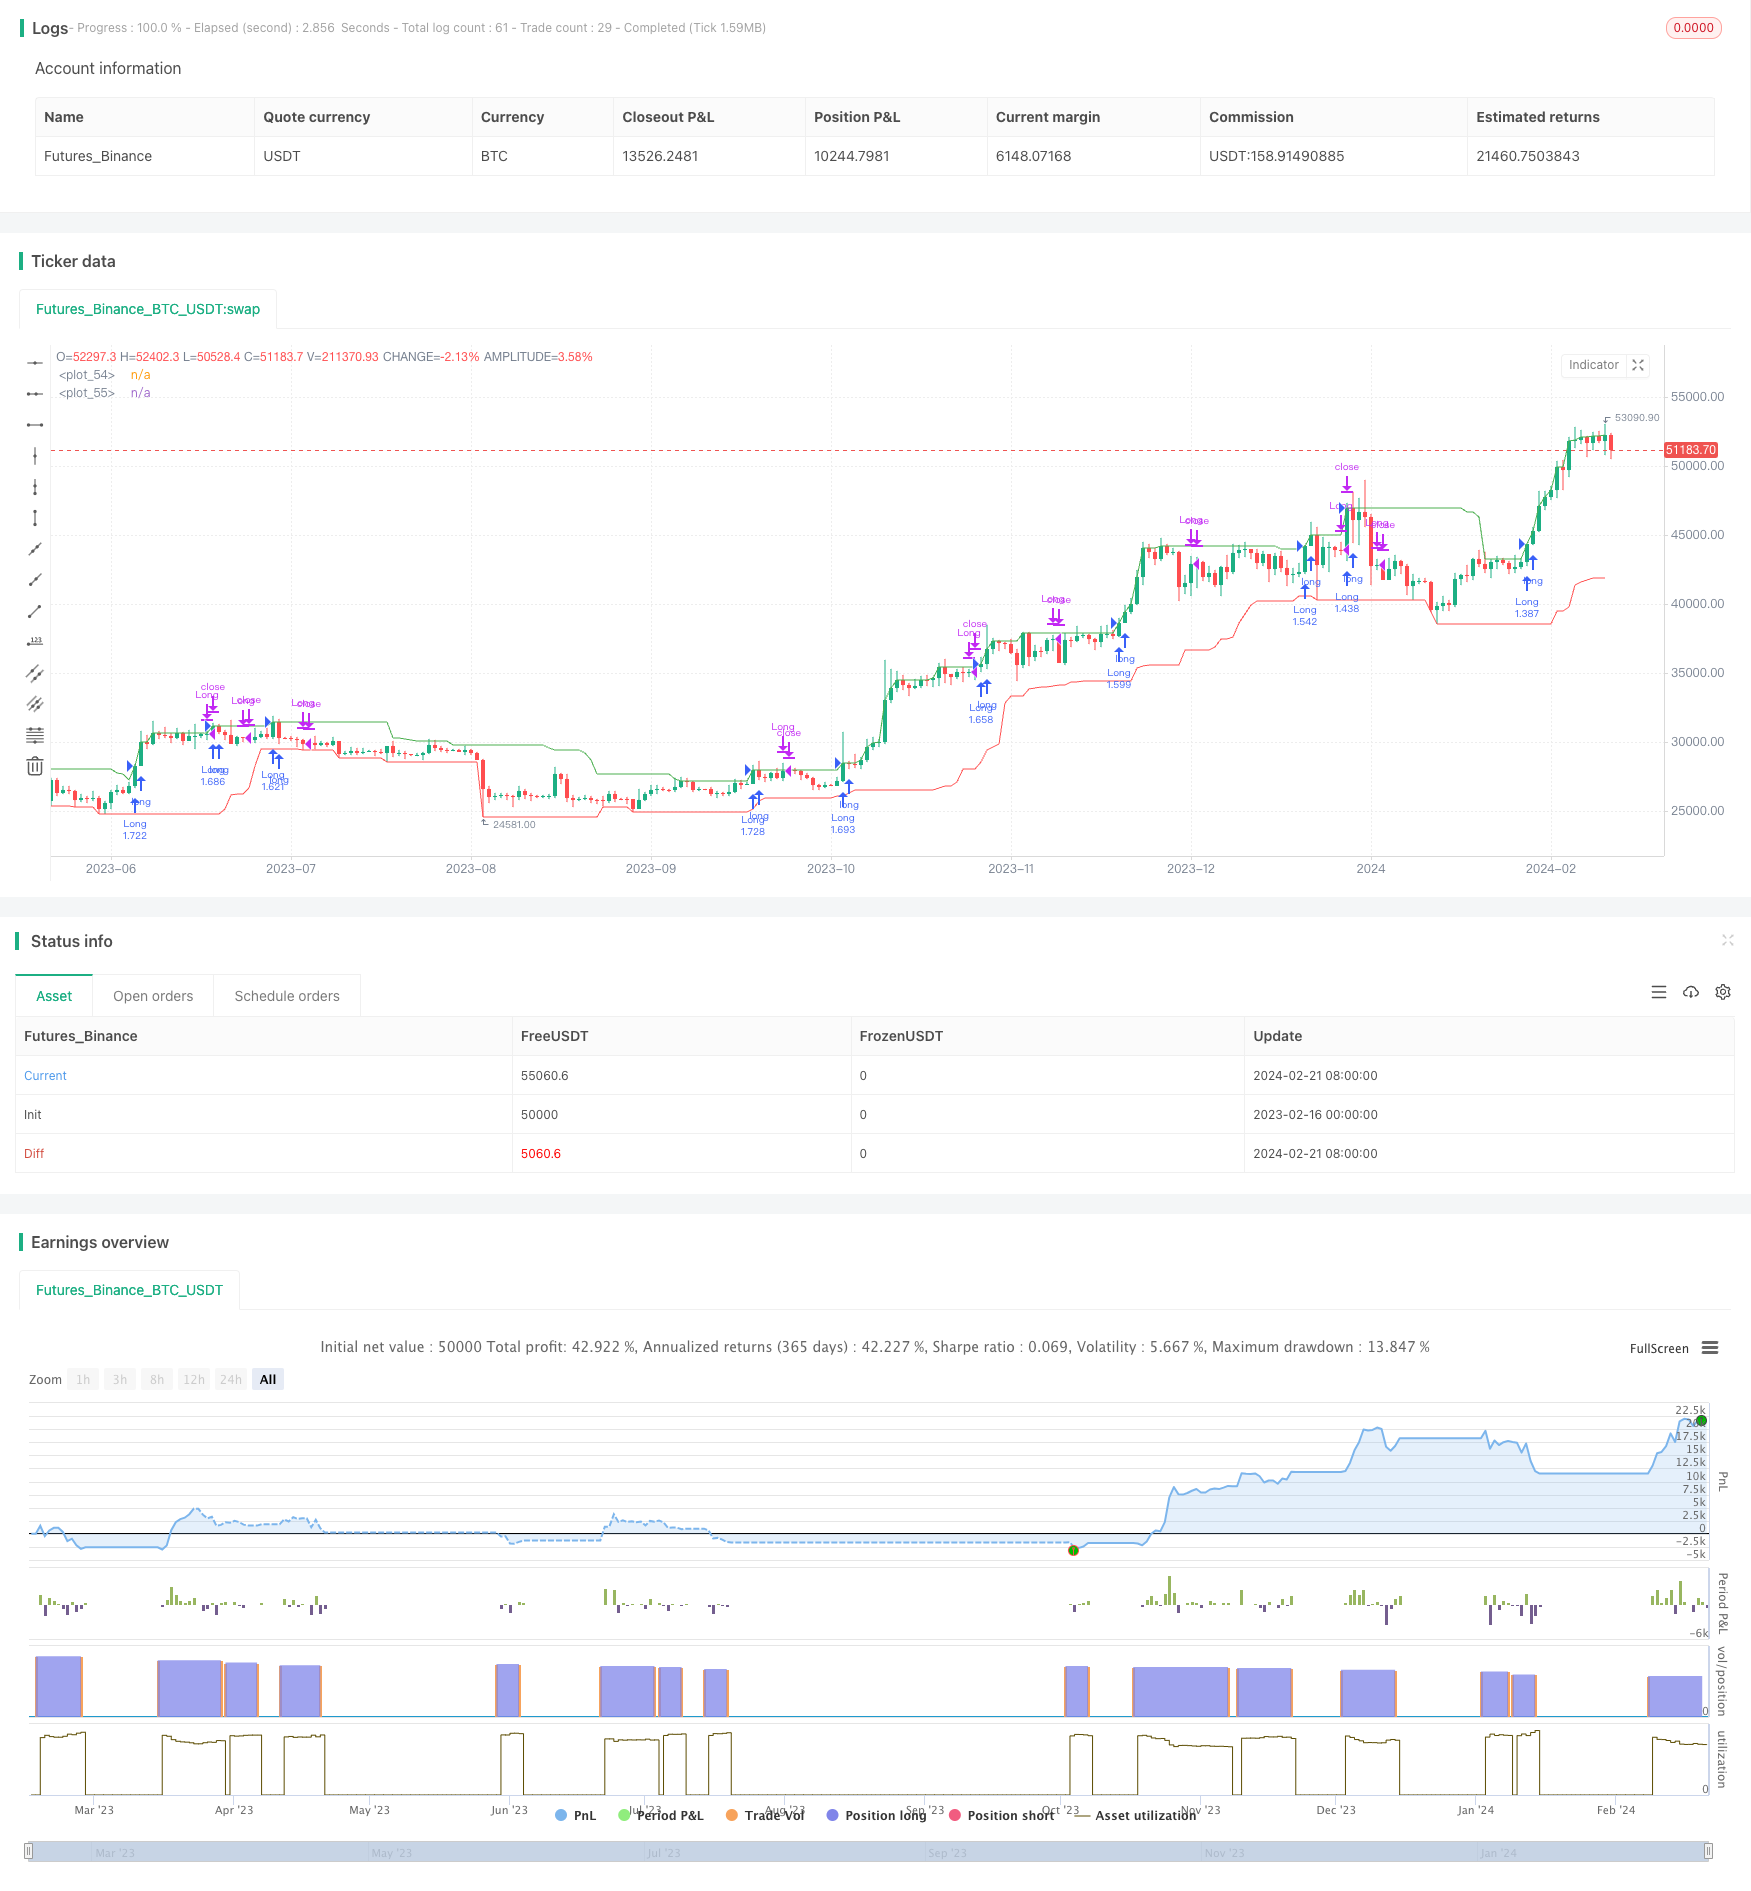
Overview
The Reversal Momentum Breakout Strategy is a quantitative trading strategy that generates trading signals using price reversal and momentum indicators. Based on the theory of "momentum leads price", this strategy tracks the highest and lowest prices over a certain period to determine whether the market is at a key reversal point to capture reversal opportunities.
Strategy Principle
The core logic of this strategy is to identify market reversal points by calculating the highest and lowest prices over a specified lookback window (e.g. 20 days). The specific logic is:
Calculate the highest price (window_high) and lowest price (window_low) over the past 20 days.
If today's high is higher than the maximum of the past 20 days (a new 20-day high), enter the high reversal monitoring period and set the counter to 5 days.
If no new high occurs, deduct the counter by 1 each day. When the counter reaches 0, the high reversal monitoring period ends.
The judgment logic for the lowest price is similar. If a new low occurs, enter the low reversal monitoring period.
long and short positions are taken within the reversal monitoring periods. Reversal signals near the key reversal points allow capturing larger moves.
The strategy also sets the start trading time to avoid generating signals on historical data.
Advantage Analysis
The Reversal Momentum Breakout Strategy has the following main advantages:
Captures reversal opportunities, suitable for reversal trends. Markets often show some degree of reversal after a sustained uptrend or downtrend. This strategy aims to capture these turning points.
Momentum leads, relatively sensitive. Tracking the highest and lowest prices over a window can sensitively identify price reversal trends and timing.
Reversal monitoring periods avoid false signals. Signals are generated only around key reversal points, filtering out some noise.
Allows long and short positions. Alternates between long and short following market direction.
Relatively simple logic, easy to implement. Mainly relies on price and simple momentum indicators, easy to code.
Risk Analysis
The main risks of this strategy include:
Inaccurate reversal prediction. The strategy can incur losses if the market trends directionally.
Overall market trends not considered. Individual stock reversals do not necessarily represent market reversals. Market analysis should be combined.
Potentially large drawdowns. Drawdown may expand without actual reversals.
Data fitting bias. Performance may significantly differ from backtests.
Parameter sensitivity. Window period, counter parameters etc. affect stability.
Corresponding risk control methods include optimizing stop loss, incorporating market factors, adjusting parameter combinations and verifying stability.
Enhancement Directions
The main optimization directions include:
Incorporate market indicators. Assess market strength to avoid unfavorable big picture environments.
Multi-factor stock selection. Select stocks with sound fundamentals and overvaluation.
Parameter optimization. Adjust window period and counter parameters to find optimal parameter combinations.
Add stop loss strategies e.g trailing stops, volatility stops to control max drawdown.
Increase machine learning predictive accuracy of price reversals.
Conclusion
The Reversal Momentum Breakout Strategy identifies reversal opportunities by tracking price and momentum. It reacts sensitively and identifies reversal trends and timing. But it has risks that require proper optimizations and risk control. Overall, when thoroughly understood and optimized, it can form an effective component of a quantitative trading system.
Parameters
| Name | Default | What it controls |
|---|---|---|
| v_input_int_1 | 20 | New Highs and Lows Window |
| v_input_int_2 | 5 | Decay |
| v_input_1 | timestamp(1 Jan 2023) | Start Date |
| v_input_bool_1 | false | Allow shorting |
Source Pine Script
/*backtest
start: 2023-02-16 00:00:00
end: 2024-02-22 00:00:00
period: 1d
basePeriod: 1h
exchanges: [{"eid":"Futures_Binance","currency":"BTC_USDT"}]
*/

//@version=5
strategy("New Highs and Lows Momentum Strategy", overlay = true, default_qty_type = strategy.percent_of_equity, default_qty_value = 100)

window = input.int(20, title="New Highs and Lows Window", minval=1)
decay = input.int(5, title="Decay", minval=1)
startDate = input(timestamp("1 Jan 2023"), title = "Start Date")
allowShort = input.bool(false, title = "Allow shorting")

var int highDecayCounter = 0
var bool isHighPeriod = false
var int lowDecayCounter = 0
var bool isLowPeriod = false

inTradeWindow = true

window_high = ta.highest(close, window)
window_low = ta.lowest(low, window)

// Logic for Highs
if window_high > ta.highest(close, window)[1]
    highDecayCounter := decay
    isHighPeriod := true
else
    if highDecayCounter > 0
        highDecayCounter := highDecayCounter - 1
    else
        isHighPeriod := false

// Logic for Lows
if window_low < ta.lowest(low, window)[1]
    lowDecayCounter := decay
    isLowPeriod := true
else
    if lowDecayCounter > 0
        lowDecayCounter := lowDecayCounter - 1
    else
        isLowPeriod := false

// Strategy Execution
if inTradeWindow
    if isHighPeriod and highDecayCounter == decay
        strategy.entry("Long", strategy.long)

    if isHighPeriod and highDecayCounter == 0
        strategy.close("Long")

    if isLowPeriod and lowDecayCounter == decay and allowShort
        strategy.entry("Short", strategy.short)

    if isLowPeriod and lowDecayCounter == 0 and allowShort
        strategy.close("Short")

// Plotting
plot(window_high, color=color.green)
plot(window_low, color=color.red)Published by ChaoZhang on the FMZ strategy square · last modified 2024-02-23. Collected in the Quant Trading Vault. Unvalidated research: re-test with your own data and costs before trusting it.
Build this with AgenKit
A spec is not a trading system. Paste this into your coding agent and AgenKit runs a specialist team — architecture, test-first build, risk gates, review — with paper trading on by default.
/agenkit build a production-grade trading bot with a backtest engine, risk controls and paper trading by default from strategies/Reversal-Momentum-Breakout-Strategy.md- npx agenkit install engineering-kit in your project
- Paste the command into your agent and approve each phase
- Get tests, backtest, risk controls and a paper-trading switch
Understand it first
Before you run this, read the lesson behind the idea and how to backtest it honestly. Specs like this one are the survivors of an unknown number of trials; deflate their results accordingly.
Related specs
- 5 Day Moving Average Channel Breakout Strategy Combined With Mileage ConceptPine Script · Breakout · 1d
- ATR Trailing Stops StrategyPine Script · Breakout · 1h
- ATR Trend Breakout StrategyPine Script · Breakout · 1d
- Adaptive Bollinger Breakout with Moving Average Quantitative Strategy SystemPine Script · Breakout · 1h
- Adaptive Channel Breakout StrategyPine Script · Breakout · 1d
- Adaptive Multi Period Trading Strategy Based on Wave Trend Momentum BreakoutPine Script · Breakout · 2h