Strategy vault / Mean reversion
Reversal Trading Strategy with Bollinger Bands RSI ADX and ATR
This strategy integrates multiple technical indicators. It looks for high probability reversal trading opportunities when the Bollinger Bands indicator generates price reversal signals, combined with judgments on…
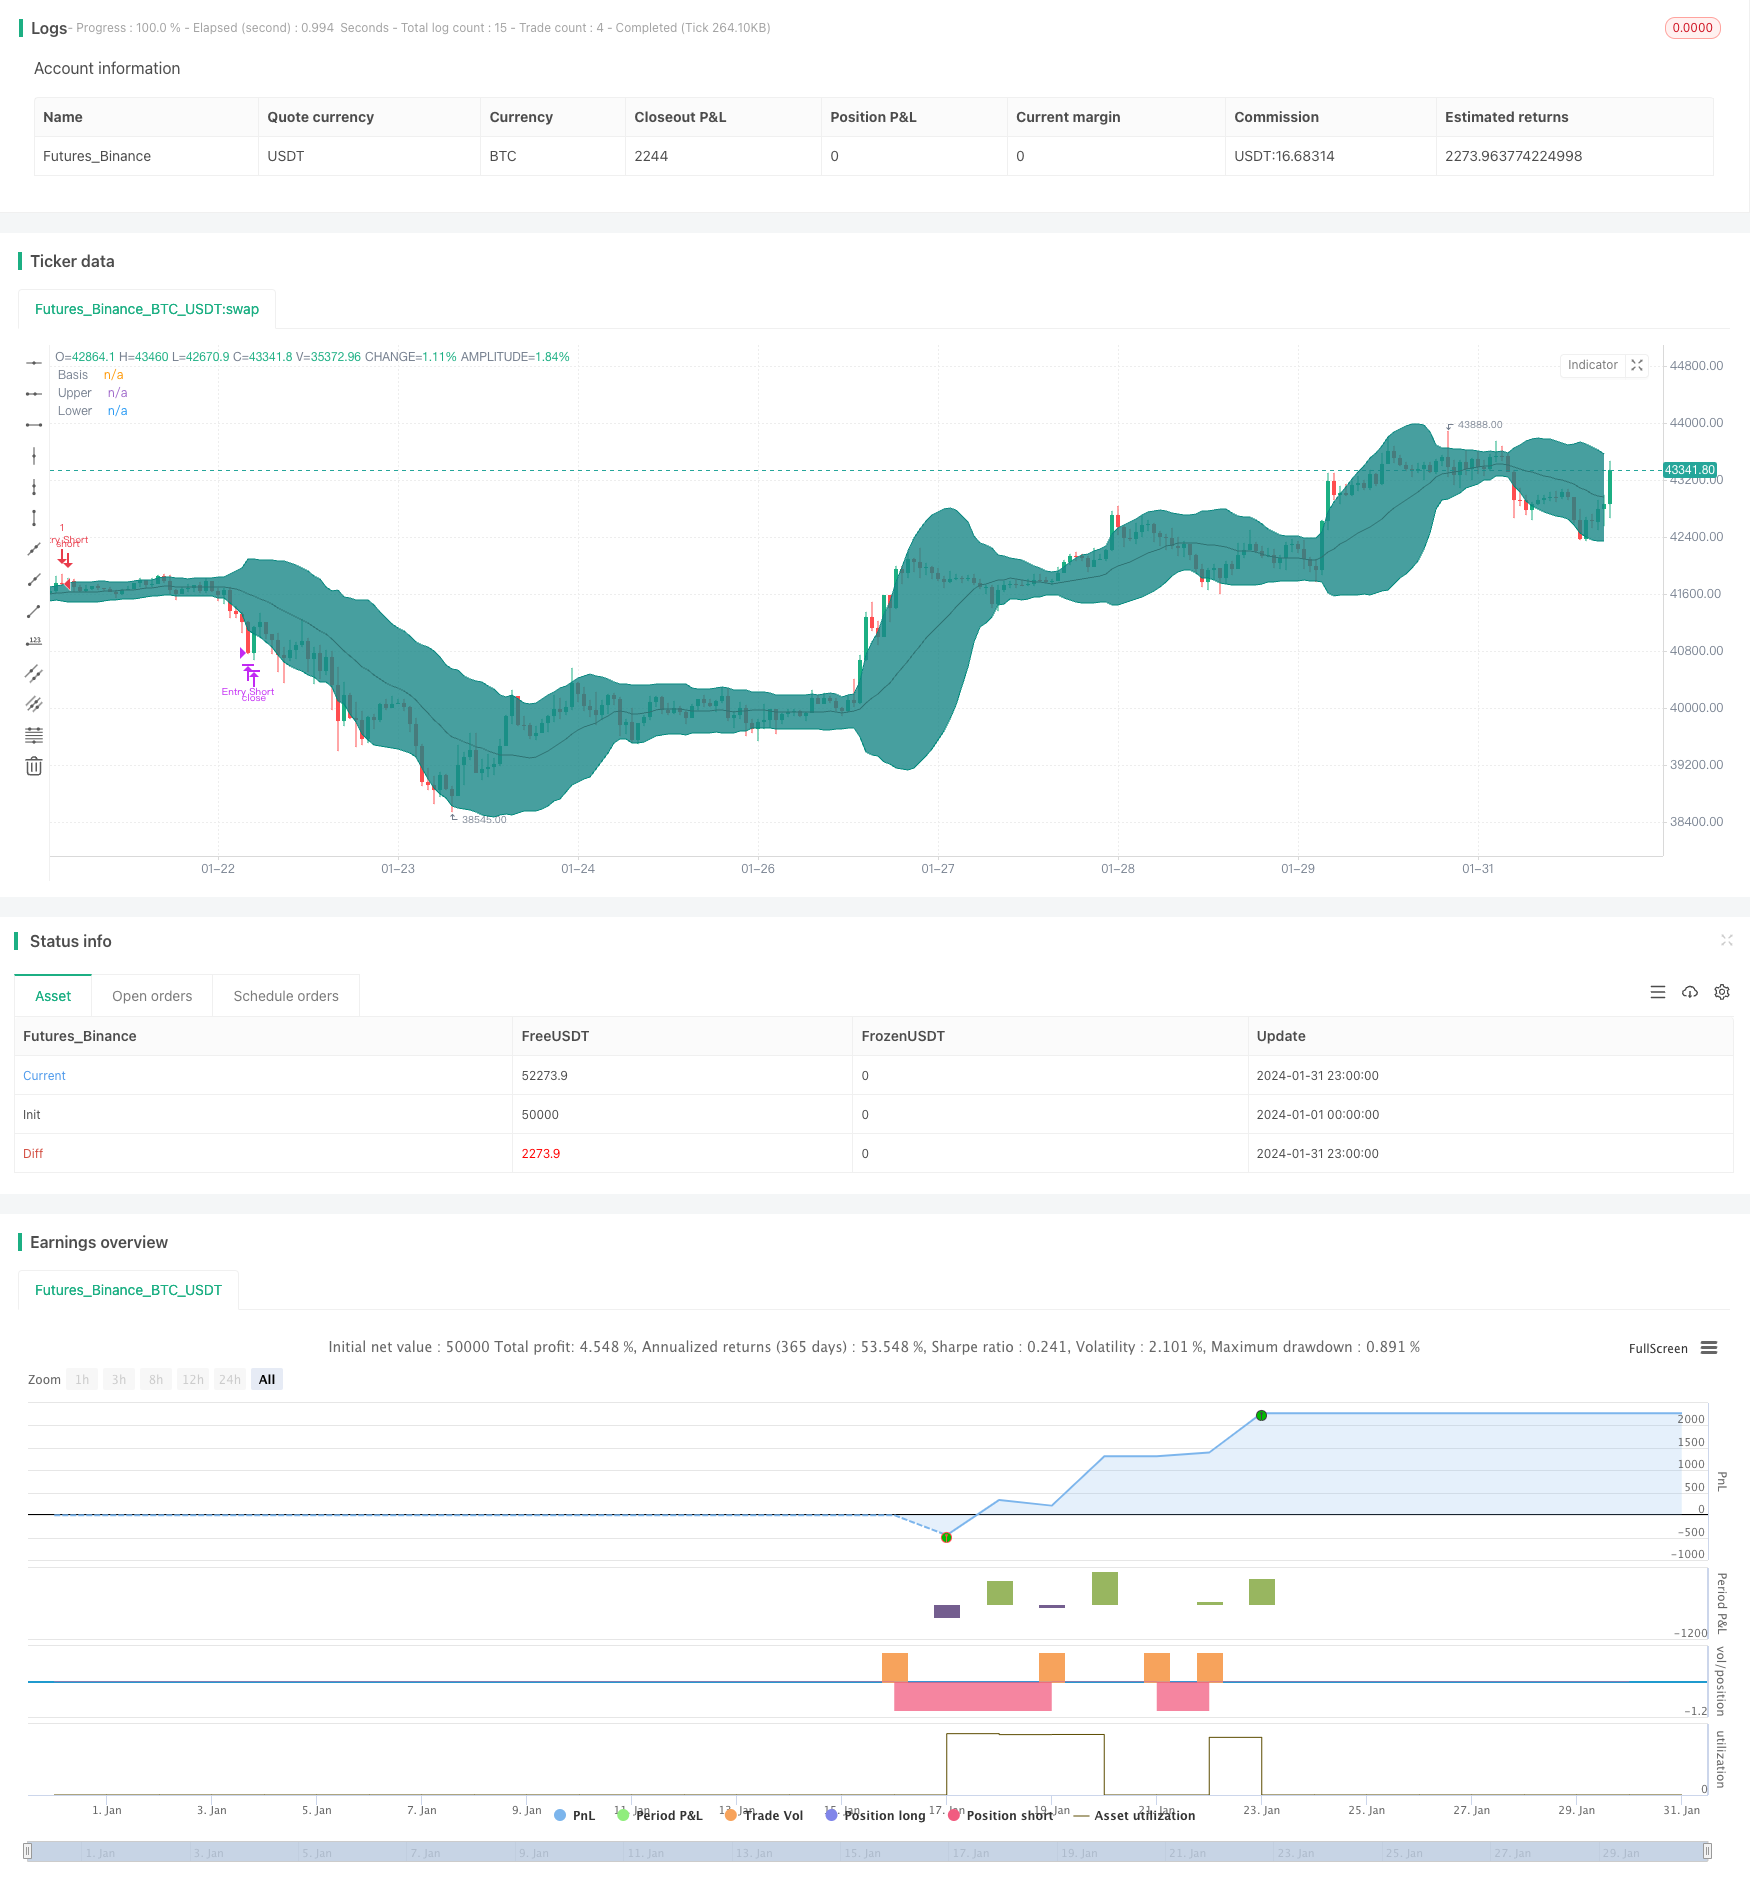
Overview
This strategy integrates multiple technical indicators. It looks for high probability reversal trading opportunities when the Bollinger Bands indicator generates price reversal signals, combined with judgments on market structure from RSI, ADX and ATR indicators.
Strategy Logic
Use 20-period Bollinger Bands and wait for reversal candlestick patterns when price reaches band highs or lows.
RSI indicator judges if the market is in ranging mode, with RSI above 60 indicating bullish range and below 40 bearish range.
ADX below 20 suggests ranging market, while above 20 suggests trending conditions.
ATR sets stop loss and trailing stop loss.
Additional filter from EMA lines.
Advantage Analysis
Multiple indicators combined provide high-probability trading signals.
Configurable parameters adapt to different market environments.
Strict stop loss rules effectively control risks.
Risk Analysis
Improper parameter settings may cause over-frequent trading.
Probability of reversal failure still exists.
Trailing stop loss may fail in certain markets.
Optimization Directions
Test more indicator combinations to find better parameter configurations.
Timely identify continuation reversal opportunities after initial failure.
Test different stop loss methods to make stops more intelligent.
Conclusion
This strategy uses Bollinger Bands for core trading signals, and multiple auxiliary indicators form a high-probability filtering system. The stop loss rules are also quite complete. Further performance improvement can be achieved through parameter tuning and indicator optimization. Overall, this strategy forms a reliable reversal trading system.
Parameters
| Name | Default | What it controls |
|---|---|---|
| v_input_1 | 200 | (?Indicators)EMA1 Input |
| v_input_2 | 100 | EMA2 Input |
| v_input_3 | 20 | (?Bollinger Band Indicator)BB Length |
| v_input_4_close | 0 | BB Source: close | high | low | open | hl2 | hlc3 | hlcc4 | ohlc4 |
| v_input_5 | 2 | BB Standard Deviation |
| v_input_6 | false | BB Offset |
| v_input_7 | 14 | (?RSI Indicator)RSI Length |
| v_input_8_close | 0 | RSI Source: close | high | low | open | hl2 | hlc3 | hlcc4 | ohlc4 |
| v_input_9 | 60 | RSI Maximum Value |
| v_input_10 | 40 | RSI Minimum Value |
| v_input_11 | 70 | RSI Max Exit Value |
| v_input_12 | 30 | RSI Min Exit Value |
| v_input_13 | 14 | (?ATR Indicator)ATR Length |
| v_input_14 | true | Use Trailing Stop? |
| v_input_15 | 7 | ATR Lookback Period |
| v_input_16 | true | ATR Multiplier |
| v_input_17 | 20 | (?ADX Indicator)ADX Max Value |
| v_input_18 | 14 | ADX Smoothing |
| v_input_19 | 14 | DI Length |
| v_input_20 | true | (?Backtest Date Range)From Month |
| v_input_21 | true | From Day |
| v_input_22 | 2000 | From Year |
| v_input_23 | true | Thru Month |
| v_input_24 | true | Thru Day |
| v_input_25 | 2099 | Thru Year |
Source Pine Script
/*backtest
start: 2024-01-01 00:00:00
end: 2024-01-31 23:59:59
period: 1h
basePeriod: 15m
exchanges: [{"eid":"Futures_Binance","currency":"BTC_USDT"}]
*/

//@version=4
strategy(shorttitle="BB + EMA + RSI + ADX + ATR Reversal", title="Bollinger Bands Reversal", overlay=true)

// Inputs
ema1Input       = input(title = "EMA1 Input",                          defval = 200,   minval = 10,    maxval = 400,   step = 10,                      group = "Indicators")
ema2Input       = input(title = "EMA2 Input",                          defval = 100,   minval = 10,    maxval = 400,   step = 10,                      group = "Indicators")
length          = input(title = "BB Length",                           defval = 20,    minval=1,                                                       group = "Bollinger Band Indicator")
bbsrc           = input(title = "BB Source",                            defval = close,                                                                 group = "Bollinger Band Indicator")
mult            = input(title = "BB Standard Deviation",            type = input.float,     defval = 2.0,   minval=0.001,   maxval=50,                                      group = "Bollinger Band Indicator")
offset          = input(title = "BB Offset",                           defval = 0,     minval = -500,  maxval = 500,                                   group = "Bollinger Band Indicator")
rsilen          = input(title = "RSI Length",                          defval = 14,    minval=1,                                                       group = "RSI Indicator")
rsisrc          = input(title = "RSI Source",                           defval = close,                                                                 group = "RSI Indicator")
rsiMaxEntry     = input(title = "RSI Maximum Value",                   defval = 60,    minval = 50,    maxval = 100,                                   group = "RSI Indicator")
rsiMinEntry     = input(title = "RSI Minimum Value",                   defval = 40,    minval = 0,     maxval = 50,                                    group = "RSI Indicator")
rsiMaxExit      = input(title = "RSI Max Exit Value",                  defval = 70,    minval = 50,    maxval = 100,                                   group = "RSI Indicator")
rsiMinExit      = input(title = "RSI Min Exit Value",                  defval = 30,    minval = 0,     maxval = 50,                                    group = "RSI Indicator")
atrLength       = input(title = "ATR Length",                          defval = 14,    minval = 1,                                                     group = "ATR Indicator")
useStructure    = input(title = "Use Trailing Stop?",               type = input.bool,      defval = true,                                                                  group = "ATR Indicator")
atrlookback     = input(title = "ATR Lookback Period",                 defval = 7,     minval = 1,                                                     group = "ATR Indicator")
atrMultiplier   = input(title = "ATR Multiplier",                   type = input.float,     defval = 1.0,   minval = 0.1,                                                   group = "ATR Indicator")
sigMaxValue     = input(title = "ADX Max Value",                    type = input.float,     defval = 20.0,  minval = 0,     maxval = 100,   step = 0.1,                     group = "ADX Indicator")
adxlen          = input(title = "ADX Smoothing",                       defval = 14,                                                                    group = "ADX Indicator")
dilen           = input(title = "DI Length",                           defval = 14,                                                                    group = "ADX Indicator")

// Date input
fromMonth       = input(defval = 1,    title = "From Month",           minval = 1,     maxval = 12,    group = "Backtest Date Range")
fromDay         = input(defval = 1,    title = "From Day",             minval = 1,     maxval = 31,    group = "Backtest Date Range")
fromYear        = input(defval = 2000, title = "From Year",            minval = 1970,                  group = "Backtest Date Range")
thruMonth       = input(defval = 1,    title = "Thru Month",           minval = 1,     maxval = 12,    group = "Backtest Date Range")
thruDay         = input(defval = 1,    title = "Thru Day",             minval = 1,     maxval = 31,    group = "Backtest Date Range")
thruYear        = input(defval = 2099, title = "Thru Year",            minval = 1970,                  group = "Backtest Date Range")
inDataRange     = true

// Built in Bollinger Band
basis           = sma(bbsrc, length)
dev             = mult * stdev(bbsrc, length)
upper           = basis + dev
lower           = basis - dev
// Built in RSI
up              = rma(max(change(rsisrc), 0), rsilen)
down            = rma(-min(change(rsisrc), 0), rsilen)
rsi             = down == 0 ? 100 : up == 0 ? 0 : 100 - (100 / (1 + up / down))
// Built in ADX
dirmov(len) =>
	up = change(high)
	down = -change(low)
	plusDM = na(up) ? na : (up > down and up > 0 ? up : 0)
	minusDM = na(down) ? na : (down > up and down > 0 ? down : 0)
	truerange = rma(tr, len)
	plus = fixnan(100 * rma(plusDM, len) / truerange)
	minus = fixnan(100 * rma(minusDM, len) / truerange)
	[plus, minus]
adx(dilen, adxlen) =>
	[plus, minus] = dirmov(dilen)
	sum = plus + minus
	adx = 100 * rma(abs(plus - minus) / (sum == 0 ? 1 : sum), adxlen)
sig = adx(dilen, adxlen)

// Custom variables
ema1 = ema(close, ema1Input)
ema2 = ema(close, ema2Input)
atr = atr(atrLength)

// Entry and exit signals
CrossLongEntry  = (close <= lower or close[1] <= lower[1]) and close > open and close[1] < open[1] and close > ema1 and close > ema2 and strategy.position_size == 0 and inDataRange and rsi > rsiMinEntry and rsi < rsiMaxEntry and sig < sigMaxValue
CrossShortEntry = (close >= upper or close[1] >= upper[1]) and close < open and close[1] > open[1] and close < ema1 and close < ema2 and strategy.position_size == 0 and inDataRange and rsi > rsiMinEntry and rsi < rsiMaxEntry and sig < sigMaxValue

CrossLongExit   = (close >= upper or close[1] >= upper[1]) and close < open and close[1] > open[1] and strategy.position_size > 0 and inDataRange or rsi < rsiMinExit or rsi > rsiMaxExit
CrossShortExit  = (close <= lower or close[1] <= lower[1]) and close > open and close[1] < open[1] and strategy.position_size < 0 and inDataRange or rsi < rsiMinExit or rsi > rsiMaxExit

// Determining the stop loss based on ATR
StopLossLong    = (useStructure ? lowest(low, atrlookback) : close) - atr * atrMultiplier
StopLossShort   = (useStructure ? highest(high, atrlookback) : close) + atr * atrMultiplier

// Custom variables used to store the stoploss value
var StopLong    = 0.0
var StopShort   = 0.0
// Telling my script to store the stoploss value in the corresponding variables
if CrossLongEntry
    StopLong := StopLossLong
if CrossShortEntry
    StopShort := StopLossShort

// Strategy
strategy.entry("Entry Long", strategy.long, when = CrossLongEntry, comment = "Entry Long")
strategy.close("Entry Long", when = CrossLongExit or close < StopLong, comment = "Long Exit")

strategy.entry("Entry Short", strategy.short, when = CrossShortEntry, comment = "Entry Short")
strategy.close("Entry Short", when = CrossShortExit or close > StopShort, comment = "Short Exit")

// Plots the Bollinger Band
plot(basis, "Basis", color=#872323, offset = offset)
p1 = plot(upper, "Upper", color=color.teal, offset = offset)
p2 = plot(lower, "Lower", color=color.teal, offset = offset)
fill(p1, p2, title = "Background", color=#198787, transp=95)

// Use this if you want to see the stoploss visualised, be aware though plotting these can be confusing
// plot(StopLong)
// plot(StopShort)Published by ChaoZhang on the FMZ strategy square · last modified 2024-02-21. Collected in the Quant Trading Vault. Unvalidated research: re-test with your own data and costs before trusting it.
Build this with AgenKit
A spec is not a trading system. Paste this into your coding agent and AgenKit runs a specialist team — architecture, test-first build, risk gates, review — with paper trading on by default.
/agenkit build a production-grade trading bot with a backtest engine, risk controls and paper trading by default from strategies/Reversal-Trading-Strategy-with-Bollinger-Bands-RSI-ADX-and-ATR.md- npx agenkit install engineering-kit in your project
- Paste the command into your agent and approve each phase
- Get tests, backtest, risk controls and a paper-trading switch
Understand it first
Before you run this, read the lesson behind the idea and how to backtest it honestly. Specs like this one are the survivors of an unknown number of trials; deflate their results accordingly.
Related specs
- Multi Indicator Trend Reversal Volatility Conditional Selective Options Selling StrategyPine Script · Mean reversion · 1h
- Advanced Momentum EMA Trend Following with RSI Overbought Oversold Trading StrategyPine Script · Mean reversion · 1d
- Multi Indicator Reversal Point Capture Trading StrategyPine Script · Mean reversion · 1d
- CCTBBO Reversal Tracking StrategyPine Script · Mean reversion · 45m
- Bollinger Bands Trend Reversal StrategyPine Script · Mean reversion · 10m
- MACD RSI and EMA StrategyPine Script · Mean reversion · 1d