Rose Cross Star Dual Indicator Volatility Strategy
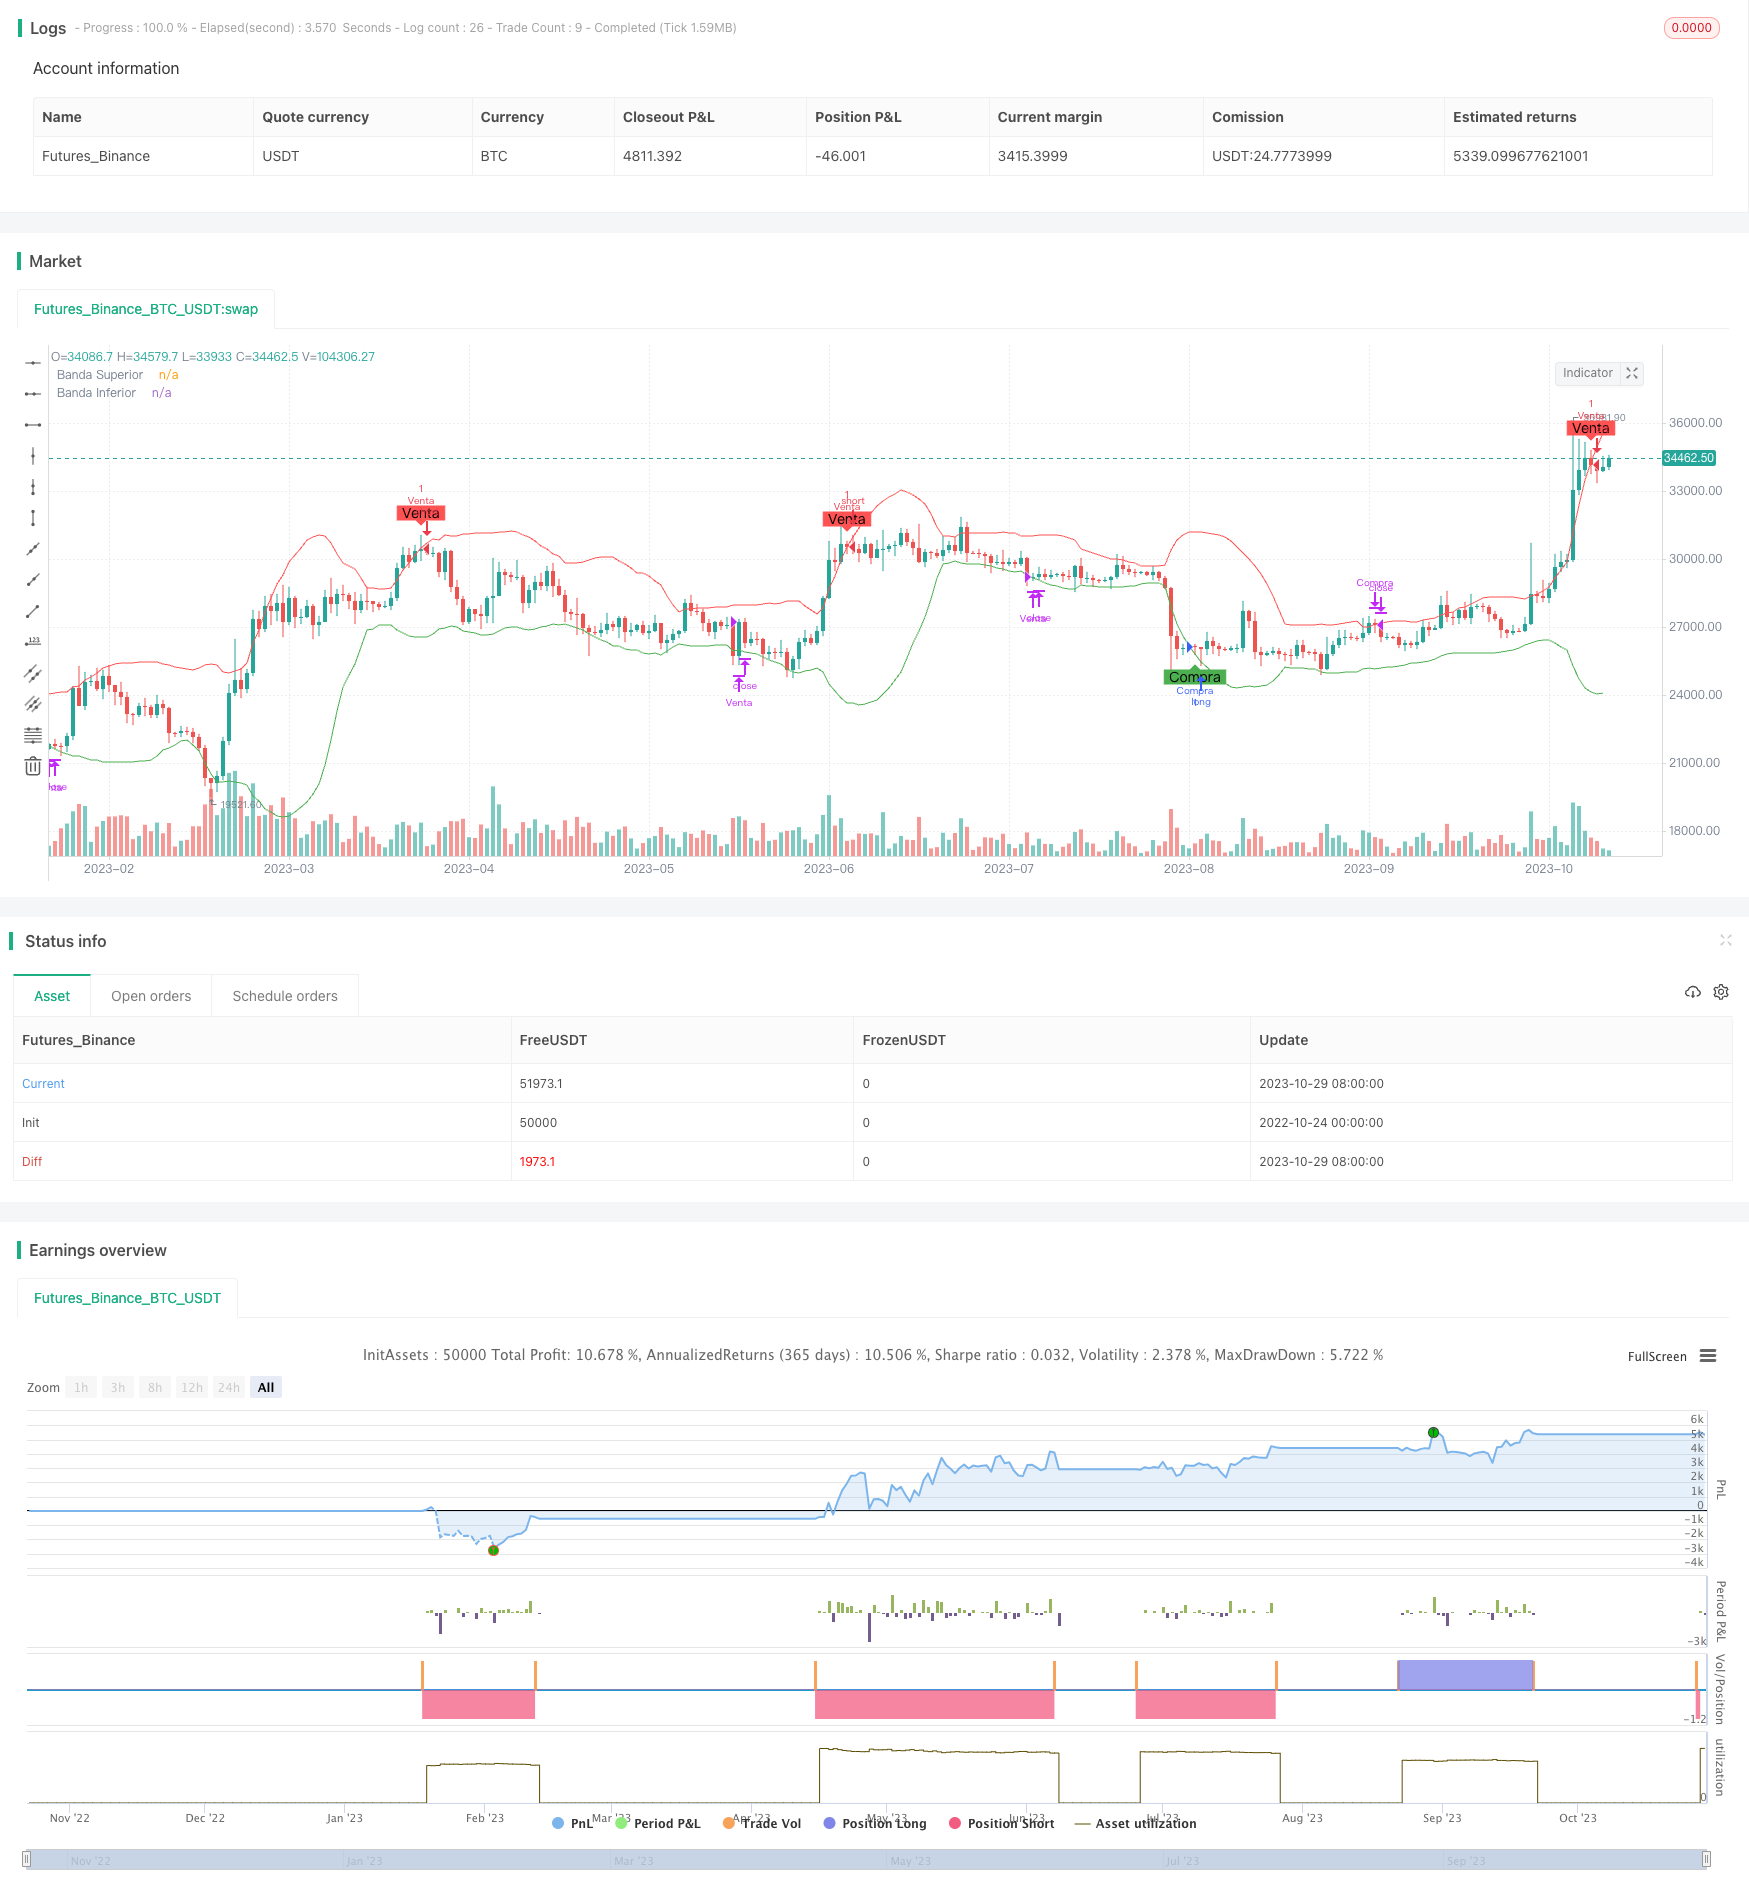
This strategy identifies trading opportunities through combining Bollinger Bands and a modified Relative Strength Index (RSI). Backtest results demonstrate its overall profitability and high winning rate. It captures…
Overview
This strategy identifies trading opportunities through combining Bollinger Bands and a modified Relative Strength Index (RSI). Backtest results demonstrate its overall profitability and high winning rate. It captures breakout signals in trending markets and suits short-term to medium-term trading.
Strategy Logic
Indicator Selection
The strategy utilizes Bollinger Bands with a standard deviation multiplier of 2 and RSI with a period of 14. Bollinger Bands detect breakouts and RSI determines overbought/oversold levels. Indicator parameters are set based on experience and iterative testing.
Entry Rules
Go long when price breaks above the lower Bollinger Band and RSI is below 30 (oversold zone).
Go short when price breaks below the upper Bollinger Band and RSI is above 70 (overbought zone).
Exit Rules
Close long positions on a stop loss or when price breaks below the upper Bollinger Band.
Close short positions on a stop loss or when price breaks above the lower Bollinger Band.
Advantages
Dual indicator combination improves strategy precision.
Optimized indicator parameters provide robust adaptability.
Breakout signals are clear and easy to implement.
Effective drawdown and loss control.
Visual signals simplify trade execution.
Risks
Band squeeze may cause false breakouts. Consider longer Bollinger periods.
Frequent trading possible in range-bound markets. Lower RSI sensitivity.
Manage transaction costs. Widen stop distances.
Enhancements
Test EMA and other indicators to generate bands.
Add volume or MA filters to avoid false breaks.
Set band and stop distances based on ATR.
Add trend filter to reduce whipsaws.
Conclusion
This strategy combines the strengths of Bollinger Bands and RSI for trend and breakout trading. Simple to implement, it is well-suited for short to medium-term breakouts. Extensions through indicator and parameter optimization can further expand its robustness.
Parameters
| Name | Default | What it controls |
|---|---|---|
| v_input_1 | 20 | Longitud |
| v_input_2 | 2 | mult |
Source Pine Script
/*backtest
start: 2022-10-24 00:00:00
end: 2023-10-30 00:00:00
period: 1d
basePeriod: 1h
exchanges: [{"eid":"Futures_Binance","currency":"BTC_USDT"}]
*/

//@version=4
strategy("Estrategia de Ruptura con Bollinger y RSI Modificada", shorttitle="BB RSI Mod", overlay=true)

// Parámetros de Bollinger Bands
src = close
length = input(20, title="Longitud", minval=1)
mult = input(2.0)
basis = sma(src, length)
upper = basis + mult * stdev(src, length)
lower = basis - mult * stdev(src, length)

// Parámetros del RSI
rsiSource = rsi(close, 14)
overbought = 70
oversold = 30

longCondition = crossover(src, lower) and rsiSource < oversold
shortCondition = crossunder(src, upper) and rsiSource > overbought

longExit = crossunder(src, upper)
shortExit = crossover(src, lower)

if (longCondition)
    strategy.entry("Compra", strategy.long, stop=low)

if (shortCondition)
    strategy.entry("Venta", strategy.short, stop=high)

if (longExit)
    strategy.close("Compra")

if (shortExit)
    strategy.close("Venta")

// Visualización
plotshape(series=longCondition, title="Compra", location=location.belowbar, color=color.green, style=shape.labelup, text="Compra")
plotshape(series=shortCondition, title="Venta", location=location.abovebar, color=color.red, style=shape.labeldown, text="Venta")
plot(upper, "Banda Superior", color=color.red)
plot(lower, "Banda Inferior", color=color.green)
Published by ChaoZhang on the FMZ strategy square · last modified 2023-10-31. Collected in the Quant Trading Vault. Unvalidated research: re-test with your own data and costs before trusting it.
Build this with AgenKit
A spec is not a trading system. Paste this into your coding agent and AgenKit runs a specialist team — architecture, test-first build, risk gates, review — with paper trading on by default.
/agenkit build a production-grade trading bot with a backtest engine, risk controls and paper trading by default from strategies/Rose-Cross-Star-Dual-Indicator-Volatility-Strategy.md- npx agenkit install engineering-kit in your project
- Paste the command into your agent and approve each phase
- Get tests, backtest, risk controls and a paper-trading switch
Understand it first
Before you run this, read the lesson behind the idea and how to backtest it honestly. Specs like this one are the survivors of an unknown number of trials; deflate their results accordingly.
Related specs
- Big Snapper Alerts R30 Chaiking Volatility condition TP RSIPine Script · Volatility · 2h
- Multi Indicator Volatility Trading RSI EMA ATR StrategyPine Script · Volatility · 3m
- Volatility Capture RSI Bollinger Band StrategyPine Script · Volatility · 15m
- Multi Indicator Dynamic Position Size Volatility Adaptive Quantitative Trading StrategyPine Script · Volatility · 1d
- Profit rate theory volatility index quantification strategyPine Script · Volatility · 3h
- Multi Layer Volatility Band Trading StrategyPine Script · Volatility · 2h