Strategy vault / Mean reversion
RSI and EMA Dual Filter Strategy
The RSI and EMA Dual Filter Strategy is a quantitative trading strategy based on the Relative Strength Index (RSI) and Exponential Moving Average (EMA). The strategy uses the RSI indicator to determine overbought and…
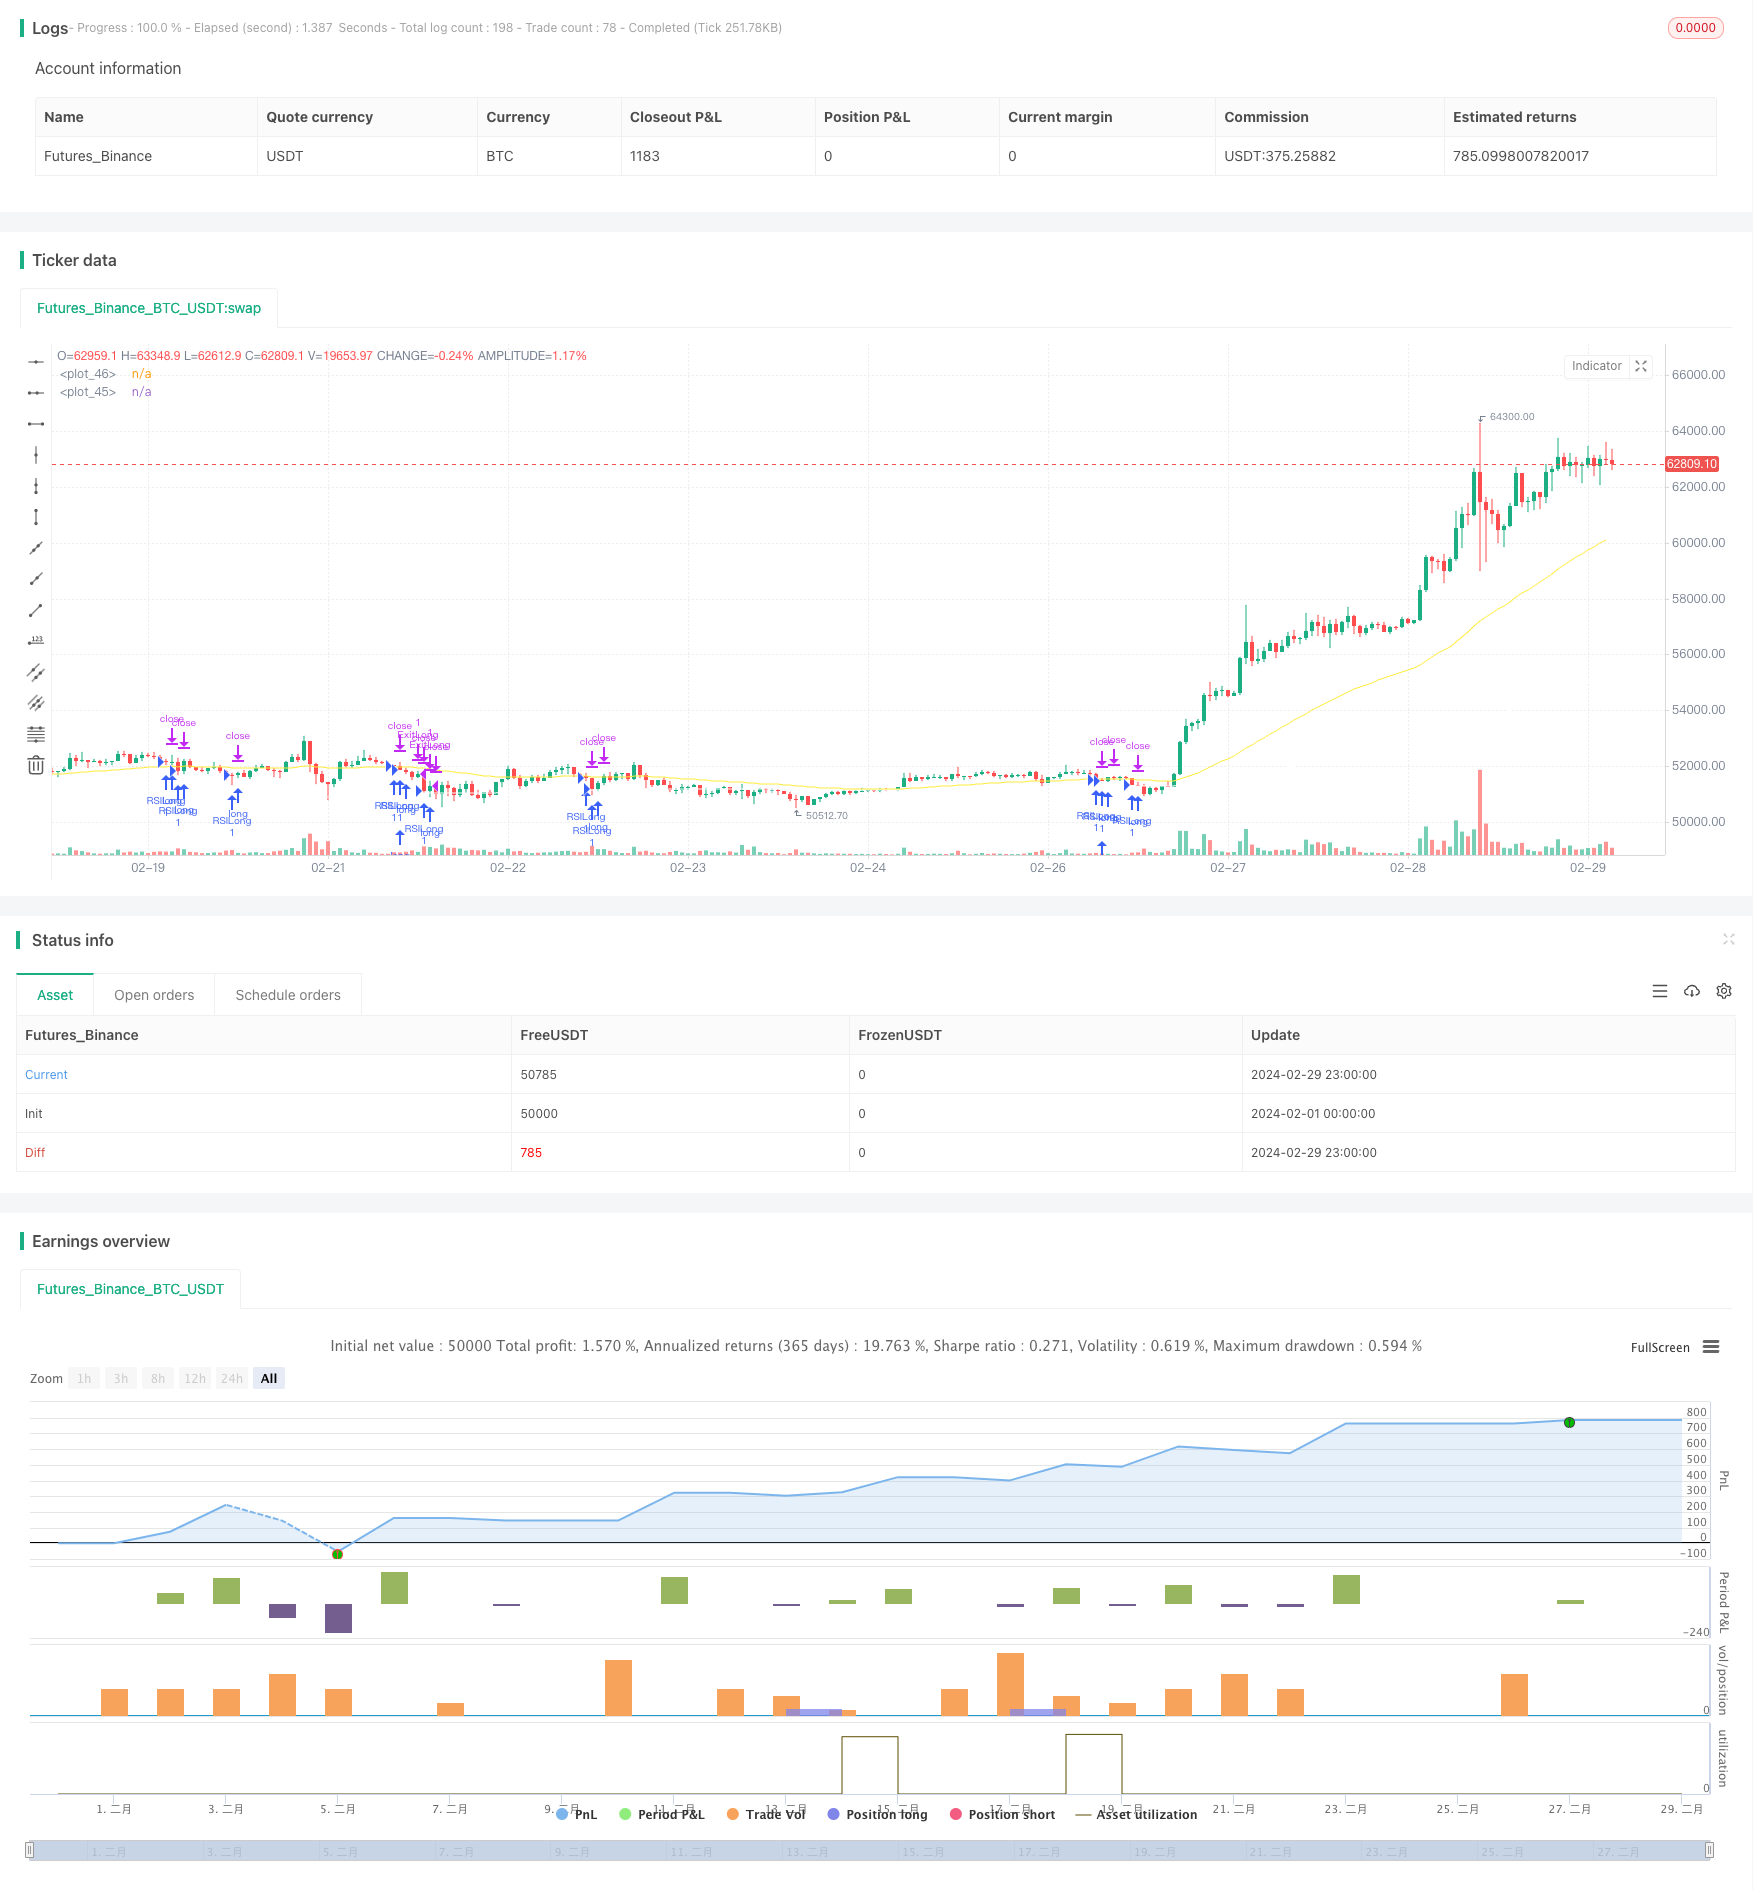
Overview
The RSI and EMA Dual Filter Strategy is a quantitative trading strategy based on the Relative Strength Index (RSI) and Exponential Moving Average (EMA). The strategy uses the RSI indicator to determine overbought and oversold conditions in the market, while also incorporating the trend judgment of two EMA lines, fast and slow, as the basis for entry and exit. Through the dual filtering of RSI and EMA, the strategy can effectively reduce false signals and improve stability and profitability.
Strategy Principle
The core principles of this strategy can be divided into the following parts:
Calculation and application of the RSI indicator: The strategy first calculates an RSI indicator with a custom period (default is 2). When the RSI value is below the oversold threshold (default is 10), it indicates that the market is oversold, and a long position can be considered. When the RSI value is above the overbought threshold (default is 90), it indicates that the market is overbought, and a short position can be considered.
Trend judgment of fast and slow EMA lines: The strategy calculates two EMA lines, a slow line (default period is 200) and a fast line (default period is 50). When the fast line is above the slow line and the price is above the slow line, the market is considered to be in an uptrend. Conversely, when the fast line is below the slow line and the price is below the slow line, the market is considered to be in a downtrend.
Trend filter: The strategy provides an option for trend filtering. If this option is enabled, a long position will only be opened when the RSI is oversold in an uptrend, and a short position will only be opened when the RSI is overbought in a downtrend. This can further reduce the risk of counter-trend trading.
Confirmation of trading signals: The strategy comprehensively considers the results of the RSI indicator and EMA trend judgment to generate final trading signals. In an uptrend, when the RSI is below the oversold threshold, a long position is opened. In a downtrend, when the RSI is above the overbought threshold, a short position is opened.
Position management: The strategy uses a minimum trading interval (default is 5 minutes) to control the trading frequency and avoid excessive trading. At the same time, the strategy uses a combination of trailing stop loss and fixed stop loss for risk management, which allows profits to extend fully while effectively controlling losses.
Advantage Analysis
The RSI and EMA Dual Filter Strategy has the following advantages:
Strong trend-tracking ability: Through the trend judgment of fast and slow EMA lines, the strategy can effectively grasp the main trend of the market and avoid frequent trading in a range-bound market.
Effective filtering of false signals: The RSI indicator tends to generate many false signals, especially in markets with unclear trends. However, EMA trend filtering can effectively identify the main trend and reduce false signals generated by RSI.
Comprehensive risk management: The strategy uses a combination of trailing stop loss and fixed stop loss, which allows profits to extend fully while effectively controlling losses. This risk management approach can improve the stability and drawdown control ability of the strategy.
Flexible and adjustable parameters: The strategy provides multiple parameters for users to adjust, such as RSI period, overbought/oversold thresholds, EMA period, stop loss ratio, etc. This makes the strategy adaptable to different market environments and trading habits.
Risk Analysis
Despite the advantages of the RSI and EMA Dual Filter Strategy, there are still some potential risks:
Trend reversal risk: When the market trend reverses, EMA lines may lag, causing the strategy to miss the best entry point or delay the exit.
Parameter optimization risk: The performance of this strategy is sensitive to parameter settings, and different parameter combinations may bring completely different results. If the parameters are over-optimized, the strategy may perform poorly in future markets.
Black swan event risk: The strategy is based on historical data for backtesting and optimization, but historical data cannot fully reflect extreme events that may occur in the future. Once a black swan event occurs, the strategy may suffer significant losses.
To address these risks, the following solutions can be considered:
Combine other technical indicators or price behavior patterns to assist in judging trend reversals and make adjustments early.
Adopt moderate parameter optimization to avoid over-fitting historical data. At the same time, regularly review and adjust parameters to adapt to the latest market characteristics.
Set reasonable stop loss levels to control the maximum loss of a single trade. Additionally, implement risk control at the portfolio level, such as diversification and position sizing.
Optimization Direction
Introduce more technical indicators: In addition to the existing RSI and EMA indicators, more effective technical indicators can be introduced, such as MACD, Bollinger Bands, etc., to improve the signal accuracy and stability of the strategy.
Optimize trend judgment methods: In addition to using EMA lines to judge trends, other trend judgment methods can be explored, such as higher highs and higher lows, moving average systems, etc. By combining multiple trend judgment methods, the adaptability of the strategy can be improved.
Improve risk management methods: Based on the existing trailing stop loss and fixed stop loss, more advanced risk management methods can be introduced, such as volatility stop loss, dynamic stop loss, etc. These methods can better adapt to changes in market volatility and thus better control risks.
Add position management module: Currently, the strategy adopts a fixed position size approach. A dynamic position management module can be considered to dynamically adjust positions based on factors such as market volatility and account equity, thus improving capital utilization efficiency.
Adapt to multiple markets and varieties: Expand the strategy to more trading markets and varieties, and reduce overall risk through diversification. At the same time, study the correlation between different markets and varieties, and use this information to optimize the asset allocation of the strategy.
Summary
The RSI and EMA Dual Filter Strategy effectively captures market trends while reducing the problem of false signals easily generated by the RSI indicator through the organic combination of the Relative Strength Index and Exponential Moving Average. The strategy logic is clear and includes comprehensive risk management measures, with good stability and profit potential. However, the strategy also has some potential risks, such as trend reversal risk, parameter optimization risk, and black swan event risk. To address these risks, we have proposed corresponding countermeasures and optimization directions, such as introducing more technical indicators, optimizing trend judgment methods, improving risk management methods, adding position management modules, and expanding to multiple markets and varieties. Through continuous optimization and improvement, we believe that the strategy can better adapt to future market changes and bring stable returns for investors.
Parameters
| Name | Default | What it controls |
|---|---|---|
| v_input_1 | 2 | RSILength |
| v_input_2 | 90 | Threshold RSI up |
| v_input_3 | 10 | Threshold RSI down |
| v_input_4 | 200 | Slow MA len |
| v_input_5 | 50 | Fast MA len |
| v_input_6 | 0 | machoice: EMA | SMA |
| v_input_7 | 0.5 | Ticker size |
| v_input_8 | true | Trend Filter |
| v_input_9 | true | TrailingStop% |
| v_input_10 | 0.3 | Stop Loss % |
Source Pine Script
/*backtest
start: 2024-02-01 00:00:00
end: 2024-02-29 23:59:59
period: 1h
basePeriod: 15m
exchanges: [{"eid":"Futures_Binance","currency":"BTC_USDT"}]
*/

//@version=4
strategy("RSI2", overlay=true)

// RSILength input
len = input(2, minval=1, title="RSILength")

// Threshold RSI up input
RSIthreshUP = input(90, title="Threshold RSI up")

// Threshold RSI down input
RSIthreshDWN = input(10, title="Threshold RSI down")

// Slow MA length input
mmlen = input(200, title="Slow MA len")

// Fast MA length input
mmflen = input(50, title="Fast MA len")

// Moving Average type input
machoice = input("EMA", defval="EMA", options=["SMA", "EMA"])

// Ticker size input
tick=input(0.5,title="Ticker size",type=input.float)

// Trend Filter input
filter=input(true,title="Trend Filter",type=input.bool)

// Trailing Stop percentage input
ts_percent = input(1, title="TrailingStop%")

// Stop Loss percentage input
sl_percent = input(0.3, title="Stop Loss %")

// Calculate RSI
src = close
up = rma(max(change(src), 0), len)
down = rma(-min(change(src), 0), len)
rsi = down == 0 ? 100 : up == 0 ? 0 : 100 - 100 / (1 + up / down)

// Calculate moving averages
mmslow = machoice == "SMA" ? sma(close, mmlen) : ema(close, mmlen)
mmfast = machoice == "SMA" ? sma(close, mmflen) : ema(close, mmflen)

// Plot moving averages
plot(mmslow, color=color.white)
plot(mmfast, color=color.yellow)

// Conditions for entry and exit
var lastLongEntryTime = 0
var lastShortEntryTime = 0

ConditionEntryL = if filter == true
    mmfast > mmslow and close > mmslow and rsi < RSIthreshDWN
else
    mmfast > mmslow and rsi < RSIthreshDWN

ConditionEntryS = if filter == true
    mmfast < mmslow and close < mmslow and rsi > RSIthreshUP
else
    mmfast < mmslow and rsi > RSIthreshUP

// Calculate trailing stop and stop loss
ts_calc = close * (1/tick) * ts_percent * 0.01
sl_price = close * (1 - sl_percent / 100)

// Entry and exit management
if ConditionEntryL and time - lastLongEntryTime > 1000 * 60 * 5 // 5 minutes
    strategy.entry("RSILong", strategy.long)
    lastLongEntryTime := time

if ConditionEntryS and time - lastShortEntryTime > 1000 * 60 * 5 // 5 minutes
    strategy.entry("RSIShort", strategy.short)
    lastShortEntryTime := time

lastLongEntryTimeExpired = time - lastLongEntryTime >= 1000 * 60 * 5
lastShortEntryTimeExpired = time - lastShortEntryTime >= 1000 * 60 * 5

strategy.exit("ExitLong", "RSILong", when=lastLongEntryTimeExpired, trail_points=0, trail_offset=ts_calc, stop=sl_price)
strategy.exit("ExitShort", "RSIShort", when=lastShortEntryTimeExpired, trail_points=0, trail_offset=ts_calc, stop=sl_price)Published by ChaoZhang on the FMZ strategy square · last modified 2024-03-22. Collected in the Quant Trading Vault. Unvalidated research: re-test with your own data and costs before trusting it.
Build this with AgenKit
A spec is not a trading system. Paste this into your coding agent and AgenKit runs a specialist team — architecture, test-first build, risk gates, review — with paper trading on by default.
/agenkit build a production-grade trading bot with a backtest engine, risk controls and paper trading by default from strategies/RSI-and-EMA-Dual-Filter-Strategy.md- npx agenkit install engineering-kit in your project
- Paste the command into your agent and approve each phase
- Get tests, backtest, risk controls and a paper-trading switch
Understand it first
Before you run this, read the lesson behind the idea and how to backtest it honestly. Specs like this one are the survivors of an unknown number of trials; deflate their results accordingly.
Related specs
- Advanced 15 Minute Chart Trading Signal StrategyPine Script · Mean reversion · 3h
- Advanced Momentum EMA Trend Following with RSI Overbought Oversold Trading StrategyPine Script · Mean reversion · 1d
- Advanced Quantitative Trading Strategy Combining RSI Divergence and Moving AveragesPine Script · Mean reversion · 1h
- BONK Multi Factor Trading StrategyPine Script · Mean reversion · 1d
- Customizable Non Repainting HTF MACD MFI Scalable Bot StrategyPine Script · Mean reversion · 1d
- Dual Moving Average Crossover with RSI Overbought Oversold Pyramid Dynamic Trend Trading StrategyPine Script · Mean reversion · 2h