Strategy vault / Machine learning
RSI and Fibonacci Retracement Trading Strategy
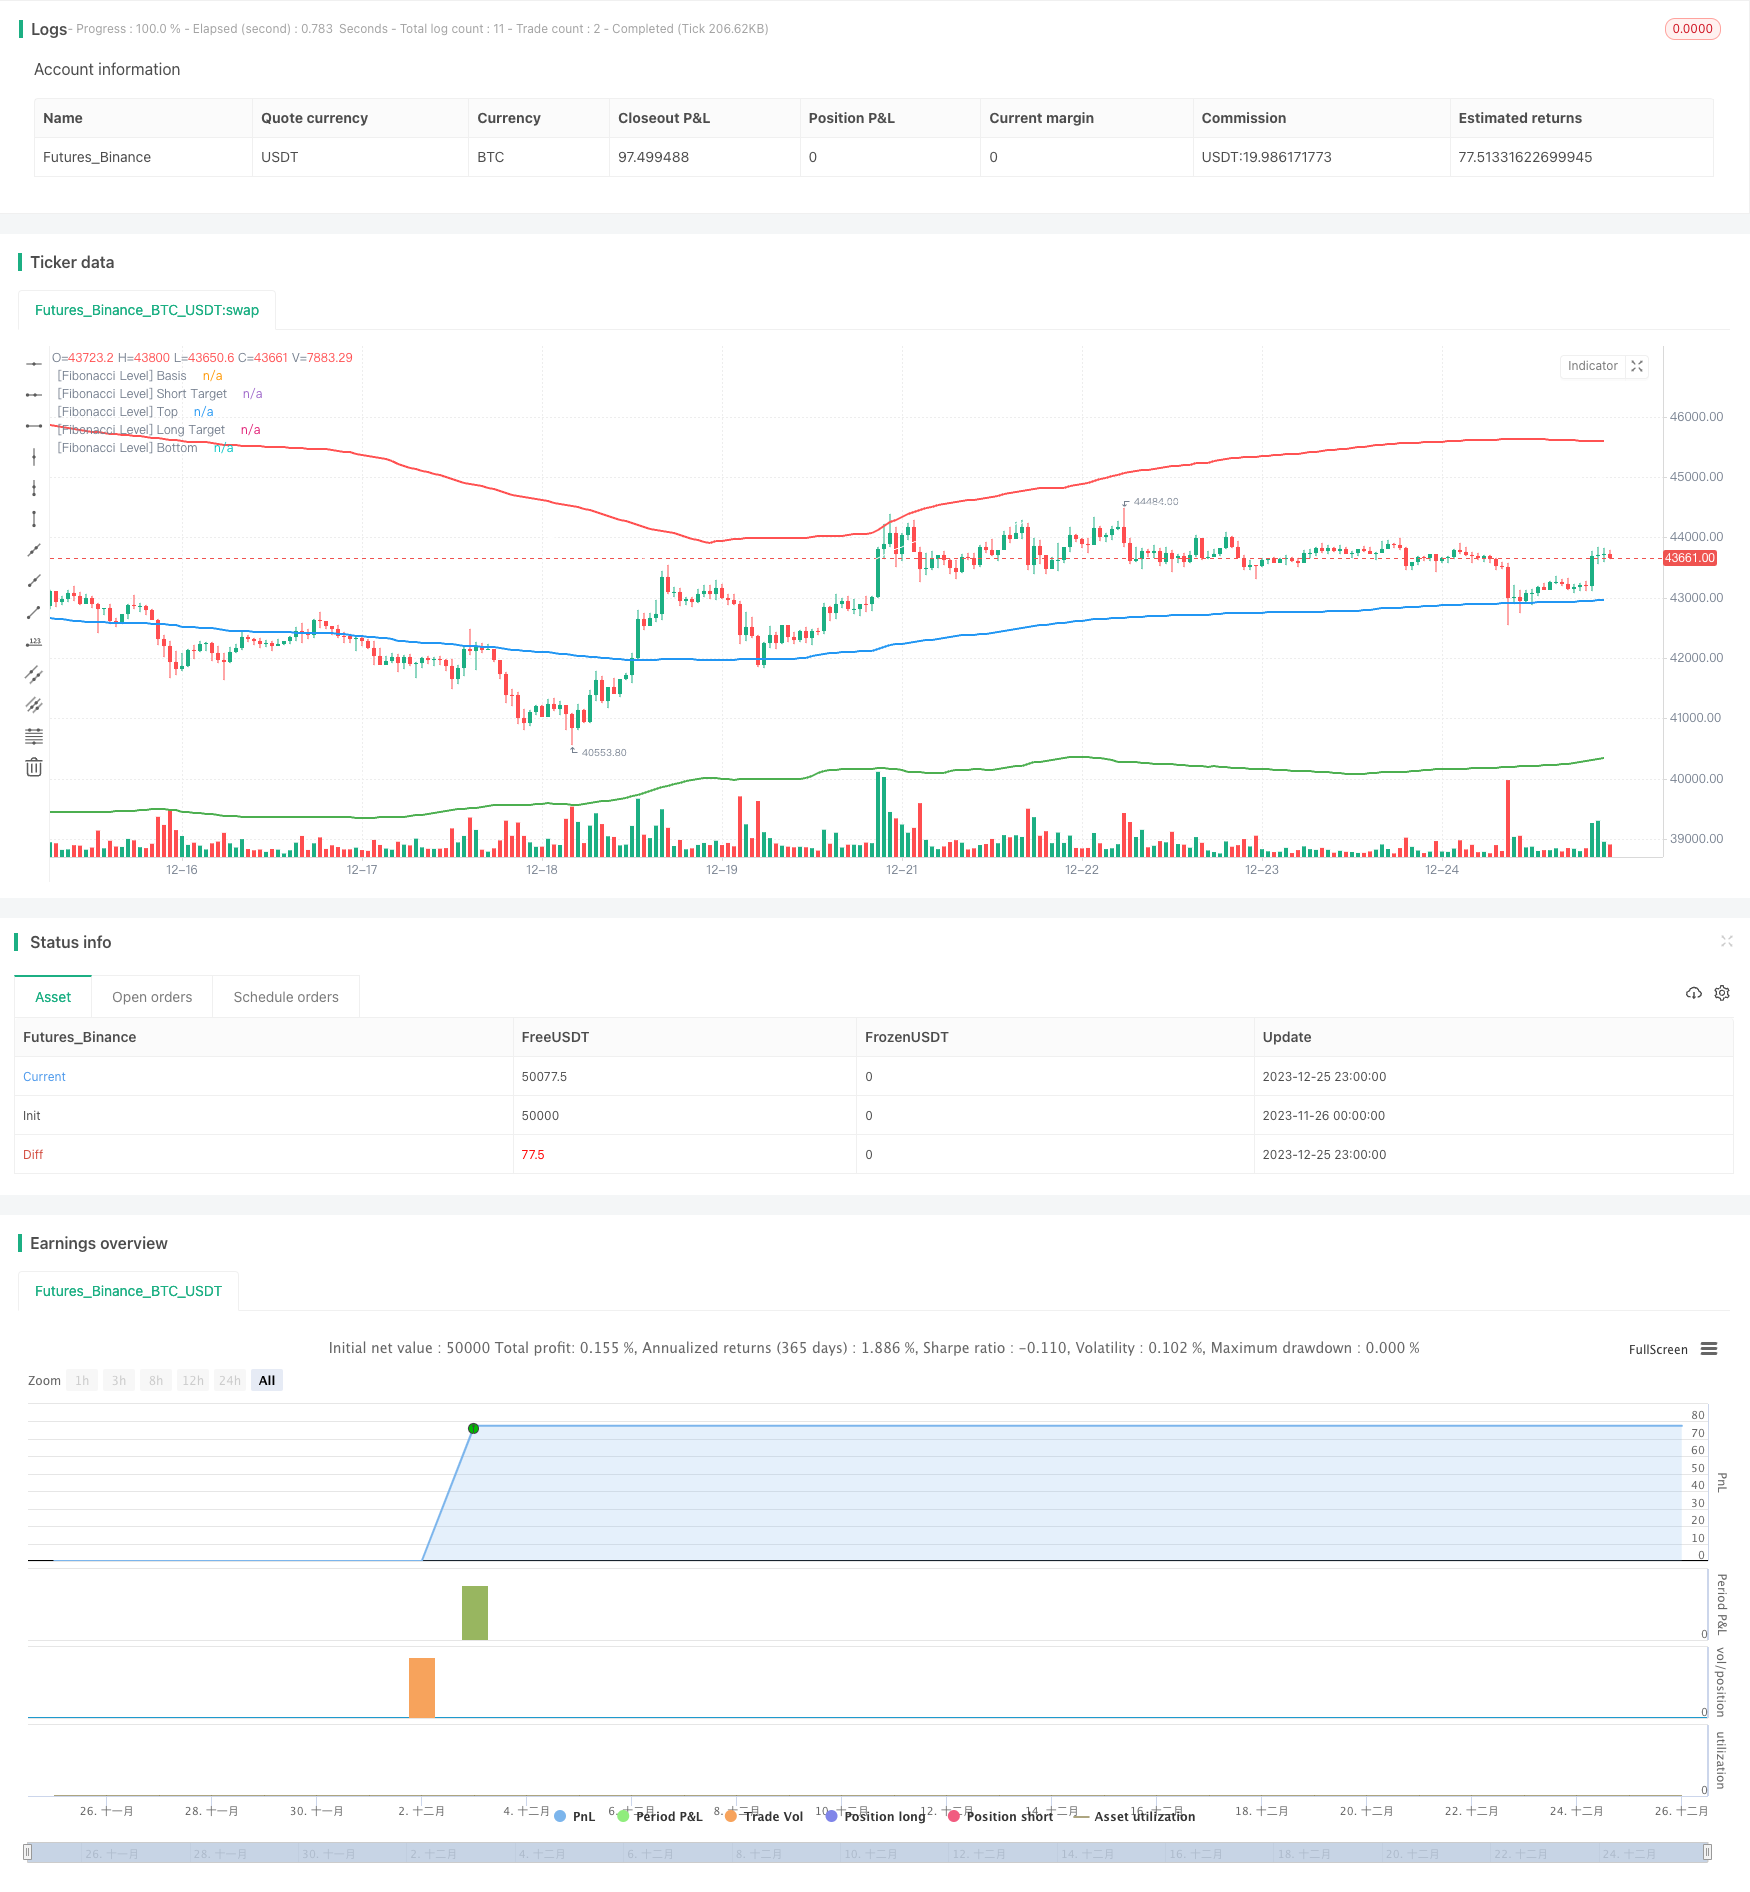
This article mainly describes a trading strategy that combines the Relative Strength Index (RSI) and Fibonacci retracement levels. The strategy first calculates the key Fibonacci retracement levels based on the…
Overview
This article mainly describes a trading strategy that combines the Relative Strength Index (RSI) and Fibonacci retracement levels. The strategy first calculates the key Fibonacci retracement levels based on the historical price dynamics over a certain period, and then uses the RSI indicator to judge whether the market is overbought or oversold near the retracement levels to generate trading signals.
Strategy Principle
The main principles behind this strategy are:
Use price data over a certain period (e.g. 200 bars) to calculate the median price, standard deviation and key Fibonacci retracement levels (e.g. 0.764) for that period;
When the price approaches the upper or lower retracement levels, use the RSI indicator to determine if there is overbought or oversold condition around those levels;
If the RSI indicator shows overbought or oversold signals, long or short signals will be generated around the retracement levels;
Set stop loss and take profit to close positions when price exceeds preset levels or stop loss is triggered.
The above is the basic workflow for identifying trading opportunities in this strategy.
Advantage Analysis
Compared to using RSI or Fibonacci alone, this combined strategy has the following advantages:
Double indicator filtering can reduce false signals and improve signal quality;
Trading at Fibonacci retracement levels is a classic technical analysis technique;
With stop loss and take profit in pace, max loss per trade can be effectively controlled;
Parameters can be optimized for different periods and products.
Risk Analysis
There are also some risks to note for this strategy:
Probability for a reversal at key levels is not 100%, need to combine with price action;
Single period RSI may generate false signals from dead cat bounces, consider multiple timeframe validation;
Loose stop loss setting may increase losses;
Stops may be run through during volatile price swings. Wider stops should be considered.
These risks can be managed through parameter tuning, optimizing indicator combinations etc.
Optimization Directions
Areas for further optimizations include:
Add volume indicator to avoid false breakouts with low volume;
Consider Bollinger Bands for signals from band breakouts;
Build machine learning models to automatically detect high quality trading opportunities;
Use genetic algorithms for auto parameter tuning and adjusting stop loss/profit levels.
Summary
This article describes in detail a quantitative trading strategy that combines RSI and Fibonacci retracement analysis. By blending dual indicator analysis and classic technical strategies, the strategy improves signal quality under managed risks. Further performance gains can be achieved through ongoing parameter tuning and model optimization.
Parameters
| Name | Default | What it controls |
|---|---|---|
| v_input_1 | 1.5 | SL in % of Instrum. i.e 1.5%=150pips |
| v_input_2 | 14 | [RSI] Length |
| v_input_3 | 30 | [RSI] Over Sold % |
| v_input_4 | 70 | [RSI] Over Bought % |
| v_input_5 | 200 | [Fibonacci] Length |
| v_input_6_hlc3 | 0 | [Fibonacci] Source: hlc3 | high | low | open | hl2 | close | hlcc4 | ohlc4 |
| v_input_7 | 3 | [Fibonacci] Multiplier |
| v_input_8 | 764 | [Fibonacci] Level |
Source Pine Script
/*backtest
start: 2023-11-26 00:00:00
end: 2023-12-26 00:00:00
period: 1h
basePeriod: 15m
exchanges: [{"eid":"Futures_Binance","currency":"BTC_USDT"}]
*/

//@version=4
strategy(title="Gab Fib  + RSI", overlay=true, default_qty_type=strategy.cash, default_qty_value=100000, initial_capital=1000, currency=currency.USD, commission_type=strategy.commission.cash_per_order, commission_value=4)

// Inputs
timeFilter = year >= 2000
    // Stop Loss
stop_loss = input(title="SL in % of Instrum. i.e 1.5%=150pips", minval=0, step=0.1, defval=1.5) /100
    // RSI Inputs
len = input(title="[RSI] Length", minval=0, step=1, defval=14)
overSold = input(title="[RSI] Over Sold %", defval=30)
overBought = input(title="[RSI] Over Bought %", defval=70)
    // Fibonacci Levels
length = input(title="[Fibonacci] Length", defval=200, minval=1)
src = input(hlc3, title="[Fibonacci] Source")
mult = input(title="[Fibonacci] Multiplier", defval=3.0, minval=0.001, maxval=50)
level = input(title="[Fibonacci] Level", defval=764)


// Calculate Fibonacci
basis = vwma(src, length)
dev = mult * stdev(src, length)
fu764= basis + (0.001*level*dev)
fu1= basis + (1*dev)
fd764= basis - (0.001*level*dev)
fd1= basis - (1*dev)

// Calculate RSI
vrsi = rsi(close, len)

// Calculate the Targets
targetUp = fd764
targetDown = fu764
    // Actual Targets
bought = strategy.position_size[0] > strategy.position_size[1]
exit_long = valuewhen(bought, targetUp, 0)
sold = strategy.position_size[0] < strategy.position_size[1]
exit_short = valuewhen(sold, targetDown, 0)

// Calculate Stop Losses
sl_long = close * (1-stop_loss)
sl_short = close * (1+stop_loss)


// Conditions to Open Trades
openLong = low < fd1 and crossover(vrsi[1], overSold)
openShort = high > fu1 and crossunder(vrsi[1], overBought)

// Conditions to Close Trades
closeLong = high > exit_long or sl_long
closeShort = low < exit_short or sl_short


//Rounding to MinTick value
roundtargetUp = round_to_mintick(targetUp)
roundtargetDown = round_to_mintick(targetDown)
roundsllong = round_to_mintick(sl_long)
roundslshort = round_to_mintick(sl_short)

// Plots
plot(basis, color=color.blue, linewidth=2, title="[Fibonacci Level] Basis")
plot(fu764, color=color.white, linewidth=1, title="[Fibonacci Level] Short Target")
plot(fu1, color=color.red, linewidth=2, title="[Fibonacci Level] Top")
plot(fd764, color=color.white, linewidth=1, title="[Fibonacci Level] Long Target")
plot(fd1, color=color.green, linewidth=2, title="[Fibonacci Level] Bottom")


// Strategy Orders
if timeFilter
    // Entry Orders
    strategy.entry(id="buy", long=true, when=openLong and high < targetUp, limit=close, alert_message="buy,"+tostring(syminfo.ticker)+",tp="+tostring(roundtargetUp)+",sl="+tostring(roundsllong))
    strategy.entry(id="sell", long=false, when=openShort and low > targetDown, limit=close,  alert_message="sell,"+tostring(syminfo.ticker)+",tp="+tostring(roundtargetDown)+",sl="+tostring(roundslshort))

    // Exit Orders
    strategy.exit(id="closelong", when=closeLong and strategy.position_size > 0, limit=exit_long, stop=sl_long, alert_message="closelong,"+tostring(syminfo.ticker))
strategy.exit(id="closeshort", when=closeShort and strategy.position_size < 0, limit=exit_short, stop=sl_short, alert_message="closeshort,"+tostring(syminfo.ticker))Published by ChaoZhang on the FMZ strategy square · last modified 2023-12-27. Collected in the Quant Trading Vault. Unvalidated research: re-test with your own data and costs before trusting it.
Build this with AgenKit
A spec is not a trading system. Paste this into your coding agent and AgenKit runs a specialist team — architecture, test-first build, risk gates, review — with paper trading on by default.
/agenkit build a production-grade trading bot with a backtest engine, risk controls and paper trading by default from strategies/RSI-and-Fibonacci-Retracement-Trading-Strategy.md- npx agenkit install engineering-kit in your project
- Paste the command into your agent and approve each phase
- Get tests, backtest, risk controls and a paper-trading switch
Understand it first
Before you run this, read the lesson behind the idea and how to backtest it honestly. Specs like this one are the survivors of an unknown number of trials; deflate their results accordingly.
Related specs
- Dynamic Price Swing Oscillator StrategyPine Script · Machine learning · 1m
- Multi Level Balanced Quantitative Trading StrategyPine Script · Machine learning · 1d
- Configurable BBRSIAroon Strategy BacktestPine Script · Machine learning · 5m
- EMA and RSI Quantitative Trading StrategyPine Script · Machine learning · 1h
- Fibonacci HMA AI Buy Sell Signal StrategyPine Script · Machine learning · 1d
- High Frequency Hybrid Technical Analysis Quantitative StrategyPine Script · Machine learning · 15m