Strategy vault / Mean reversion
RSI and smoothed RSI bullish divergence strategy
This strategy combines RSI indicator and smoothed RSI indicator to find buying opportunities at price bottoms. When RSI makes a new low while price does not make a new low, it is considered as a bullish divergence…
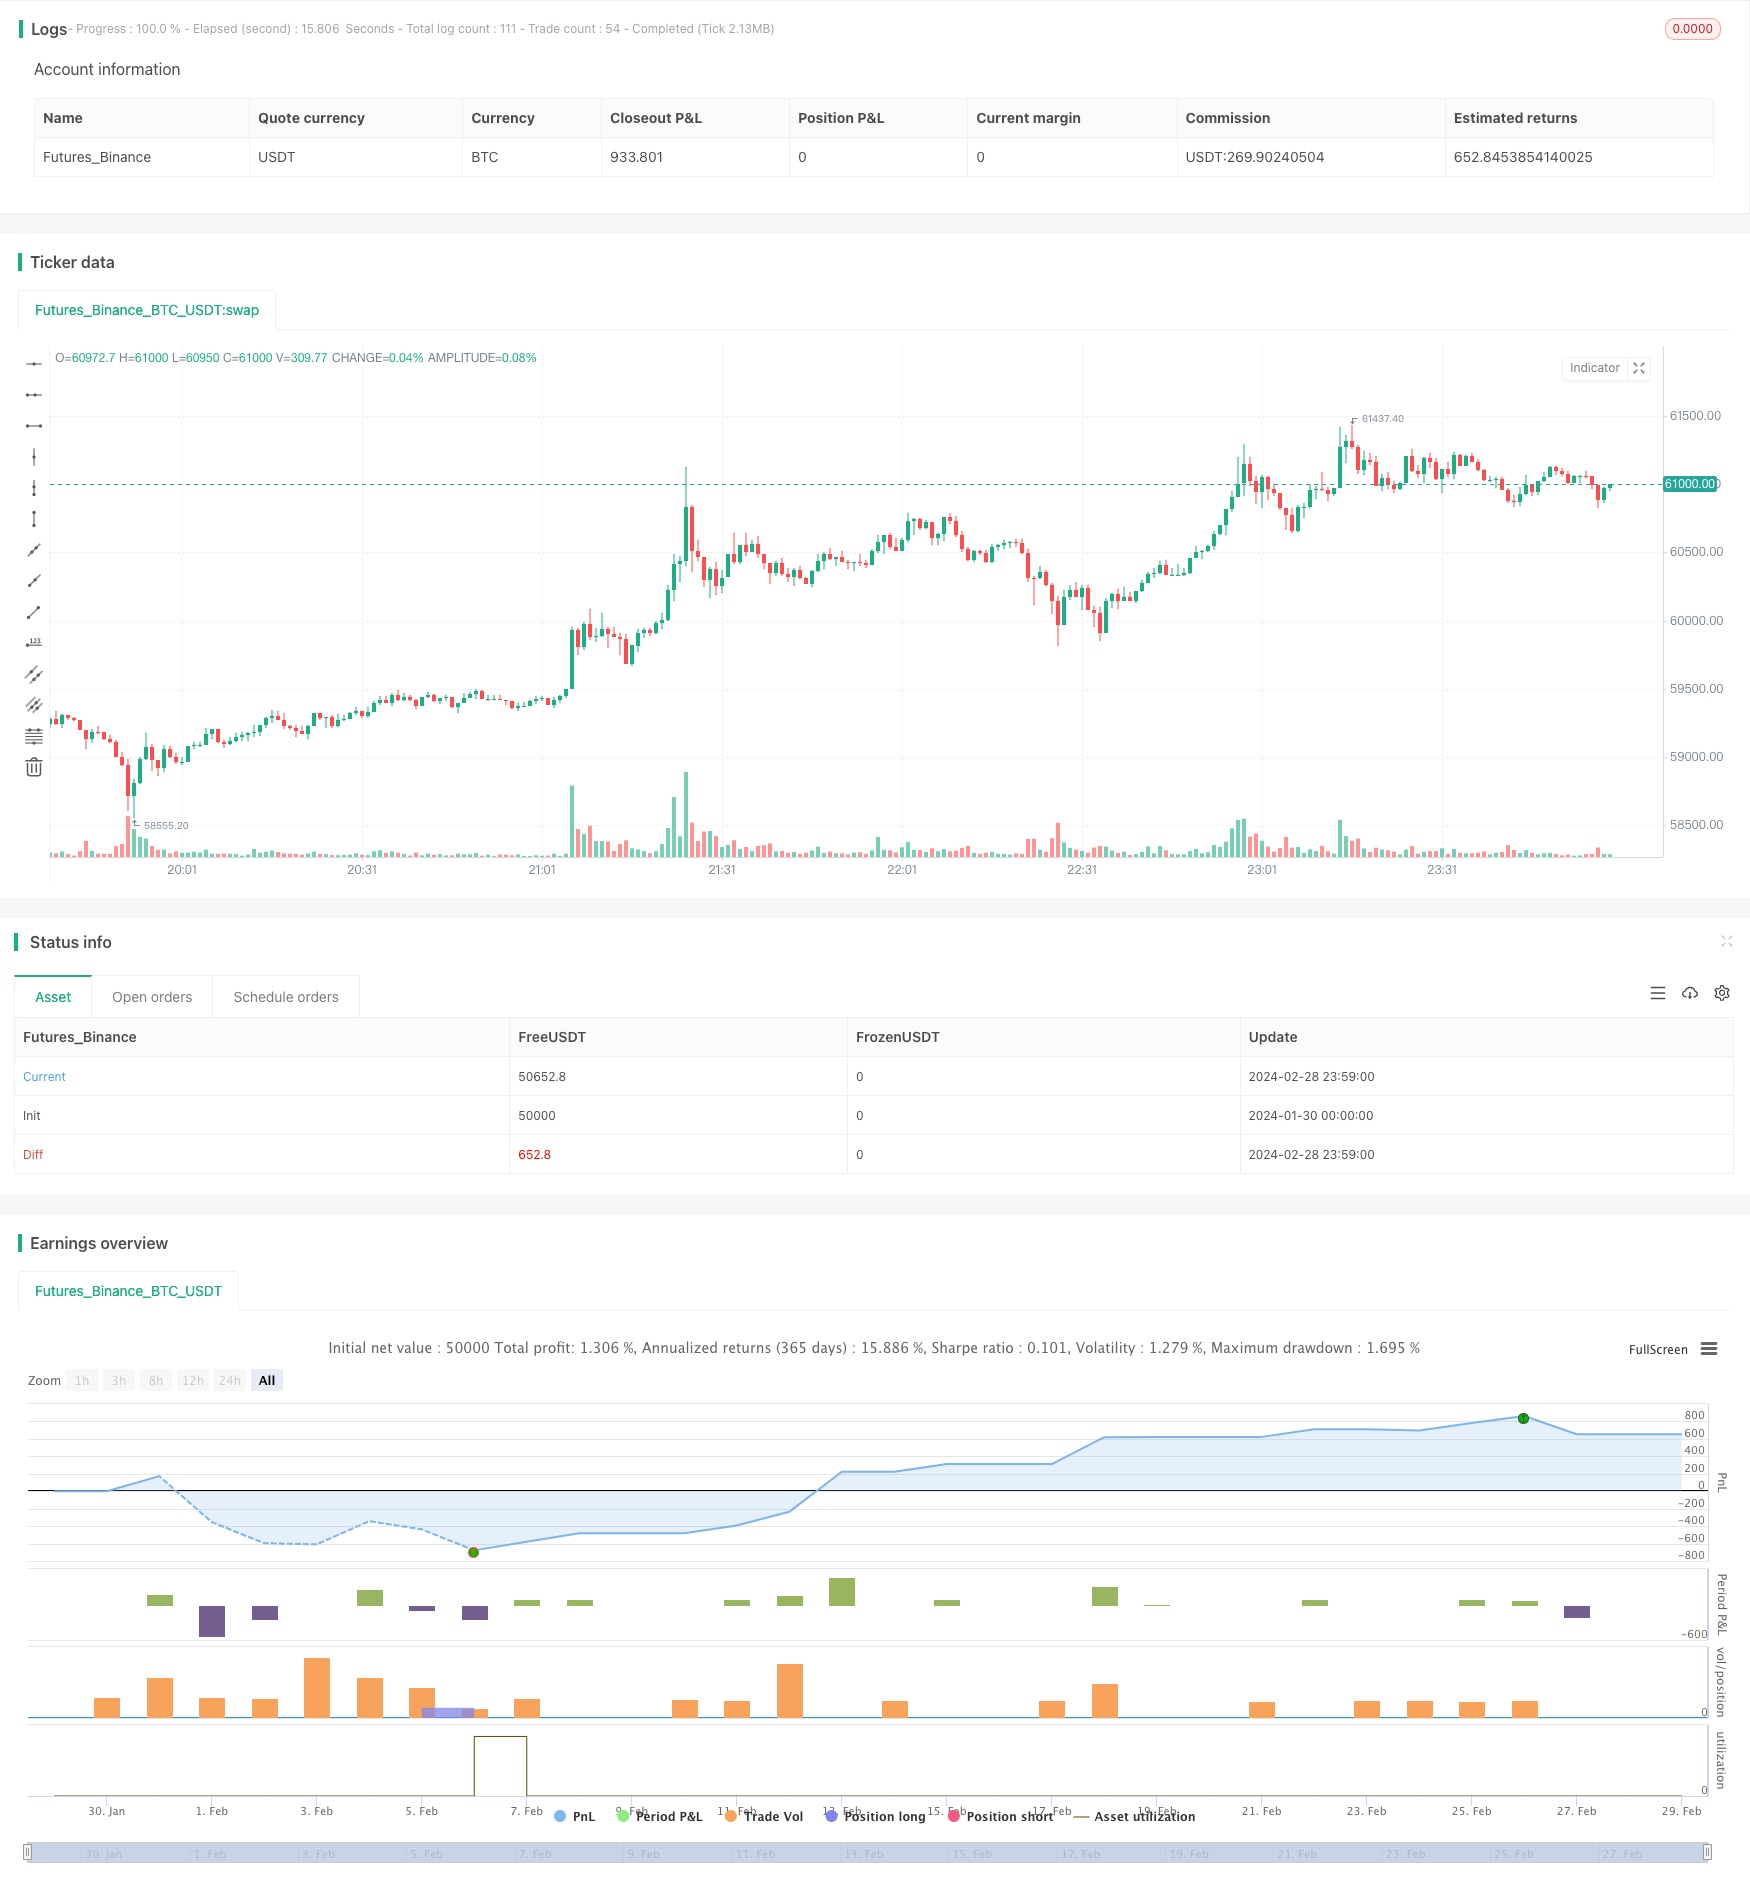
Overview
This strategy combines RSI indicator and smoothed RSI indicator to find buying opportunities at price bottoms. When RSI makes a new low while price does not make a new low, it is considered as a bullish divergence signal. Adding smoothed RSI trend judgment can improve the strategy performance.
Strategy Logic
- Calculate RSI indicator with 14 periods.
- Calculate smoothed RSI using double WMA to achieve smoothing effect.
- Check if RSI is below 30 level, oversold status.
- Check if smoothed RSI is below 35, with stronger directional trend.
- Check if the RSI lowest point is below 25.
- Calculate RSI bullish divergence, find RSI making new low while price does not.
- Require smoothed RSI downtrend lasts more than 3 periods.
- Trigger buy signal when all conditions above are met.
- Set stop loss and take profit conditions.
The strategy mainly relies on the RSI reversal characteristic, combining with smoothed RSI trend judgment, to buy when price is under pressure while RSI is oversold. Close position when stop loss or take profit is touched.
Advantage Analysis
- Dual RSI indicators combination improves strategy performance.
- Utilize the RSI reversal feature, has a probability edge.
- Smoothed RSI trend judgment helps avoid false reversals.
- Complete stop loss and take profit logic can limit risks.
Risk Analysis
- Probability of RSI reversal failure cannot be completely avoided.
- Smoothed RSI has lagging effect, may miss best entry timing.
- Stop loss set too loose, risk of expanding losses.
Can optimize entry timing by adjusting RSI parameters. Tighten stop loss distance for faster stopping out. Combine with other indicators to judge trend risk, lower false reversal rate.
Optimization Directions
- Test effectiveness of RSI under different parameter sets.
- Enhance smoothed RSI calculation for better smoothing quality.
- Adjust stop loss and take profit points, find optimal risk-reward ratio.
- Add momentum indicators etc. to avoid low momentum situations.
Further improve strategy performance by parameter tuning and combining more indicators.
Conclusion
The strategy utilizes the RSI reversal characteristic overall. The dual RSI combination fully leverages the reversal effect while also introduces uncertainty from indicator divergence. It is a typical indicator strategy idea. Can improve indicator adaptiveness through relentless testing and optimizing. Also combine more indicators to reduce misjudging and enhance robustness.
Parameters
| Name | Default | What it controls |
|---|---|---|
| v_input_1 | 3 | Take Profit % |
| v_input_2 | 1.75 | Stop Loss % |
| v_input_3 | 14 | RSI Lookback Period |
| v_input_4 | false | Buy Below Lowest Low In RSI Divergence Lookback Target % |
| v_input_5_close | 0 | Source of Buy Below Target Price: close | high | low | open | hl2 | hlc3 | hlcc4 | ohlc4 |
| v_input_6 | 10 | Smoothed RSI Lookback Period |
| v_input_7 | 30 | RSI Currently Below |
| v_input_8 | 25 | RSI Divergence Lookback Period |
| v_input_9 | 25 | RSI Lowest In Divergence Lookback Currently Below |
| v_input_10 | 65 | RSI Sell Above |
| v_input_11 | 3 | Minimum SRSI Downtrend Length |
| v_input_12 | 35 | Smoothed RSI Currently Below |
| v_input_13 | false | Plot Target |
Source Pine Script
/*backtest
start: 2024-01-30 00:00:00
end: 2024-02-29 00:00:00
period: 1m
basePeriod: 1m
exchanges: [{"eid":"Futures_Binance","currency":"BTC_USDT"}]
*/

// This source code is subject to the terms of the Mozilla Public License 2.0 at https://mozilla.org/MPL/2.0/
// © BigBitsIO

//@version=4
strategy(title="RSI and Smoothed RSI Bull Div Strategy [BigBitsIO]", shorttitle="RSI and Smoothed RSI Bull Div Strategy [BigBitsIO]", overlay=true, pyramiding=1, default_qty_type=strategy.percent_of_equity, default_qty_value=100, commission_type=strategy.commission.percent, commission_value=.1, slippage=0)


TakeProfitPercent = input(3, title="Take Profit %", type=input.float, step=.25)
StopLossPercent = input(1.75, title="Stop Loss %", type=input.float, step=.25)

RSICurve = input(14, title="RSI Lookback Period", type=input.integer, step=1)
BuyBelowTargetPercent = input(0, title="Buy Below Lowest Low In RSI Divergence Lookback Target %", type=input.float, step=.05)
BuyBelowTargetSource = input(close, title="Source of Buy Below Target Price", type=input.source)
SRSICurve = input(10, title="Smoothed RSI Lookback Period", type=input.integer, step=1)
RSICurrentlyBelow = input(30, title="RSI Currently Below", type=input.integer, step=1)
RSIDivergenceLookback = input(25, title="RSI Divergence Lookback Period", type=input.integer, step=1)
RSILowestInDivergenceLookbackCurrentlyBelow  = input(25, title="RSI Lowest In Divergence Lookback Currently Below", type=input.integer, step=1)
RSISellAbove = input(65, title="RSI Sell Above", type=input.integer, step=1)
MinimumSRSIDownTrend = input(3, title="Minimum SRSI Downtrend Length", type=input.integer, step=1)
SRSICurrentlyBelow = input(35, title="Smoothed RSI Currently Below", type=input.integer, step=1)

PlotTarget = input(false, title="Plot Target")


RSI = rsi(close, RSICurve)
SRSI = wma(2*wma(RSI, SRSICurve/2)-wma(RSI, SRSICurve), round(sqrt(SRSICurve))) // Hull moving average

SRSITrendDownLength = 0
if (SRSI < SRSI[1])
    SRSITrendDownLength := SRSITrendDownLength[1] + 1

// Strategy Specific
ProfitTarget = (close * (TakeProfitPercent / 100)) / syminfo.mintick
LossTarget = (close * (StopLossPercent / 100)) / syminfo.mintick
BuyBelowTarget = BuyBelowTargetSource[(lowestbars(RSI, RSIDivergenceLookback)*-1)] - (BuyBelowTargetSource[(lowestbars(RSI, RSIDivergenceLookback)*-1)] * (BuyBelowTargetPercent / 100))

plot(PlotTarget ? BuyBelowTarget : na)


bool IsABuy = RSI < RSICurrentlyBelow and SRSI < SRSICurrentlyBelow and lowest(SRSI, RSIDivergenceLookback) < RSILowestInDivergenceLookbackCurrentlyBelow and BuyBelowTargetSource < BuyBelowTarget and SRSITrendDownLength >= MinimumSRSIDownTrend and RSI > lowest(RSI, RSIDivergenceLookback)
bool IsASell = RSI > RSISellAbove

if IsABuy
    strategy.entry("Positive Trend", true) // buy by market
    strategy.exit("Take Profit or Stop Loss", "Positive Trend", profit = ProfitTarget, loss = LossTarget)
if IsASell
    strategy.close("Positive Trend")
Published by ChaoZhang on the FMZ strategy square · last modified 2024-03-01. Collected in the Quant Trading Vault. Unvalidated research: re-test with your own data and costs before trusting it.
Build this with AgenKit
A spec is not a trading system. Paste this into your coding agent and AgenKit runs a specialist team — architecture, test-first build, risk gates, review — with paper trading on by default.
/agenkit build a production-grade trading bot with a backtest engine, risk controls and paper trading by default from strategies/RSI-and-smoothed-RSI-bullish-divergence-strategy.md- npx agenkit install engineering-kit in your project
- Paste the command into your agent and approve each phase
- Get tests, backtest, risk controls and a paper-trading switch
Understand it first
Before you run this, read the lesson behind the idea and how to backtest it honestly. Specs like this one are the survivors of an unknown number of trials; deflate their results accordingly.
Related specs
- ATR and EMA based Dynamic Take Profit and Stop Loss Adaptive StrategyPine Script · Mean reversion · 1h
- Adaptive Mean Reversion Trading Strategy Based on Chande Momentum OscillatorPine Script · Mean reversion · 1d
- Adaptive RSI Oscillator Dynamic Trading Strategy with Threshold OptimizationPine Script · Mean reversion · 1d
- Advanced 15 Minute Chart Trading Signal StrategyPine Script · Mean reversion · 3h
- Advanced Fibonacci Retracement Trend Following and Reversal Trading StrategyPine Script · Mean reversion · 3h
- Advanced Momentum EMA Trend Following with RSI Overbought Oversold Trading StrategyPine Script · Mean reversion · 1d