Strategy vault / Trend following
RSI and WMA Crossover Strategy
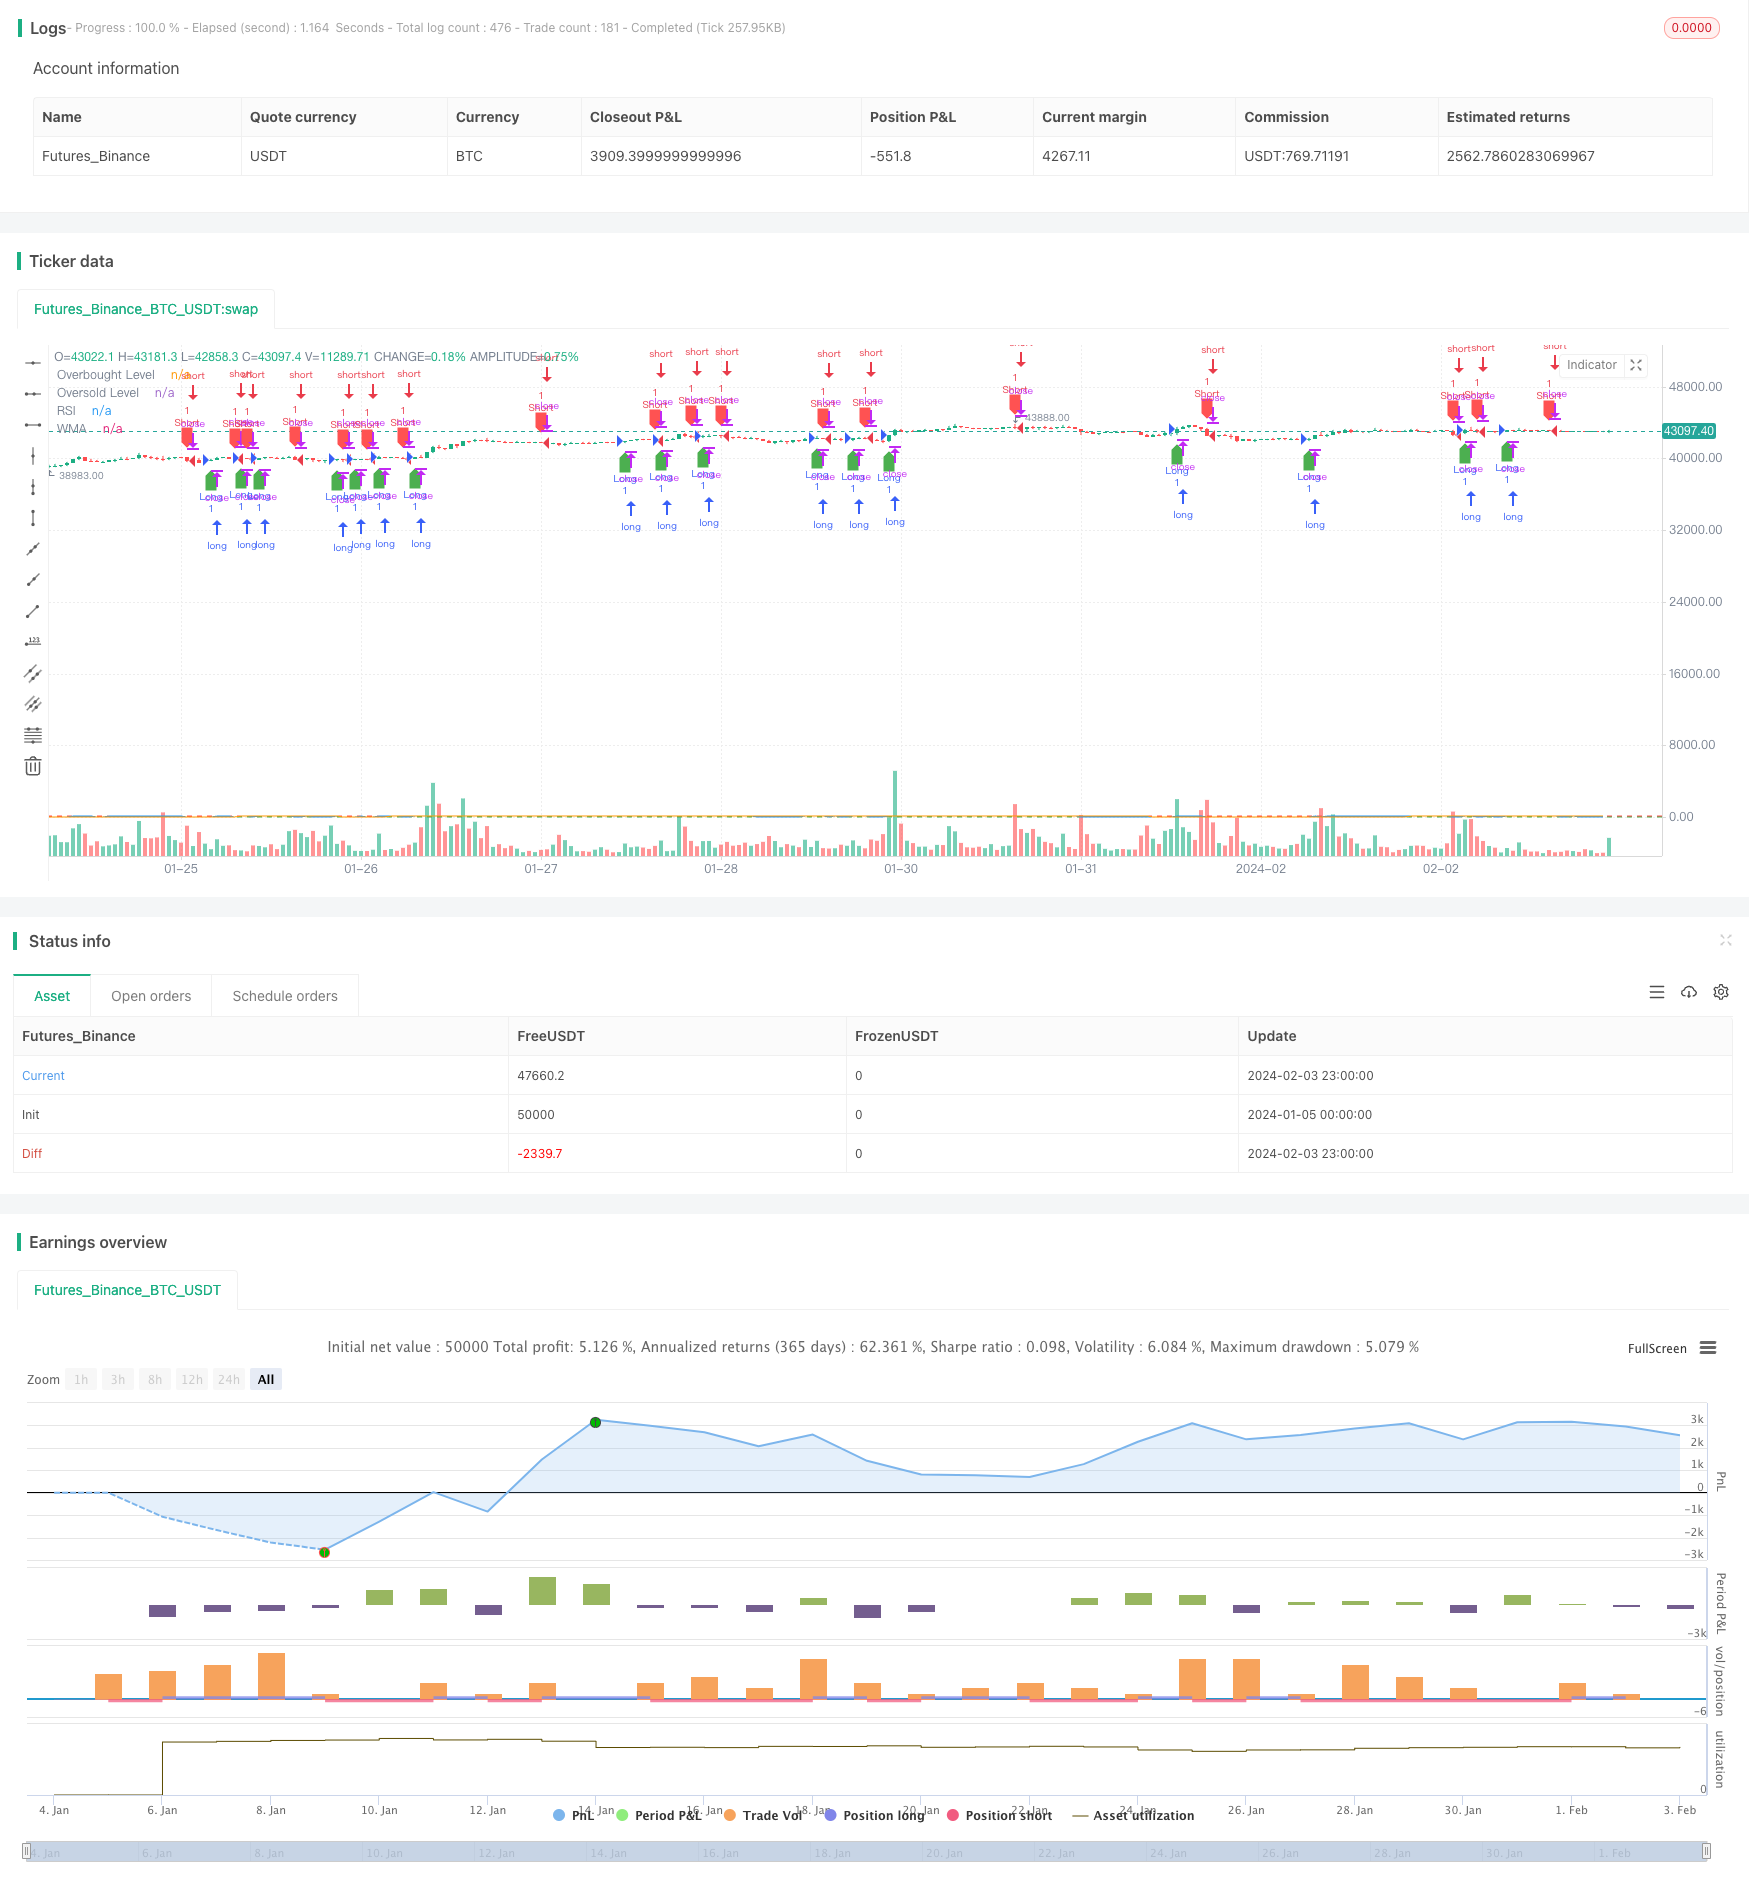
This article mainly introduces a quantitative trading strategy based on RSI and WMA. The strategy generates buy and sell signals by calculating the values of RSI and WMA to discover reversal points of stock prices…
Overview
This article mainly introduces a quantitative trading strategy based on RSI and WMA. The strategy generates buy and sell signals by calculating the values of RSI and WMA to discover reversal points of stock prices, aiming to buy low and sell high.
Strategy Logic
The core indicators of this strategy include RSI and WMA. RSI (Relative Strength Index) is a volatility indicator used to measure the change in the speed of recent price rises and falls. WMA (Weighted Moving Average) is a weighted moving average.
The buy signal of the strategy is generated when the RSI crosses above the WMA, indicating a price reversal and a possible start of an upward trend. The sell signal is generated when the RSI crosses below the WMA, implying a price reversal and a possible start of a downward trend.
Specifically, the strategy first calculates the 14-day RSI, then calculates the 45-day WMA. If the RSI crosses above the WMA, a buy signal is generated. If the RSI crosses below the WMA, a sell signal is generated. The combination of RSI and WMA can capture price reversal points more accurately.
Advantages
This strategy has the following advantages:
- Clear signals and easy rules facilitate implementation.
- RSI and WMA verifies each other to reduce false signals.
- Adjustable RSI parameters suit stocks with different cycles.
- Adjustable WMA parameters capture trends at different levels.
- Simple and clean code for easy optimization.
Risks
The risks include:
- Extreme price swings may trigger stop loss.
- Inappropriate RSI and WMA parameters lead to failure.
- High trading frequency increases costs and slippage.
- Unable to filter systemic risks effectively.
These risks can be mitigated by parameter tuning, stop loss, filtering market risks etc.
Enhancement Opportunities
The strategy can be optimized from the following aspects:
- Test RSI and WMA parameters for optimal values.
- Add volume filter to avoid false signals.
- Set variable stop loss lines against adverse price moves.
- Integrate other indicators like MACD and BOLL for filtering.
- Improve entry and exit logic for timing optimization.
Conclusion
This strategy integrates RSI and WMA to capture crossovers for trade signals, enabling simple and effective algo trading. It is easy to implement and profitable in bull markets. Further parameter testing, tuning, and proper stop loss mechanisms can enhance its stability and profitability.
Parameters
| Name | Default | What it controls |
|---|---|---|
| v_input_1 | 14 | RSI Length |
| v_input_2 | 45 | WMA Length |
Source Pine Script
/*backtest
start: 2024-01-05 00:00:00
end: 2024-02-04 00:00:00
period: 1h
basePeriod: 15m
exchanges: [{"eid":"Futures_Binance","currency":"BTC_USDT"}]
*/

//@version=5
strategy("RSI WMA Strategy", overlay=true)

// Input parameters
rsiLength = input(14, title="RSI Length")
wmaLength = input(45, title="WMA Length")

// Calculate RSI and WMA
rsiValue = ta.rsi(close, rsiLength)
wmaValue = ta.wma(rsiValue, wmaLength)

// Define overbought and oversold levels for RSI
overboughtLevel = 70
oversoldLevel = 30

// Strategy logic
longCondition = ta.crossover(rsiValue, wmaValue)
shortCondition = ta.crossunder(rsiValue, wmaValue)

// Execute trades
if (longCondition)
    strategy.entry("Long", strategy.long, comment="BUY")
if (shortCondition)
    strategy.entry("Short", strategy.short, comment="SELL")

// Plotting for visualization
plot(rsiValue, title="RSI", color=color.blue)
plot(wmaValue, title="WMA", color=color.orange)
hline(overboughtLevel, "Overbought Level", color=color.red)
hline(oversoldLevel, "Oversold Level", color=color.green)

// Plot buy and sell signals on the chart
plotshape(series=longCondition, title="Buy Signal", color=color.green, style=shape.labelup, location=location.belowbar)
plotshape(series=shortCondition, title="Sell Signal", color=color.red, style=shape.labeldown, location=location.abovebar)
Published by ChaoZhang on the FMZ strategy square · last modified 2024-02-05. Collected in the Quant Trading Vault. Unvalidated research: re-test with your own data and costs before trusting it.
Build this with AgenKit
A spec is not a trading system. Paste this into your coding agent and AgenKit runs a specialist team — architecture, test-first build, risk gates, review — with paper trading on by default.
/agenkit build a production-grade trading bot with a backtest engine, risk controls and paper trading by default from strategies/RSI-and-WMA-Crossover-Strategy.md- npx agenkit install engineering-kit in your project
- Paste the command into your agent and approve each phase
- Get tests, backtest, risk controls and a paper-trading switch
Understand it first
Before you run this, read the lesson behind the idea and how to backtest it honestly. Specs like this one are the survivors of an unknown number of trials; deflate their results accordingly.
Related specs
- Dual SMA Crossover StrategyPine Script · Trend following · 5m
- Fixed Range Volume Profile And Anchored VWAP Trend Identification Strategy With Dynamic Stop LossPine Script · Trend following · 1h
- Five Minute Triple Confirmation Trend Trading Strategy with Risk Management SystemPine Script · Trend following · 1m
- Moving Average Crossover Strategy 427164Pine Script · Trend following · 10m
- Multi Indicator Fusion Volatility Capture Adaptive Trend Following StrategyPine Script · Trend following · 1h
- Multi Indicator Cross Trend Tracking and Volume Price Combined Adaptive Trading StrategyPine Script · Trend following · 1d