Strategy vault / Mean reversion
RSI based Auto Trading Strategy
This strategy designs an automated trading system for both long and short positions based on the RSI indicator. It enters trades when the RSI shows overbought or oversold levels, and exits with stop losses triggered…
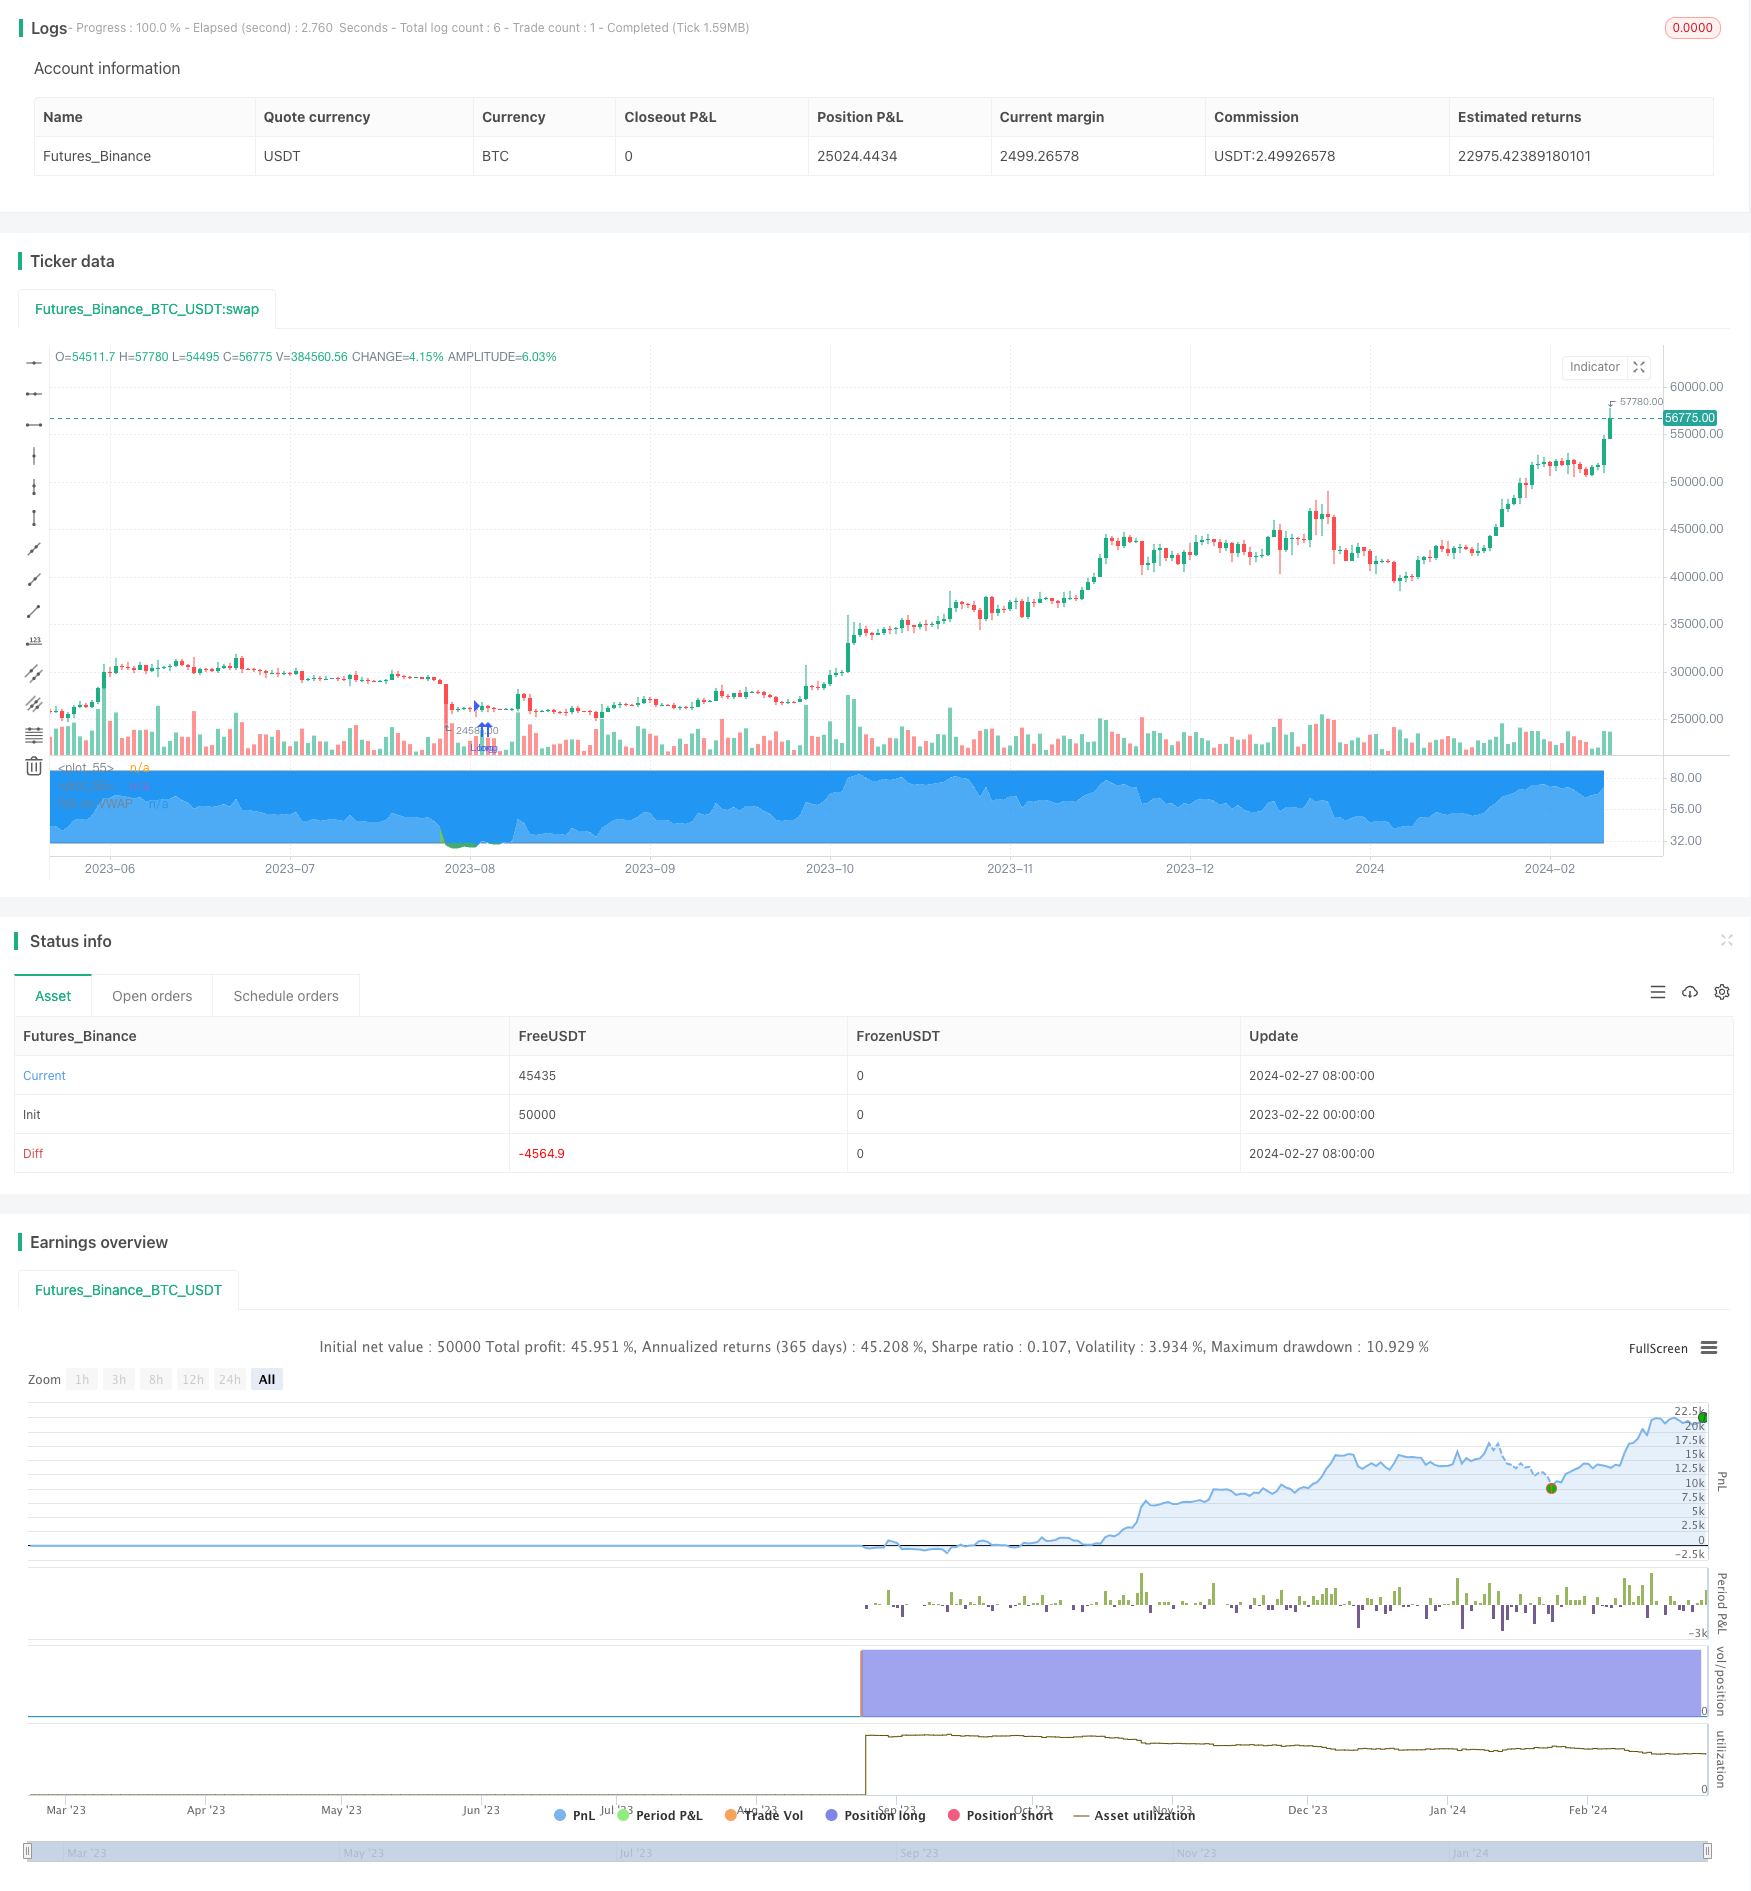
Overview
This strategy designs an automated trading system for both long and short positions based on the RSI indicator. It enters trades when the RSI shows overbought or oversold levels, and exits with stop losses triggered by specific conditions.
Strategy Logic
The strategy utilizes the RSI indicator to identify overbought/oversold market conditions. Specifically, when RSI drops below the oversold line, it enters long positions; when RSI exceeds the overbought line, it enters short positions.
In addition, exit rules are set up in the strategy. After opening long positions, if RSI crosses above the overbought line again, it will trigger stop losses to close longs; similarly, after opening shorts, if RSI crosses below the oversold line again, it will close out shorts.
Advantage Analysis
The biggest advantage of this strategy is using the RSI indicator to judge overbought/oversold scenarios, which is a relatively mature and reliable technical analysis method in quantitative trading. Compared to simple moving average strategies, this strategy can capture market turning points more accurately, thus increasing the profit potential of the trading system.
Also, the stop loss mechanism effectively controls the downside risk during strong one-directional trends, which is in sharp contrast with traditional trend-following strategies where runners can get into trouble easily.
Risk Analysis
The biggest risk is the RSI indicator may give wrong trading signals occasionally. No technical indicator can be 100% accurate in predicting market moves, including RSI. When RSI makes wrong judgements on overbought/oversold status, it will lead to wrong entries for the strategy.
To mitigate such risk, stop losses are implemented in the strategy. But the odds of stop loss triggers can still be high during strong trends, and manual intervention would be required to close the wrong positions. Generally speaking, human supervision and adjustments are still needed for the automated system to achieve maximum performance.
Optimization Directions
There remains room for further optimizations:
Incorporate other indicators to confirm entry signals and avoid wrong entries from RSI alone. Moving averages etc. could be added.
Optimize RSI parameters to find better length values for more precise overbought/oversold detections.
Fine tune stop loss placement to balance between loss prevention and avoiding premature exits.
Conclusion
Overall, this RSI-based automated trading strategy has the advantage of effectively identifying overbought and oversold market conditions. By entering long and short positions during extreme RSI levels, it aims to profit from market reversals. The stop loss mechanism also helps to limit losses during strong one-directional trends. However, the risk of misjudged RSI signals remains. Further optimizations on confirming indicators, RSI parameters and stop loss placement could enhance the strategy's profitability and risk control. As with all automated systems, human supervision is still required for interventions in special market situations.
Parameters
| Name | Default | What it controls |
|---|---|---|
| v_input_1 | Resolution | |
| v_input_2 | 20 | RSI Length |
| v_input_3 | 30 | RSI Oversold level |
| v_input_4 | 85 | RSI Overbought level |
| v_input_5 | 28 | Number of candles |
| v_input_6 | true | Enter longs ? |
| v_input_7 | true | Enter shorts ? |
| v_input_8 | 2020 | Strategy Start Year |
| v_input_9 | true | Strategy Start Month |
| v_input_10 | true | Strategy Start Day |
| v_input_11 | false | Use Laguerre on RSI ? |
| v_input_12 | 0.06 | Laguerre Gamma |
Source Pine Script
/*backtest
start: 2023-02-22 00:00:00
end: 2024-02-28 00:00:00
period: 1d
basePeriod: 1h
exchanges: [{"eid":"Futures_Binance","currency":"BTC_USDT"}]
*/


//@version=4

strategy("Soran Strategy 2 - LONG SIGNALS", pyramiding=1, initial_capital=1000, default_qty_type=strategy.percent_of_equity, default_qty_value=50, overlay=false)


// ----------------- Inputs ----------------- //

reso = input(title="Resolution", type=input.resolution, defval="")
length = input(20, title="RSI Length", type=input.integer)
ovrsld = input(30, "RSI Oversold level", type=input.float)
ovrbgt = input(85, "RSI Overbought level", type=input.float)
lateleave = input(28, "Number of candles", type=input.integer)
// lateleave : numbers of bars in overbought/oversold zones where the position is closed. The position is closed when this number is reached or when the zone is left (the first condition).

// best parameters BTCUSDTPERP M15 : 20 / 30 / 85 / 28


stratbull = input(title="Enter longs ?", type = input.bool, defval=true)
stratbear = input(title="Enter shorts ?", type = input.bool, defval=true)

stratyear = input(2020, title = "Strategy Start Year")
stratmonth = input(1, title = "Strategy Start Month")
stratday = input(1, title = "Strategy Start Day")
stratstart = timestamp(stratyear,stratmonth,stratday,0,0)


// --------------- Laguerre ----------------- //

laguerre = input(title="Use Laguerre on RSI ?", type=input.bool, defval=false)
gamma = input(0.06, title="Laguerre Gamma")

laguerre_cal(s,g) =>
    l0 = 0.0
    l1 = 0.0
    l2 = 0.0
    l3 = 0.0
    l0 := (1 - g)*s+g*nz(l0[1])
    l1 := -g*l0+nz(l0[1])+g*nz(l1[1])
    l2 := -g*l1+nz(l1[1])+g*nz(l2[1])
    l3 := -g*l2+nz(l2[1])+g*nz(l3[1])
    (l0 + 2*l1 + 2*l2 + l3)/6


// ---------------- Rsi VWAP ---------------- //

rsiV = security(syminfo.tickerid, reso, rsi(vwap(close), length))

rsiVWAP = laguerre ? laguerre_cal(rsiV,gamma) : rsiV


// ------------------ Plots ----------------- //

prsi = plot(rsiVWAP, color = rsiVWAP>ovrbgt ? color.red : rsiVWAP<ovrsld ? color.green : color.white, title="RSI on VWAP", linewidth=1, style=plot.style_line)
hline = plot(ovrbgt, color = color.gray, style=plot.style_line)
lline = plot(ovrsld, color = color.gray, style=plot.style_line)
fill(prsi,hline, color = rsiVWAP > ovrbgt ? color.red : na, transp = 30)
fill(prsi,lline, color = rsiVWAP < ovrsld ? color.green : na, transp = 30)


// ---------------- Positions: only shows Buy and close Buy positions --------------- //

timebull = stratbull
timebear = stratbear

strategy.entry("Long", true, when = timebull and crossover(rsiVWAP, ovrsld), comment="")
strategy.close("Long", when = timebull and crossover(rsiVWAP, ovrbgt)[lateleave] or crossunder(rsiVWAP, ovrbgt), comment="")
Published by ChaoZhang on the FMZ strategy square · last modified 2024-02-29. Collected in the Quant Trading Vault. Unvalidated research: re-test with your own data and costs before trusting it.
Build this with AgenKit
A spec is not a trading system. Paste this into your coding agent and AgenKit runs a specialist team — architecture, test-first build, risk gates, review — with paper trading on by default.
/agenkit build a production-grade trading bot with a backtest engine, risk controls and paper trading by default from strategies/RSI-based-Auto-Trading-Strategy.md- npx agenkit install engineering-kit in your project
- Paste the command into your agent and approve each phase
- Get tests, backtest, risk controls and a paper-trading switch
Understand it first
Before you run this, read the lesson behind the idea and how to backtest it honestly. Specs like this one are the survivors of an unknown number of trials; deflate their results accordingly.
Related specs
- Advanced 15 Minute Chart Trading Signal StrategyPine Script · Mean reversion · 3h
- Market Cypher Wave B Automated Trading StrategyPine Script · Mean reversion · 1h
- Bollinger Bands and VWAP based Quantitative Trading StrategyPine Script · Mean reversion · 1h
- Hull Moving Average and Stochastic RSI Combination Trading StrategyPine Script · Mean reversion · 5m
- Reversal Catcher StrategyPine Script · Mean reversion · 1h
- Volume Weighted Trend Reversal StrategyPine Script · Mean reversion · 1d