Strategy vault / Mean reversion
RSI based Dual Trading Strategy
This strategy designs a dual trading strategy based on the Relative Strength Index (RSI). By comparing the RSI indicator with preset buying and selling thresholds, the strategy buys when the RSI indicator is oversold…
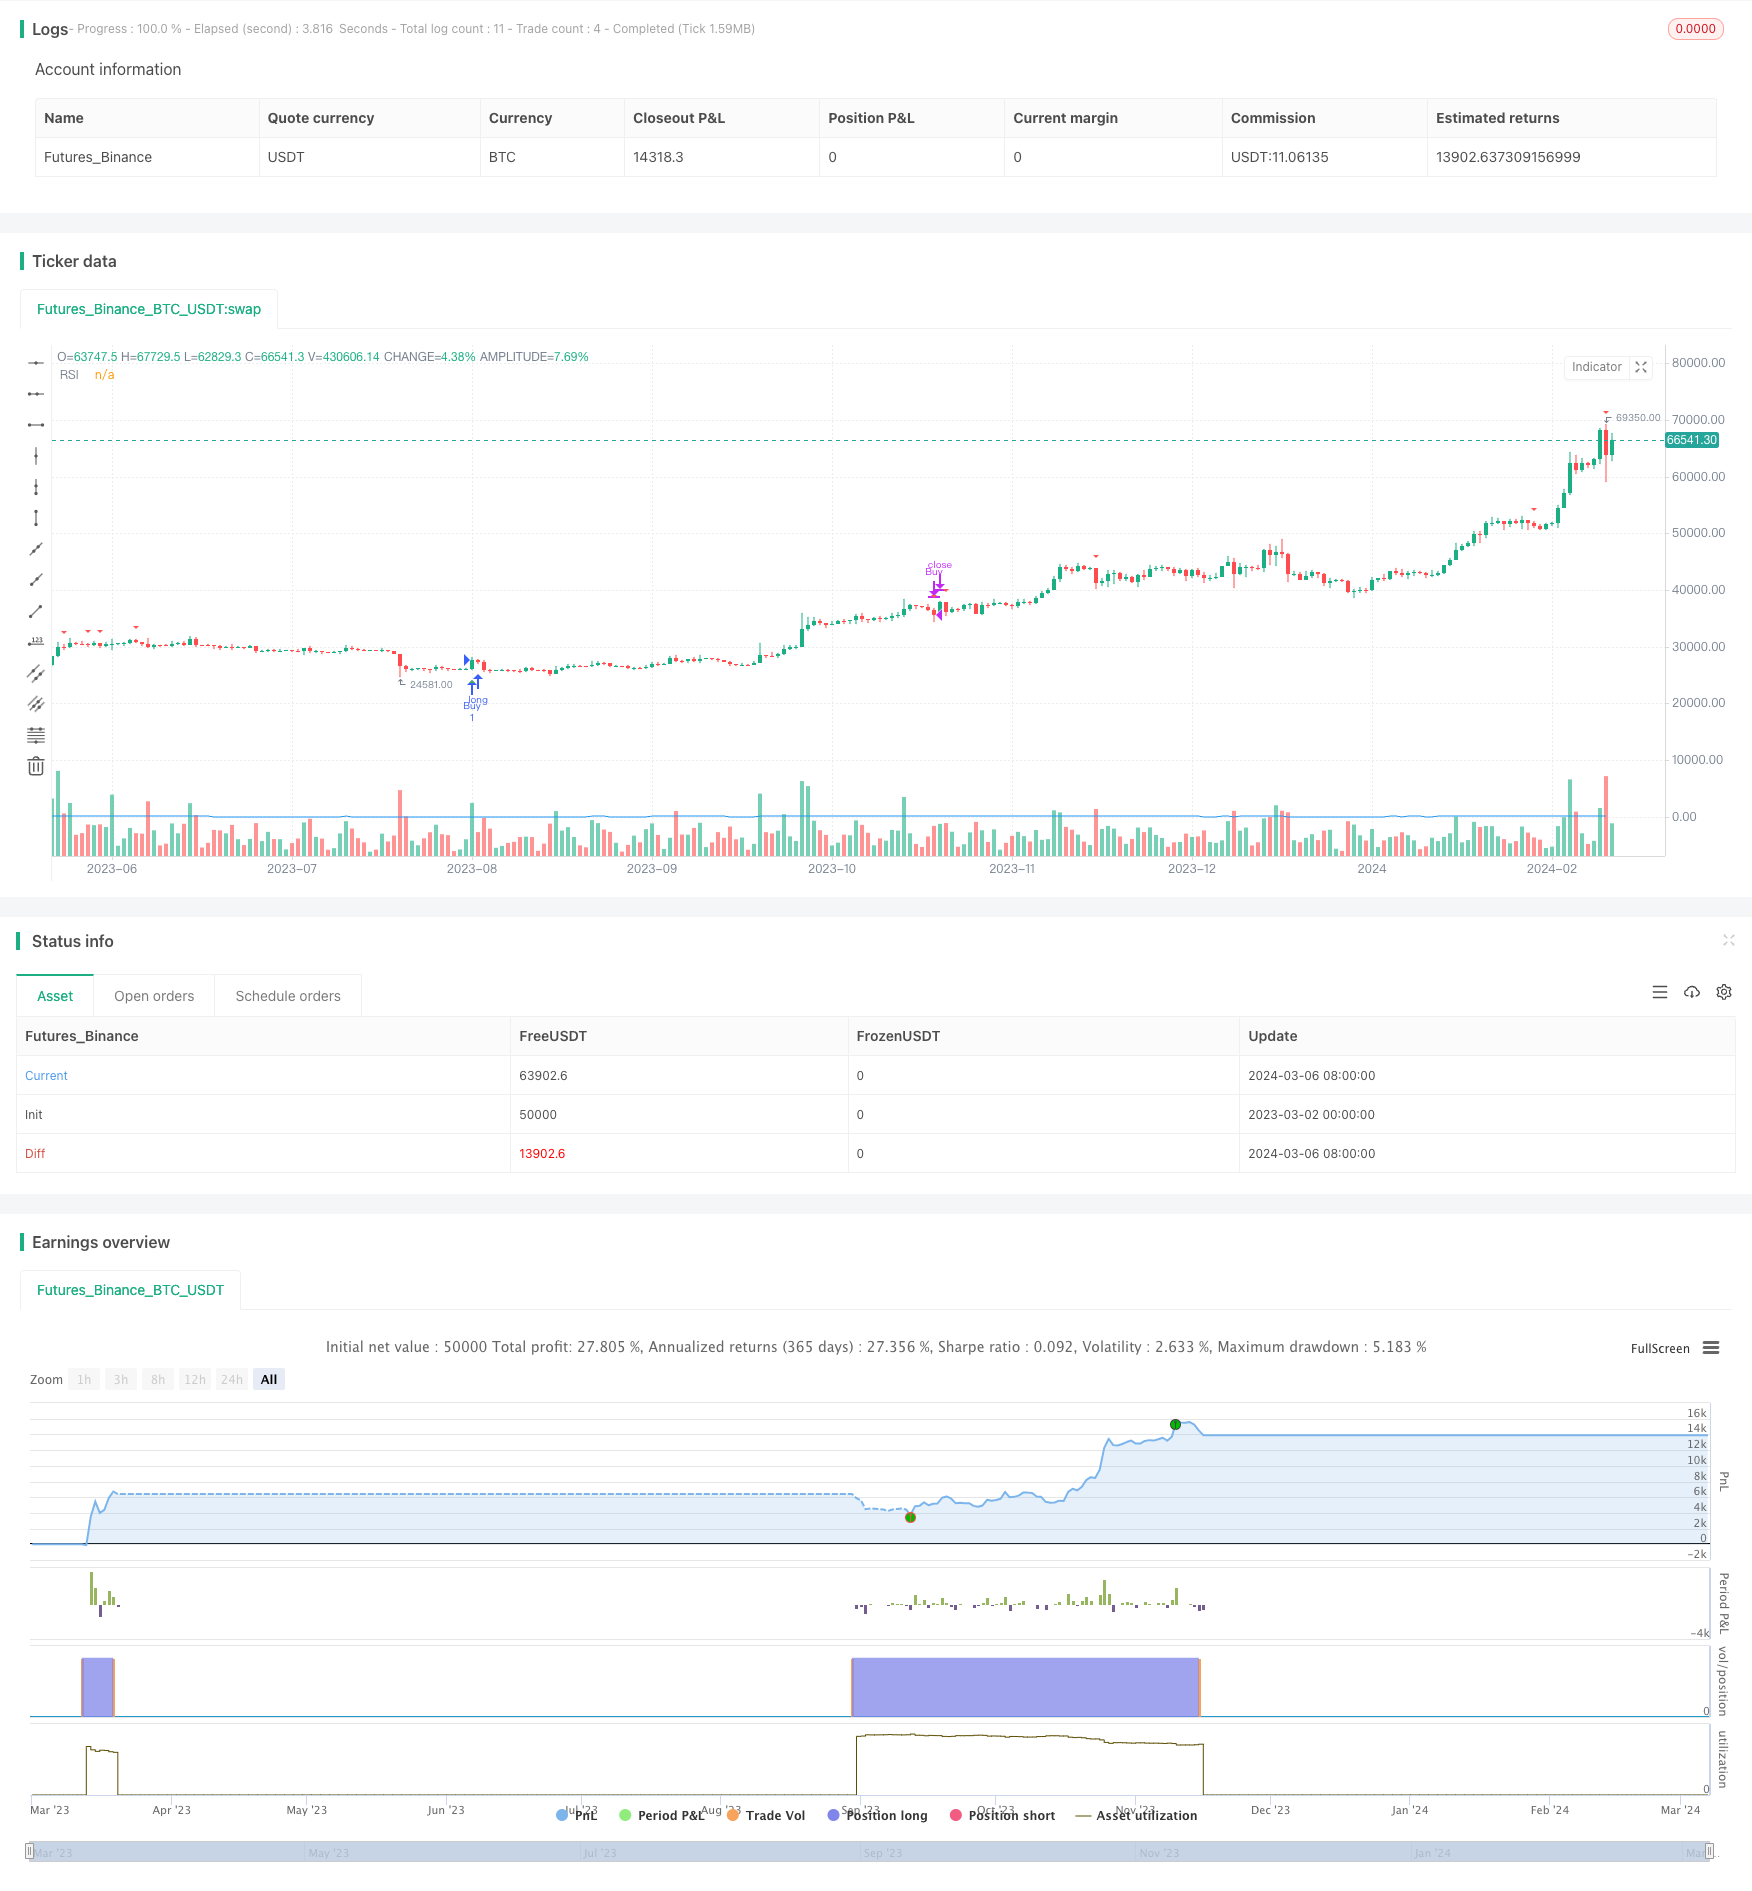
Overview
This strategy designs a dual trading strategy based on the Relative Strength Index (RSI). By comparing the RSI indicator with preset buying and selling thresholds, the strategy buys when the RSI indicator is oversold and sells when it is overbought, thereby capturing market volatility opportunities.
Strategy Principle
The Relative Strength Index (RSI) is a technical indicator that measures overbought and oversold conditions in the market. This indicator judges the overbought and oversold state of the market by comparing the average increase on up days and the average decrease on down days over a period of time.
The core of this strategy is to generate trading signals by comparing the RSI indicator with preset buying thresholds (default is 30) and selling thresholds (default is 70). When the RSI indicator breaks above the buying threshold from below, the strategy generates a buy signal; when the RSI indicator breaks below the selling threshold from above, the strategy generates a sell signal.
In this way, the strategy attempts to buy when the market is oversold and sell when it is overbought, thereby capturing trading opportunities brought about by market fluctuations. At the same time, since the RSI indicator has a certain adaptability to both trending and oscillating markets, this strategy has a certain applicability in different market environments.
Advantage Analysis
Simple and easy to use: This strategy only uses one technical indicator, and the strategy logic is clear and easy to understand, suitable for novice QuantConnect users to learn and use.
Strong adaptability: The RSI indicator has a certain adaptability to both trending and oscillating markets, so this strategy has a certain applicability in different market environments.
Flexible parameters: The buying and selling thresholds of the strategy can be flexibly adjusted according to the user's risk preference and market characteristics to optimize the strategy performance.
Risk Analysis
Oscillating market risk: In an oscillating market, prices fluctuate back and forth between the buying and selling thresholds, which may generate frequent trading signals, leading to increased transaction costs and reduced strategy returns.
Trending market risk: In a unilateral trending market, the RSI indicator may be in the overbought or oversold range for a long time, causing the strategy to miss investment opportunities brought by trending markets.
Parameter optimization risk: The performance of the strategy is relatively sensitive to the setting of buying and selling thresholds, and inappropriate parameter settings may lead to poor strategy performance.
Optimization Direction
Combine with other technical indicators: We can consider combining the RSI indicator with other trend or volatility indicators to improve the stability and reliability of the strategy. For example, moving averages can be used to confirm the validity of RSI signals.
Optimize exit mechanism: The current strategy's exit mechanism is relatively simple. We can consider introducing stop-loss, target stop-profit and other exit mechanisms to reduce the risk exposure of a single transaction and improve strategy returns.
Parameter optimization: Sample data can be used to optimize strategy parameters (such as RSI calculation period, buying and selling thresholds, etc.) to improve the out-of-sample performance of the strategy.
Summary
This strategy designs a simple and easy-to-use dual trading strategy based on the RSI indicator. By comparing the RSI indicator with preset buying and selling thresholds, the strategy can generate trading signals when the market is overbought and oversold to capture trading opportunities brought by market fluctuations. Although the strategy logic is simple and clear, suitable for novice users to learn, there are still some risks in practical applications, such as oscillating market risk, trending market risk, and parameter optimization risk. To further improve strategy performance, we can consider improving and optimizing the strategy from aspects such as combining other technical indicators, optimizing exit mechanisms, and parameter optimization. In general, this strategy provides QuantConnect users with a dual trading strategy template based on the RSI indicator, which users can optimize and improve based on their own needs and experience.
Parameters
| Name | Default | What it controls |
|---|---|---|
| v_input_1 | 14 | RSI Length |
| v_input_2 | 30 | RSI Buy Level |
| v_input_3 | 70 | RSI Sell Level |
Source Pine Script
/*backtest
start: 2023-03-02 00:00:00
end: 2024-03-07 00:00:00
period: 1d
basePeriod: 1h
exchanges: [{"eid":"Futures_Binance","currency":"BTC_USDT"}]
*/

//@version=4
strategy("RSI Strategy", shorttitle="RSI Strategy", overlay=true)

// Inputs
rsi_length = input(14, title="RSI Length")
rsi_buy_level = input(30, title="RSI Buy Level")
rsi_sell_level = input(70, title="RSI Sell Level")
tf = "1"

// RSI calculation
rsi_value = rsi(close, rsi_length)

// Plotting RSI
plot(rsi_value, color=color.blue, title="RSI")

// Buy and sell conditions
buy_condition = crossover(rsi_value, rsi_buy_level)
sell_condition = crossunder(rsi_value, rsi_sell_level)

// Plot buy and sell signals
plotshape(series=buy_condition, title="Buy Signal", location=location.belowbar, color=color.green, style=shape.triangleup, size=size.small)
plotshape(series=sell_condition, title="Sell Signal", location=location.abovebar, color=color.red, style=shape.triangledown, size=size.small)

// Execution
strategy.entry("Buy", strategy.long, when=buy_condition)
strategy.close("Buy", when=sell_condition)
Published by ChaoZhang on the FMZ strategy square · last modified 2024-03-08. Collected in the Quant Trading Vault. Unvalidated research: re-test with your own data and costs before trusting it.
Build this with AgenKit
A spec is not a trading system. Paste this into your coding agent and AgenKit runs a specialist team — architecture, test-first build, risk gates, review — with paper trading on by default.
/agenkit build a production-grade trading bot with a backtest engine, risk controls and paper trading by default from strategies/RSI-based-Dual-Trading-Strategy.md- npx agenkit install engineering-kit in your project
- Paste the command into your agent and approve each phase
- Get tests, backtest, risk controls and a paper-trading switch
Understand it first
Before you run this, read the lesson behind the idea and how to backtest it honestly. Specs like this one are the survivors of an unknown number of trials; deflate their results accordingly.
Related specs
- ATR and EMA based Dynamic Take Profit and Stop Loss Adaptive StrategyPine Script · Mean reversion · 1h
- Adaptive Mean Reversion Trading Strategy Based on Chande Momentum OscillatorPine Script · Mean reversion · 1d
- Adaptive RSI Oscillator Dynamic Trading Strategy with Threshold OptimizationPine Script · Mean reversion · 1d
- Advanced 15 Minute Chart Trading Signal StrategyPine Script · Mean reversion · 3h
- Advanced Fibonacci Retracement Trend Following and Reversal Trading StrategyPine Script · Mean reversion · 3h
- Advanced Momentum EMA Trend Following with RSI Overbought Oversold Trading StrategyPine Script · Mean reversion · 1d