Strategy vault / Mean reversion
RSI Bollinger Bands Trading Strategy
This strategy mainly uses the Relative Strength Index (RSI) combined with Bollinger Bands for trading signal judgment. Specifically, it goes long when the RSI crosses above the oversold level and below the lower…
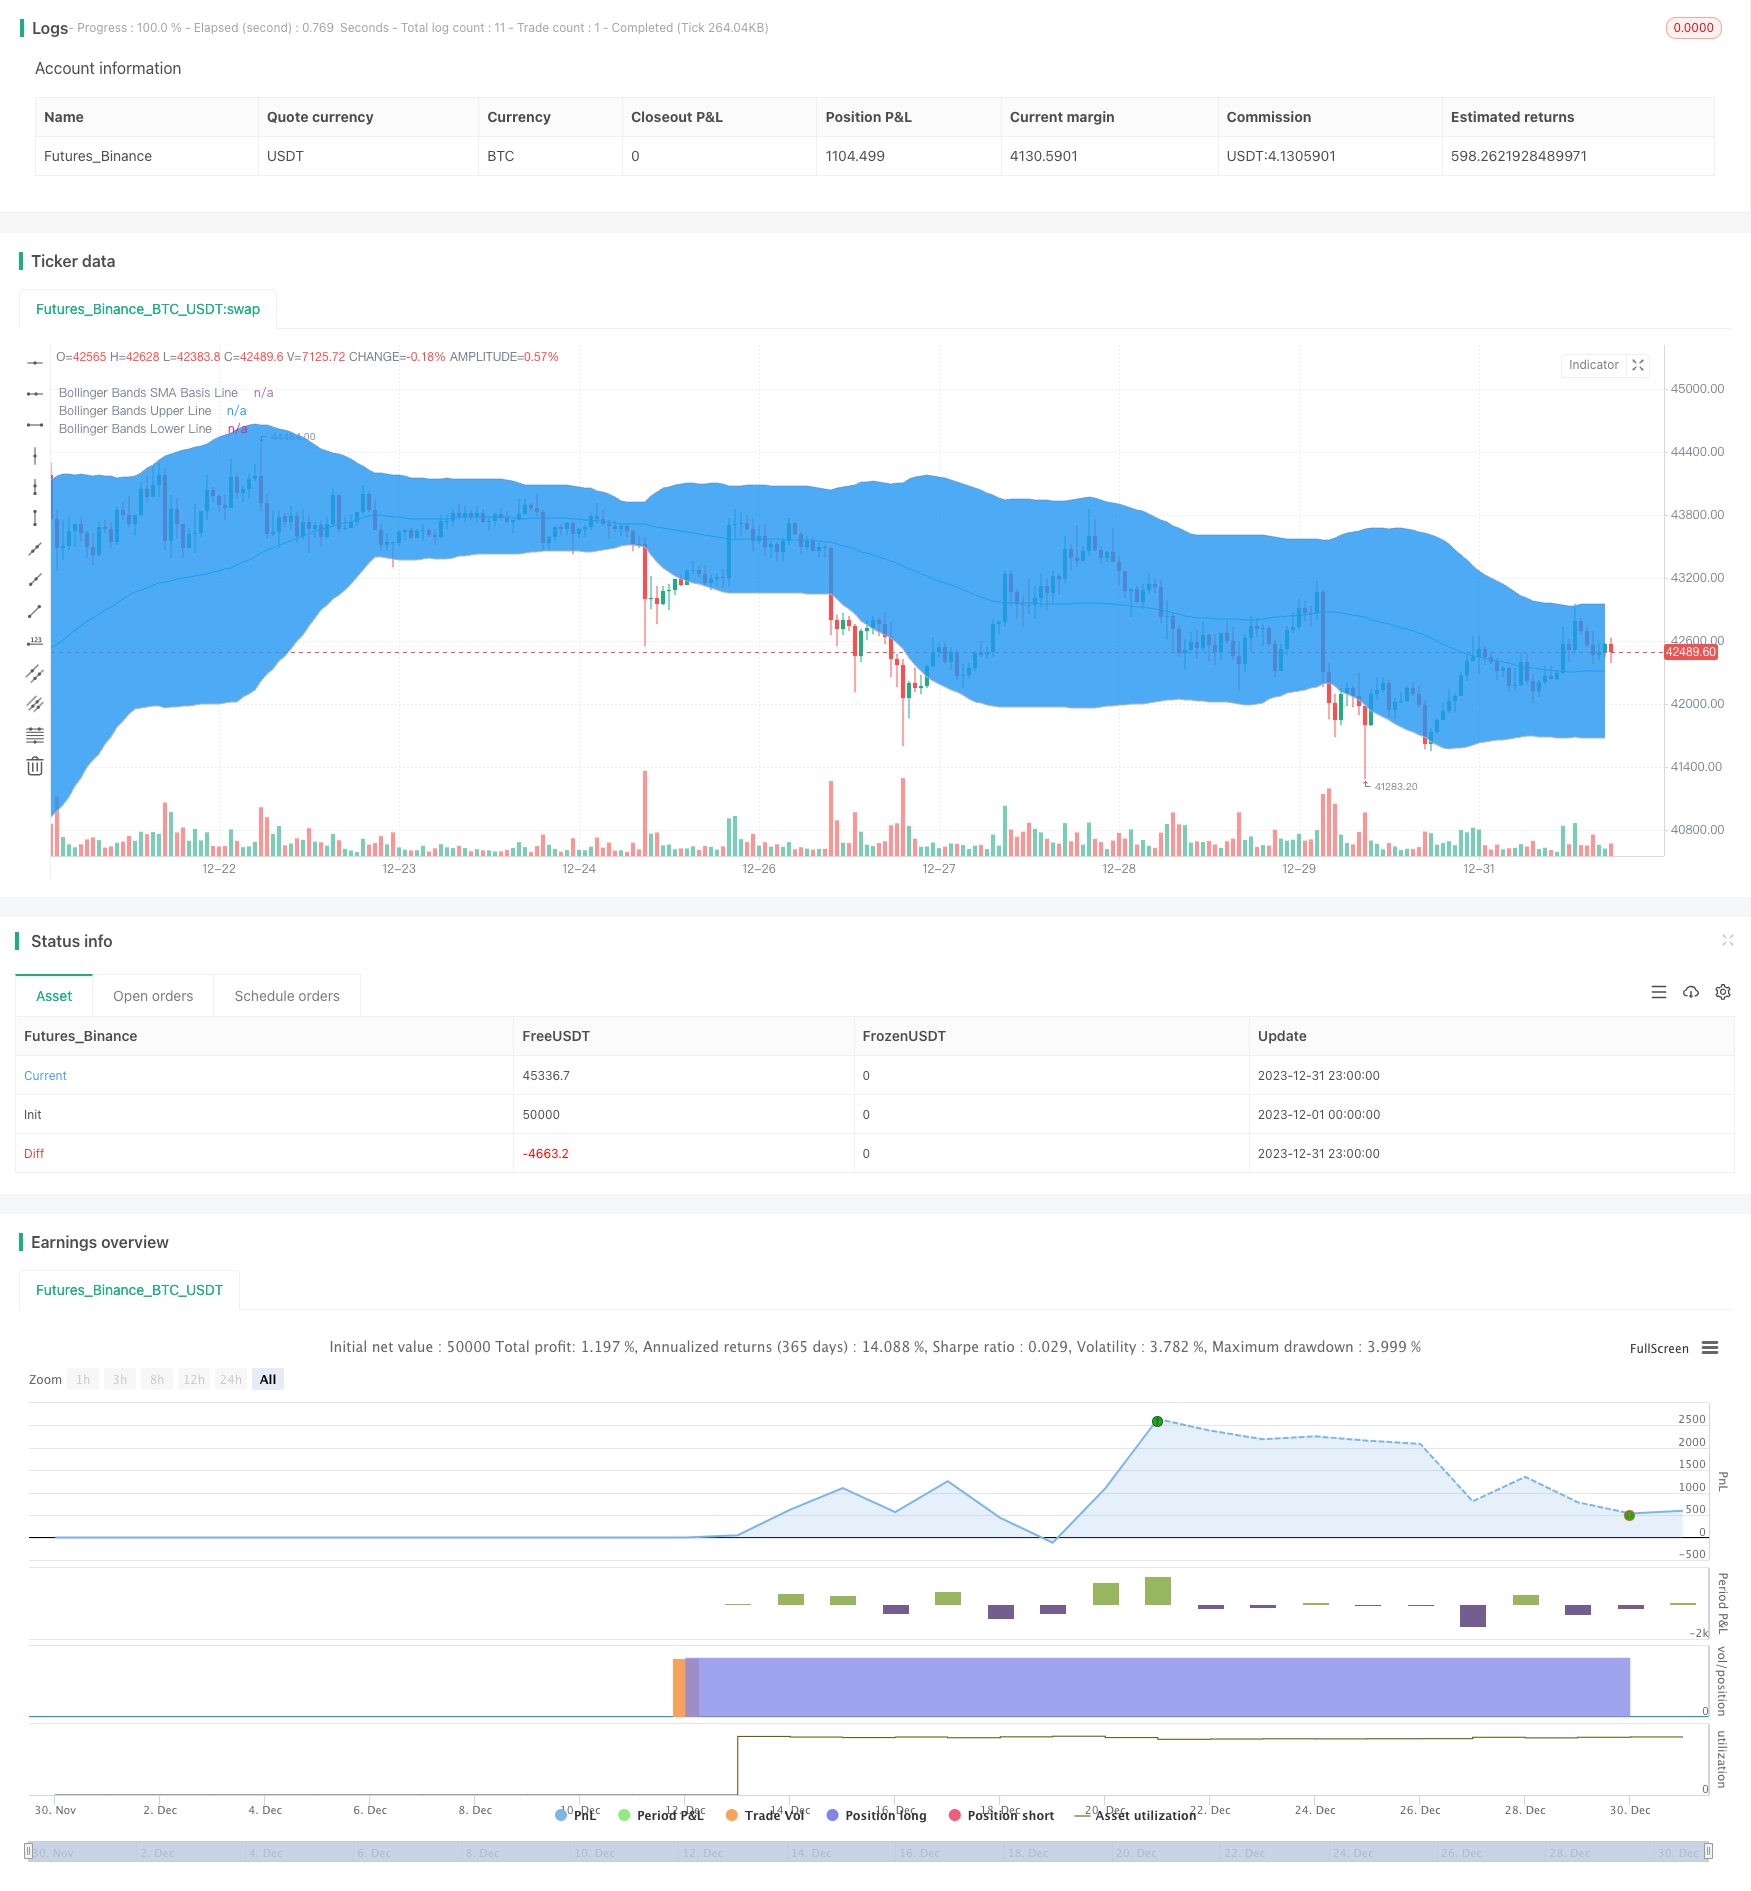
Overview
This strategy mainly uses the Relative Strength Index (RSI) combined with Bollinger Bands for trading signal judgment. Specifically, it goes long when the RSI crosses above the oversold level and below the lower Bollinger Band, and goes short when the RSI crosses below the overbought level and above the upper Bollinger Band.
Strategy Logic
The strategy first calculates the RSI indicator and Bollinger Bands. The RSI indicator reflects the relative strength of the trading instrument. When the RSI is below the oversold zone (default 30), it means the instrument is oversold and should buy. Bollinger Bands include upper band, middle band and lower band, which reflects well the fluctuation range of prices. Buying near the lower band and selling near the upper band can provide relatively reliable signals. This strategy combines the RSI indicator and Bollinger Bands for trading signal judgment. It generates buy signal when the RSI rises from the oversold zone to above it (default 30), and price rises from below the lower band to above it; it generates sell signal when the RSI falls from the overbought zone to below it (default 70), and price falls from above the upper band to below it.
Advantages
- Combining RSI and Bollinger Bands improves signal accuracy
- RSI filters out some noise
- Bollinger Bands reflect current market volatility range, reliable signals
- Strict trading rules, avoids invalid trades
Risks
- Improper Bollinger Bands parameters may cause inaccurate signals
- Inappropriate RSI overbought/oversold zone setup may impact judgements
- Strategy is strict, may miss some opportunities
Solutions:
- Optimize Bollinger Bands and RSI parameters to find best combination
- Relax conditions moderately, allow some invalid trades for more chances
Optimization Directions
- Test and optimize RSI and Bollinger parameters for optimum
- Add stop loss to control risks
- Consider adding other indicators like MACD for signal verification
- Test optimization results across different products and timeframes
Summary
The overall strategy is robust, effectively combines RSI and Bollinger Bands for stop loss. Further improvement can be achieved by testing and optimizing parameters. Also need to be aware of potential signal missing risks due to strict rules. In general, this is a reliable quantitative trading strategy.
Parameters
| Name | Default | What it controls |
|---|---|---|
| v_input_1 | 2019 | Start Year |
| v_input_2 | 4 | Start Month |
| v_input_3 | true | Start Day |
| v_input_4 | false | Start Hour |
| v_input_5 | false | Start Minute |
| v_input_6 | 9 | RSI Period Length |
| v_input_7 | 30 | RSIL |
| v_input_8 | 69 | RSIh |
| v_input_9 | 60 | Bollinger Period Length |
| v_input_10 | 2 | Bb |
| v_input_11 | true | Enable Bar Color? |
| v_input_12 | true | Enable Background Color? |
Source Pine Script
/*backtest
start: 2023-12-01 00:00:00
end: 2023-12-31 23:59:59
period: 1h
basePeriod: 15m
exchanges: [{"eid":"Futures_Binance","currency":"BTC_USDT"}]
*/

//@version=2
strategy("BB + RSI 20MIN,", shorttitle="BBRSI 20MIN", overlay=true )

     // Strategy Tester Start Time
sYear = input(2019, title = "Start Year")
sMonth = input(04, title = "Start Month", minval = 01, maxval = 12)
sDay = input(01, title = "Start Day", minval = 01, maxval = 31)
sHour = input(00, title = "Start Hour", minval = 00, maxval = 23)
sMinute = input(00, title = "Start Minute", minval = 00, maxval = 59)
startTime = true


///////////// RSI
RSIlength = input(9,title="RSI Period Length")
RSIoverSold = input(30, minval=1,title="RSIL")
RSIoverBought = input(69, minval=1,title="RSIh")
price = open
vrsi = rsi(price, RSIlength)


///////////// Bollinger Bands
BBlength = input(60, minval=1,title="Bollinger Period Length")
BBmult = input(2.0, minval=0.001, maxval=50,title="Bb")
BBbasis = sma(price, BBlength)
BBdev = BBmult * stdev(price, BBlength)
BBupper = BBbasis + BBdev
BBlower = BBbasis - BBdev
source = close
buyEntry = crossover(source, BBlower)
sellEntry = crossunder(source, BBupper)
plot(BBbasis, color=aqua,title="Bollinger Bands SMA Basis Line")
p1 = plot(BBupper, color=silver,title="Bollinger Bands Upper Line")
p2 = plot(BBlower, color=silver,title="Bollinger Bands Lower Line")
fill(p1, p2)


///////////// Colors
switch1=input(true, title="Enable Bar Color?")
switch2=input(true, title="Enable Background Color?")
TrendColor = RSIoverBought and (price[1] > BBupper and price < BBupper) and BBbasis < BBbasis[1] ? red : RSIoverSold and (price[1] < BBlower and price > BBlower) and BBbasis > BBbasis[1] ? green : na
barcolor(switch1?TrendColor:na)
bgcolor(switch2?TrendColor:na,transp=50)


///////////// RSI + Bollinger Bands Strategy
if (not na(vrsi))

    if (crossover(vrsi, RSIoverSold) and crossover(source, BBlower))
        strategy.entry("RSI_BB_L", strategy.long and startTime, stop=BBlower,  comment="RSI_BB_L")
    else
        strategy.cancel(id="RSI_BB_L")

    if (crossunder(vrsi, RSIoverBought) and crossunder(source, BBupper))
        strategy.entry("RSI_BB_S", strategy.short and startTime, stop=BBupper,comment="RSI_BB_S")
    else
        strategy.cancel(id="RSI_BB_S")

//plot(strategy.equity, title="equity", color=red, linewidth=2, style=areabr)Published by ChaoZhang on the FMZ strategy square · last modified 2024-01-24. Collected in the Quant Trading Vault. Unvalidated research: re-test with your own data and costs before trusting it.
Build this with AgenKit
A spec is not a trading system. Paste this into your coding agent and AgenKit runs a specialist team — architecture, test-first build, risk gates, review — with paper trading on by default.
/agenkit build a production-grade trading bot with a backtest engine, risk controls and paper trading by default from strategies/RSI-Bollinger-Bands-Trading-Strategy.md- npx agenkit install engineering-kit in your project
- Paste the command into your agent and approve each phase
- Get tests, backtest, risk controls and a paper-trading switch
Understand it first
Before you run this, read the lesson behind the idea and how to backtest it honestly. Specs like this one are the survivors of an unknown number of trials; deflate their results accordingly.
Related specs
- Advanced 15 Minute Chart Trading Signal StrategyPine Script · Mean reversion · 3h
- CCTBBO Reversal Tracking StrategyPine Script · Mean reversion · 45m
- Multi Timeframe Gold Reversal Tracking StrategyPine Script · Mean reversion · 2h
- Price Volatility Mean Reversion StrategyPine Script · Mean reversion · 2d
- Reversal Bollinger Band RSI MACD Quant StrategyPine Script · Mean reversion · 4h
- Bollinger Bands and VWAP based Quantitative Trading StrategyPine Script · Mean reversion · 1h