Strategy vault / Mean reversion
RSI Cross Cycle Trading Strategy
This strategy utilizes the overbought and oversold principles of the RSI indicator and combines multi-cycle RSI to generate signals, realizing cross-cycle operations. The strategy judges overbought and oversold…
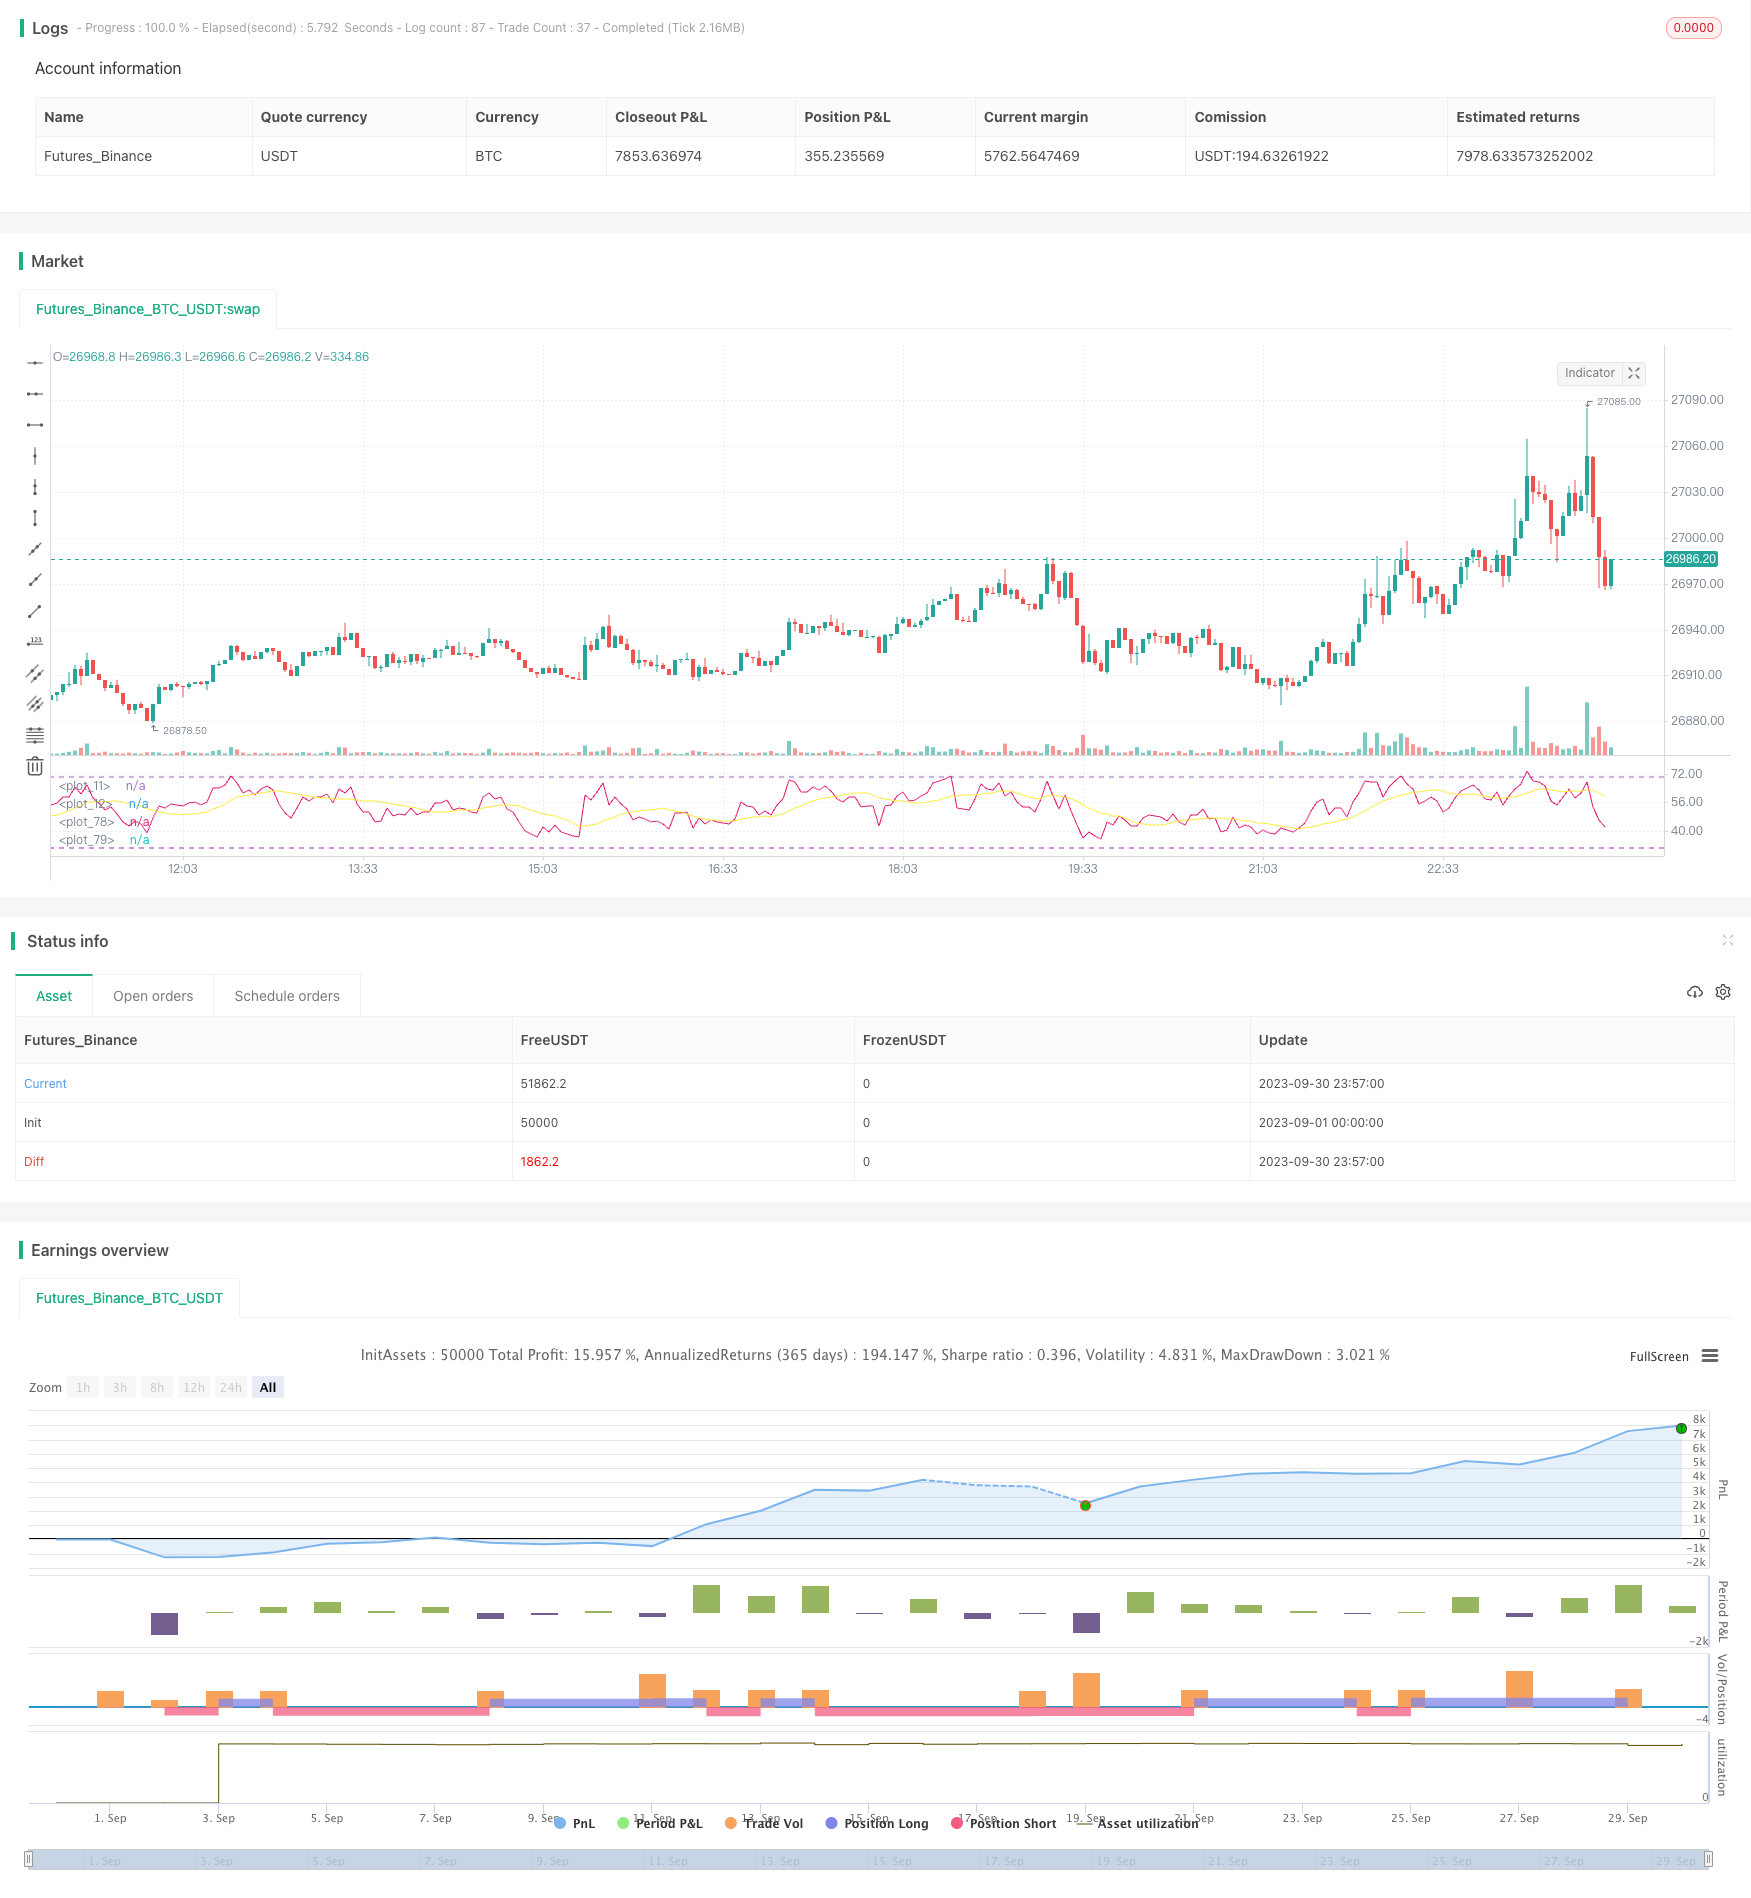
Overview
This strategy utilizes the overbought and oversold principles of the RSI indicator and combines multi-cycle RSI to generate signals, realizing cross-cycle operations. The strategy judges overbought and oversold signals according to the cycle settings of RSI, and uses the moving average of RSI for filtering to avoid wrong signals. It generates a buy signal when RSI crosses over its moving average and a sell signal when crossing below, forming a typical moving average crossover operating mode.
Strategy Logic
The strategy mainly generates trading signals through the overbought and oversold judgments of the RSI indicator. RSI stands for Relative Strength Index, its formula is: RSI = 100 - (100 / (1 + RS)), where RS is the ratio of average closing gains over average closing losses over a period. The RSI index ranges from 0 to 100, generally regarded as oversold below 30 and overbought above 70.
The strategy sets a high parameter sobrecompra and a low parameter sobreventa. When RSI is higher than sobrecompra, it is judged as overbought. When RSI is lower than sobreventa, it is judged as oversold. The default values of sobrecompra and sobreventa in the strategy are 70 and 30 respectively.
To generate buy and sell signals, the strategy uses the moving average line of the RSI indicator for filtering. When RSI crosses over its moving average line, the buy signal Es_compra is generated. When RSI crosses below its moving average line, the sell signal Es_venta is generated. The moving average parameter periodos_media defaults to 14 periods.
After generating buy and sell signals, the strategy opens positions for long or short trading. In addition, the strategy also sets stop loss and take profit in percentage to prevent excessive losses and lock in profits.
Advantages of the Strategy
Use RSI indicator to judge overbought and oversold conditions, avoiding chasing highs and selling lows.
Apply the moving average of RSI indicator for filtering to avoid false signals.
Combine multi-cycle settings of RSI indicator to generate more stable trading signals.
Set stop loss and take profit mechanisms to effectively control risks.
The strategy logic is simple and clear, easy to understand and modify.
Customizable parameters, adaptable to different products and cycles.
Risks of the Strategy
RSI indicator has lagging effect, may miss the best timing for price reversal.
Moving average causes trading signal delays, unable to capture trend reversals in time.
Fixed overbought and oversold parameter settings are not flexible enough, need adjustments for different cycles and products.
Improper stop loss and take profit settings may lead to losses or missed profits.
Long and short positions are only 1 lot, unable to fully utilize funds for spread trading.
Optimization Directions
Combine other indicators such as MACD, KD for trading signal judgment.
Apply adaptive moving average to track trends.
Set dynamic overbought and oversold parameters, adjust based on market volatility.
Optimize stop loss and take profit algorithms, such as trailing stop loss.
Add position management mechanism, dynamically adjust positions based on capital size.
Add trend filtering to avoid frequent trading in range-bound markets.
Backtest to optimize parameters and select the optimal parameter combination.
Summary
This strategy is based on the overbought and oversold principles of RSI indicator, uses moving average for filtering to generate trading signals, realizing typical cross-cycle trading. The strategy has clear logical structure and parameter settings, adaptable to different products and cycles through parameter tuning, making it a reliable and effective cross-cycle trading strategy. But limitations also exist in tools like RSI and moving average, requiring further optimizations to make strategy parameters more adaptive, filtering effects better, and risk lowered and profit increased to the maximum extent.
Parameters
| Name | Default | What it controls |
|---|---|---|
| v_input_1 | timestamp(01 Nov 2020 13:30 +0000) | Start Date Filter |
| v_input_2 | timestamp(1 Nov 2022 19:30 +0000) | End Date Filter |
| v_input_3 | 70 | Sobre Compra |
| v_input_4 | 30 | Sobre Venta |
| v_input_5 | 14 | Periodos |
| v_input_6 | 14 | Logintud media movil |
| v_input_7 | 2 | SL % |
| v_input_8 | 5 | TP % |
Source Pine Script
/*backtest
start: 2023-09-01 00:00:00
end: 2023-09-30 23:59:59
period: 3m
basePeriod: 1m
exchanges: [{"eid":"Futures_Binance","currency":"BTC_USDT"}]
*/

// This source code is subject to the terms of the Mozilla Public License 2.0 at https://mozilla.org/MPL/2.0/
// © samuelkanneman

//@version=4
strategy("RSI KANNEMAN")
//////Entrada///////
i_startTime         = input(title="Start Date Filter", defval=timestamp("01 Nov 2020 13:30 +0000"), type=input.time, tooltip="Date & time to begin trading from")
i_endTime           = input(title="End Date Filter", defval=timestamp("1 Nov 2022 19:30 +0000"), type=input.time, tooltip="Date & time to stop trading")
sobrecompra= input(70, title="Sobre Compra", type=input.integer ,minval=50, maxval=100 )
sobreventa= input(30, title="Sobre Venta", type=input.integer ,minval=0, maxval=50 )
l1=hline(sobrecompra)
l2=hline(sobreventa, color=color.purple)
periodos= input(14, title="Periodos", type=input.integer ,minval=1, maxval=50 )
periodos_media= input(14, title="Logintud media movil", type=input.integer ,minval=1, maxval=200 )
var SL =0.0
var TP=0.0
StopLoss = input(2.0, title="SL %", step=0.2)
TakeProfit = input(5.0, title="TP %", step=0.2)

//////Proceso///////

mi_rsi=rsi(close,periodos)
mm_rsi=sma(mi_rsi,periodos_media)

Es_compra= crossover(mm_rsi,sobreventa)
Es_venta= crossunder(mm_rsi,sobrecompra)

comprado= strategy.position_size > 0
vendido = strategy.position_size < 0

//time to test
dateFilter = true
//timePeriod = time >= timestamp(syminfo.timezone, 2020, 11, 1, 0, 0)


// long

if (not comprado and Es_compra and dateFilter  )
    // realizar long
    cantidad = strategy.equity/hlc3
    strategy.entry ("compra", strategy.long , cantidad)
    SL := close*(1-(StopLoss/100))
    TP := close*(1+(TakeProfit/100))

if close >= TP
    strategy.close ("compra" , comment="Salto TP")

if (comprado and Es_venta  )
    strategy.close ("compra" , comment="Sobre Venta")

if close <= SL
    strategy.close ("compra" , comment="Salto SL")

// short

if (not vendido and Es_venta and dateFilter  )
    // realizar short
    cantidad = strategy.equity/hlc3
    strategy.entry ("venta", strategy.short , cantidad)
    SL := close*(1+(StopLoss/100))
    TP := close*(1-(TakeProfit/100))

if close <= TP
    strategy.close ("venta" , comment="Salto TP")

if (vendido and Es_compra  )
    strategy.close ("venta" , comment="Sobre Compra")

if close >= SL
    strategy.close ("venta" , comment="Salto SL")


   ///////Salida//////
fill(l1,l2)
plot(mi_rsi)
plot(mm_rsi, color=color.yellow)

bgcolor(Es_compra ? color.blue : na , transp=0)
bgcolor(Es_venta ? color.red : na , transp=0)


// 1d 70 22 5 4 3 15    6 meses
//1h 70 20 6 4 5 7      1 mese
//15m 70 20 5 4 4 7      1 semana
Published by ChaoZhang on the FMZ strategy square · last modified 2023-10-25. Collected in the Quant Trading Vault. Unvalidated research: re-test with your own data and costs before trusting it.
Build this with AgenKit
A spec is not a trading system. Paste this into your coding agent and AgenKit runs a specialist team — architecture, test-first build, risk gates, review — with paper trading on by default.
/agenkit build a production-grade trading bot with a backtest engine, risk controls and paper trading by default from strategies/RSI-Cross-Cycle-Trading-Strategy.md- npx agenkit install engineering-kit in your project
- Paste the command into your agent and approve each phase
- Get tests, backtest, risk controls and a paper-trading switch
Understand it first
Before you run this, read the lesson behind the idea and how to backtest it honestly. Specs like this one are the survivors of an unknown number of trials; deflate their results accordingly.
Related specs
- Adaptive Mean Reversion Trading Strategy Based on Chande Momentum OscillatorPine Script · Mean reversion · 1d
- Advanced 15 Minute Chart Trading Signal StrategyPine Script · Mean reversion · 3h
- Advanced Momentum EMA Trend Following with RSI Overbought Oversold Trading StrategyPine Script · Mean reversion · 1d
- Advanced Quantitative Trading Strategy Combining RSI Divergence and Moving AveragesPine Script · Mean reversion · 1h
- Advanced Strategy with Volume and Price Pullback Multiple Take ProfitPine Script · Mean reversion · 1h
- BONK Multi Factor Trading StrategyPine Script · Mean reversion · 1d