Strategy vault / Mean reversion
RSI Daredevil Squadron Fusion Strategy
The RSI Daredevil Squadron Fusion Strategy is a fusion strategy combining the RSI indicator, Ichimoku Cloud, and 200-day moving average. It identifies bullish or bearish RSI daredevil patterns and uses the Ichimoku…
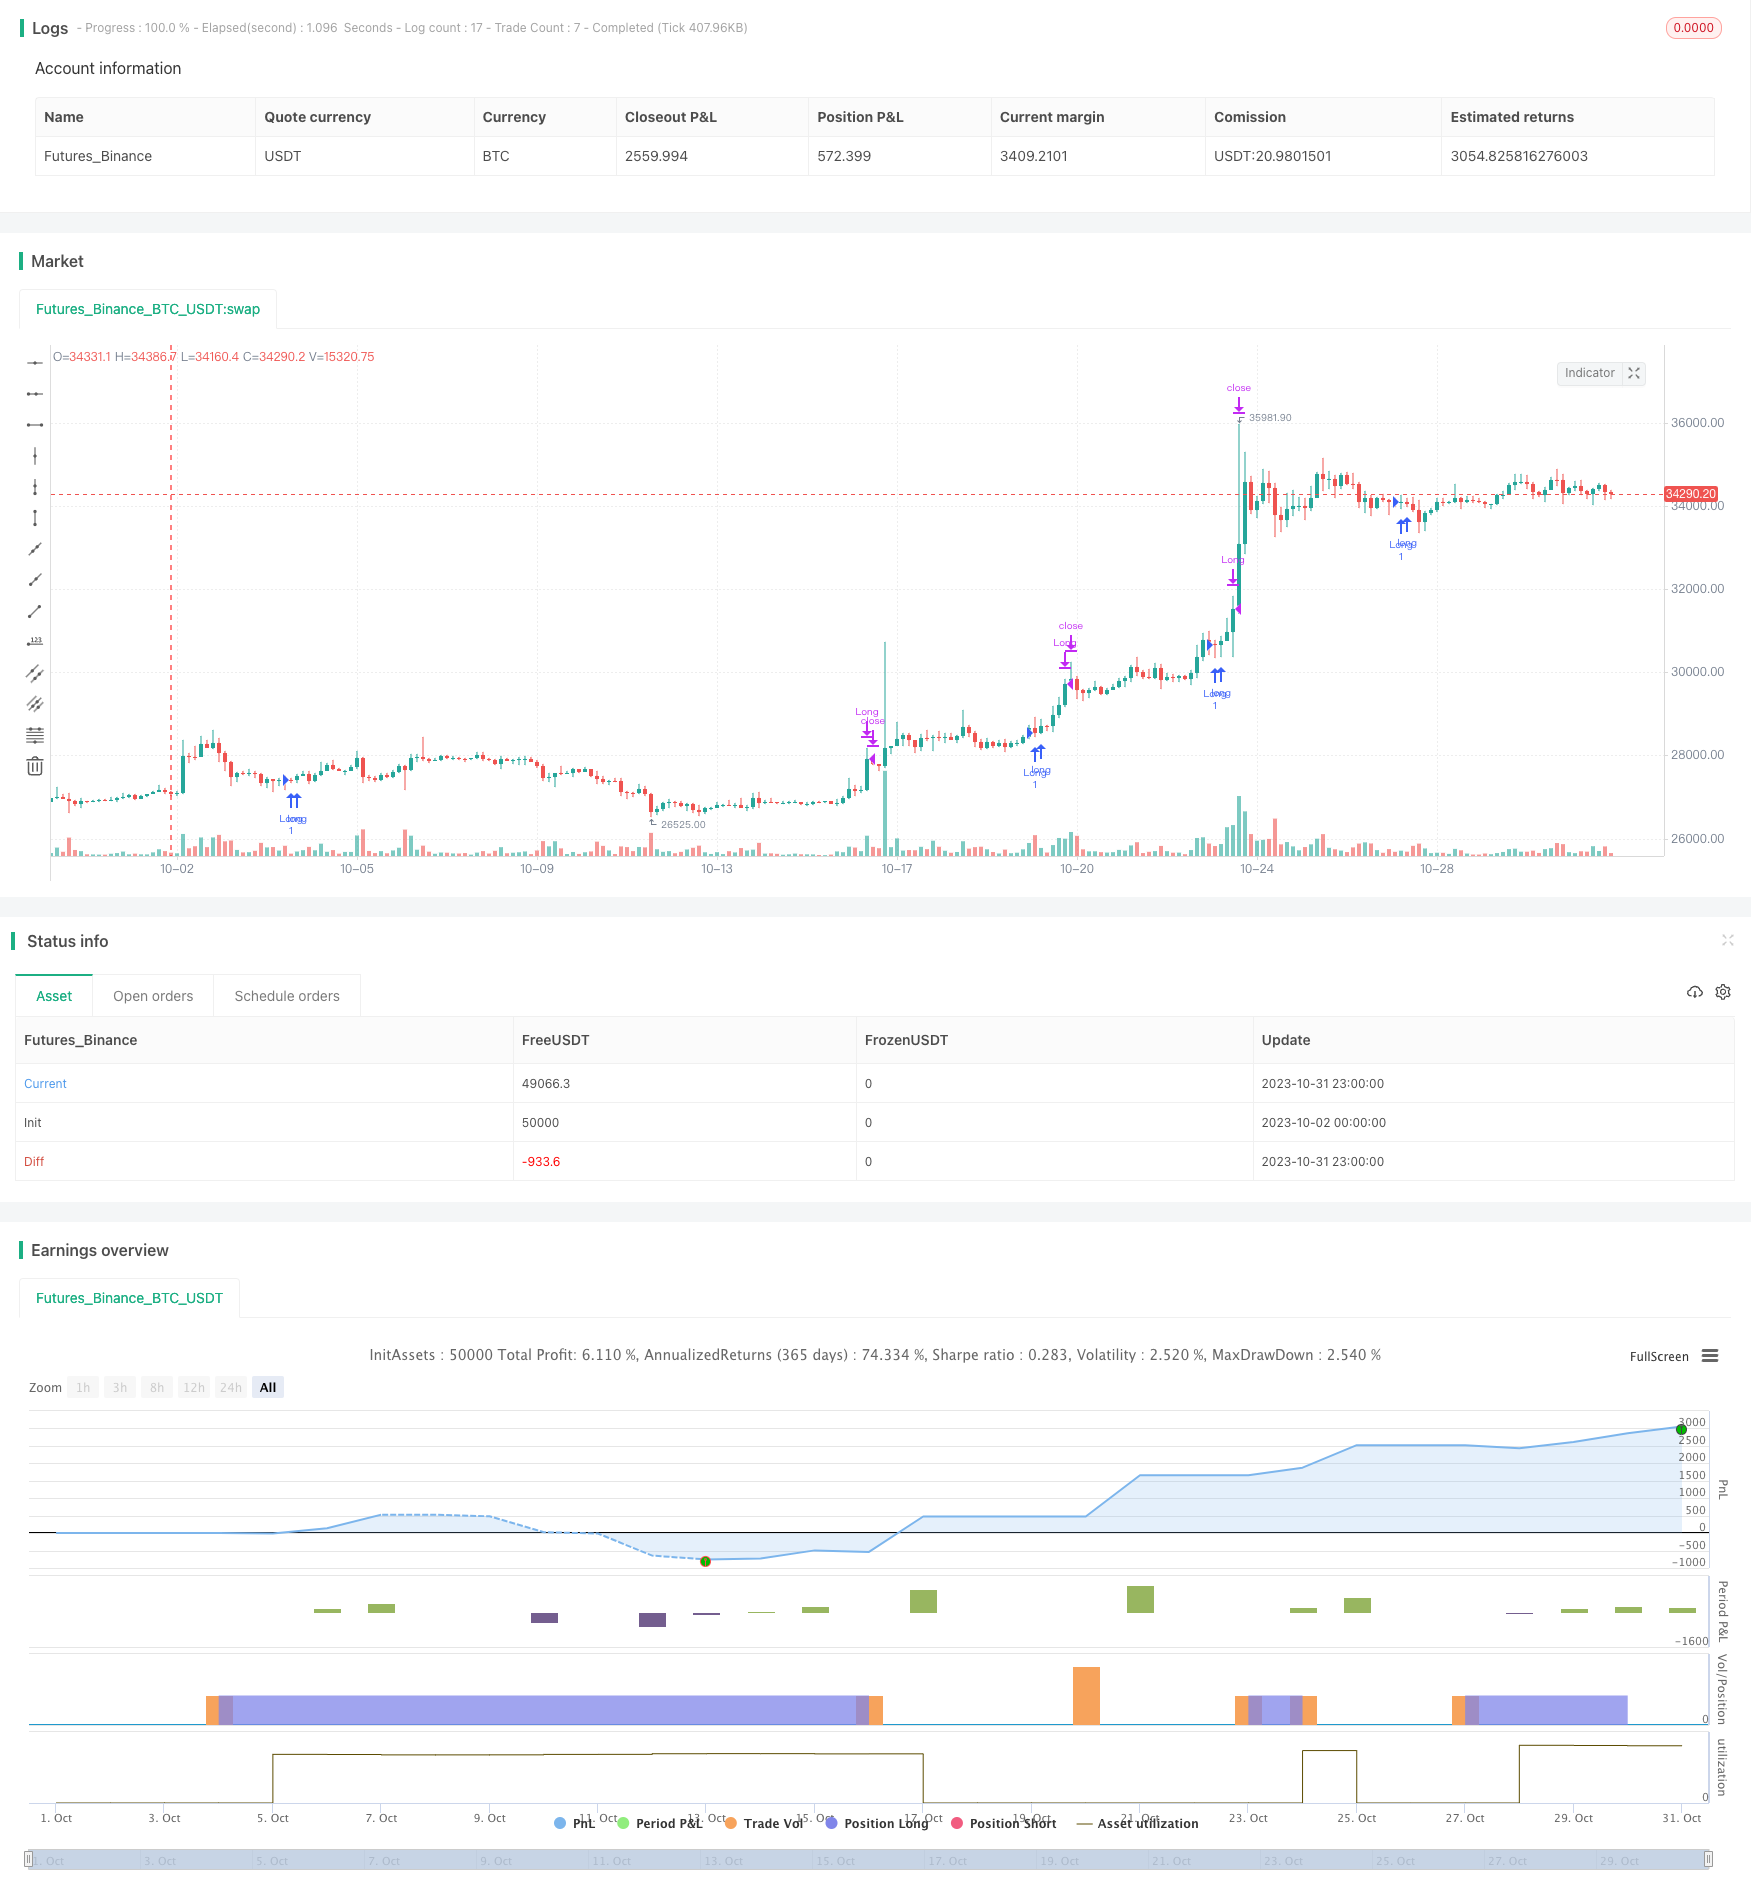
Overview
The RSI Daredevil Squadron Fusion Strategy is a fusion strategy combining the RSI indicator, Ichimoku Cloud, and 200-day moving average. It identifies bullish or bearish RSI daredevil patterns and uses the Ichimoku Cloud to determine trend direction and the 200-day MA as support/resistance for additional signal confirmation before generating trading signals.
Strategy Logic
Firstly, this strategy uses the RSI indicator to identify bullish or bearish daredevil patterns. The RSI daredevil pattern refers to a bearish pattern when price makes a new high but RSI does not, or a bullish pattern when price makes a new low but RSI does not. This pattern often implies an impending price reversal.
Secondly, the strategy uses the Ichimoku Cloud's leading line 1 and leading line 2 to determine the trend direction. An uptrend is identified when leading line 1 is above leading line 2, and a downtrend when below. The Ichimoku Cloud determines trend direction through the combination of the conversion line, base line, and lagging span, and is considered a reliable trend identification tool.
Lastly, the 200-day moving average is also introduced. The MA is often seen as an important support/resistance level. When the Ichimoku Cloud shows an uptrend and price stands above the 200-day MA, it gives a bullish signal. Conversely, when the Cloud shows a downtrend and price breaks below the 200-day MA, it gives a bearish signal.
By combining signals from multiple indicators, some false signals can be filtered out, making trade decisions more reliable. Only when the RSI shows a daredevil pattern, the Ichimoku Cloud confirms the trend direction, and the price-MA relationship meets expectations, will this strategy generate actual trading signals.
Advantages
The biggest advantage of this multi-indicator fusion strategy is filtering out false signals and improving reliability of trading decisions.
Firstly, the RSI daredevil pattern itself has some predictive power to spot potential price reversals ahead of time. But the pattern alone is insufficient to determine trade signals.
Secondly, introducing the Ichimoku Cloud provides better trend direction judgment, avoiding wrong signals in range-bound markets. The combination of leading lines is very effective for trend identification.
Lastly, the support/resistance effect of the 200-day MA also helps further confirm signal reliability. Trading signals are only generated when the Ichimoku Cloud confirms the trend and the price-MA relationship is appropriate.
In summary, by requiring consensus across indicators, this multi-indicator strategy can screen out many false signals and only generate actual signals when alignment exists. This is the biggest advantage of the strategy.
Risks
Although the multi-indicator strategy helps improve signal quality, some risks need to be noted:
Firstly, the more complex strategy may miss out on some opportunities that individual indicators could catch. Being too conservative may lead to insufficient signal generation.
Secondly, conflicts may exist between different indicators. For example, the RSI may show a daredevil pattern while the Ichimoku Cloud trend conflicts. How to balance different indicators is a challenge.
Thirdly, parameter settings also greatly impact the strategy. Inappropriate moving average periods, RSI parameters etc. may undermine strategy performance.
Lastly, there is still large room for optimization between components. Machine learning algorithms could potentially enable dynamic parameter optimization based on changing market conditions. More indicators could also be tested to find better combinations.
In general, the biggest risk is increased complexity and difficulty of optimizing a multi-indicator combination. Continuous testing and optimization across different market environments is needed for the strategy to reach its maximum potential.
Optimization Opportunities
Some optimization opportunities for this strategy include:
Test different indicator parameter settings and optimize parameters. Moving average periods, RSI parameters etc. could be evaluated to find the optimal combination.
Introduce other indicators like MACD, Bollinger Bands to enrich the multi-indicator mix and find better combinations.
Utilize machine learning algorithms to dynamically optimize parameters based on market conditions, allowing the strategy to auto adjust its settings.
Incorporate stop loss strategies to control trading risk. Consider stop losses when price breaks through support/resistance levels.
Optimize entry opportunities by reducing filtering standards for more chances, while balancing risk/reward.
Optimize code based on backtesting results to reduce resource usage and improve efficiency.
Explore more complex relationships between indicators to find stronger combined signals, but be wary of over-optimization risks.
Conclusion
The RSI Daredevil Squadron Fusion Strategy filters out noise through a multi-indicator confirmation mechanism, improving signal quality. The key advantage is multiple indicator consensus, which reduces false signals but also introduces complexity. Much room remains for future optimization, especially around parameters and indicator combinations. Overall it represents a relatively conservative and reliable trading strategy worthy of further research and exploration.
Parameters
| Name | Default | What it controls |
|---|---|---|
| v_input_1 | 14 | len |
| v_input_2_close | 0 | src: close | high | low | open | hl2 | hlc3 | hlcc4 | ohlc4 |
| v_input_3 | 5 | lbR |
| v_input_4 | 5 | lbL |
| v_input_5 | 75 | takeProfitLevellong |
| v_input_6 | 25 | takeProfitLevelshort |
| v_input_7 | 60 | rangeUpper |
| v_input_8 | 5 | rangeLower |
| v_input_9 | 9 | conversionPeriods |
| v_input_10 | 26 | basePeriods |
| v_input_11 | 52 | laggingSpan2Periods |
| v_input_12 | 26 | displacement |
Source Pine Script
/*backtest
start: 2023-10-02 00:00:00
end: 2023-11-01 00:00:00
period: 3h
basePeriod: 15m
exchanges: [{"eid":"Futures_Binance","currency":"BTC_USDT"}]
*/

// This source code is subject to the terms of the Mozilla Public License 2.0 at https://mozilla.org/MPL/2.0/
// © tradethrills

//@version=4
strategy("RSI Divergence X Ichimoku Cloud X 200EMA", overlay=true)

//RSI Indicator
len = input(defval=14, minval=1)
src = input(defval=close)
lbR = input(defval=5)
lbL = input(defval=5)
takeProfitLevellong = input(minval = 70, defval = 75)
takeProfitLevelshort = input(minval = 30, defval = 25)

rangeUpper = input(defval=60)
rangeLower = input(defval=5)

//200 EMA
ema200 = ema(close, 200)

//Ichimoku Cloud Indicator
conversionPeriods = input(9, minval=1)
basePeriods = input(26, minval=1)
laggingSpan2Periods = input(52, minval=1)
displacement = input(26, minval=1)

donchian(len) => avg(lowest(len), highest(len))

conversionLine = donchian(conversionPeriods)
baseLine = donchian(basePeriods)
leadLine1 = avg(conversionLine, baseLine)
leadLine2 = donchian(laggingSpan2Periods)

abovecloud =  max(leadLine1, leadLine2)
belowcloud = min(leadLine1, leadLine2)

//RSI Divergence Strategy

osc = rsi(src, len)
_inrange(cond) =>
    bars = barssince(cond == true)
    rangeLower <= bars and bars <= rangeUpper

pricelowfound = na(pivotlow(osc, lbL, lbR)) ? false : true
pricehighfound = na(pivothigh(osc, lbL, lbR)) ? false : true

//Regular Bullish
osc_higherlow = osc[lbR] > valuewhen(pricelowfound, osc[lbR], 1) and _inrange(pricelowfound[1])
price_lowerlow = low[lbR] < valuewhen(pricelowfound, low[lbR], 1)

bullCond = price_lowerlow and osc_higherlow and pricelowfound

//Hidden Bullish
osc_lowerlow = osc[lbR] < valuewhen(pricelowfound, osc[lbR], 1) and _inrange(pricelowfound[1])
price_higherlow = low[lbR] > valuewhen(pricelowfound, low[lbR], 1)

hiddenbullCond = price_higherlow and osc_lowerlow and pricelowfound

//Regular Bearish
osc_lowerhigh = osc[lbR] < valuewhen(pricehighfound, osc[lbR], 1) and _inrange(pricehighfound[1])
price_higherhigh = high[lbR] > valuewhen(pricehighfound, high[lbR], 1)

bearCond = price_higherhigh and osc_lowerhigh and pricehighfound

//Hidden Bearish
osc_higherhigh = osc[lbR] > valuewhen(pricehighfound, osc[lbR], 1) and _inrange(pricehighfound[1])
price_lowerhigh = high[lbR] < valuewhen(pricehighfound, high[lbR], 1)

hiddenbearCond = price_lowerhigh and osc_higherhigh and pricehighfound

//Entry and Exit
longCondition = (bullCond or hiddenbullCond) and (abovecloud > ema200)
closelongCondition = crossover(osc, takeProfitLevellong)

shortCondition = (bearCond or hiddenbearCond) and (ema200 > belowcloud)
closeshortCondition = crossover(osc, takeProfitLevelshort)

strategy.entry("Long", strategy.long,  when=longCondition)
strategy.close("Long", when=closelongCondition)

strategy.entry("Short", strategy.short,  when=shortCondition)
strategy.close("Short", when=closeshortCondition)
Published by ChaoZhang on the FMZ strategy square · last modified 2023-11-02. Collected in the Quant Trading Vault. Unvalidated research: re-test with your own data and costs before trusting it.
Build this with AgenKit
A spec is not a trading system. Paste this into your coding agent and AgenKit runs a specialist team — architecture, test-first build, risk gates, review — with paper trading on by default.
/agenkit build a production-grade trading bot with a backtest engine, risk controls and paper trading by default from strategies/RSI-Daredevil-Squadron-Fusion-Strategy.md- npx agenkit install engineering-kit in your project
- Paste the command into your agent and approve each phase
- Get tests, backtest, risk controls and a paper-trading switch
Understand it first
Before you run this, read the lesson behind the idea and how to backtest it honestly. Specs like this one are the survivors of an unknown number of trials; deflate their results accordingly.
Related specs
- Bollinger Bands Trend Reversal StrategyPine Script · Mean reversion · 10m
- Ichimoku Cloud Quant StrategyPine Script · Mean reversion · 1d
- Advanced Momentum EMA Trend Following with RSI Overbought Oversold Trading StrategyPine Script · Mean reversion · 1d
- Advanced Quantitative Trading Strategy Combining RSI Divergence and Moving AveragesPine Script · Mean reversion · 1h
- Byron Serpent Cloud Quant StrategyPine Script · Mean reversion · 1h
- Dynamic Adaptive Multi Timeframe Trend Following and Range Reversal Hybrid StrategyPine Script · Mean reversion · 2d