Strategy vault / Mean reversion
RSI Divergence Strategy
This strategy determines long and short positions by calculating RSI indicator and crossovers between RSI EMA lines, combined with divergences between RSI and price to find potential trading signals. It belongs to…
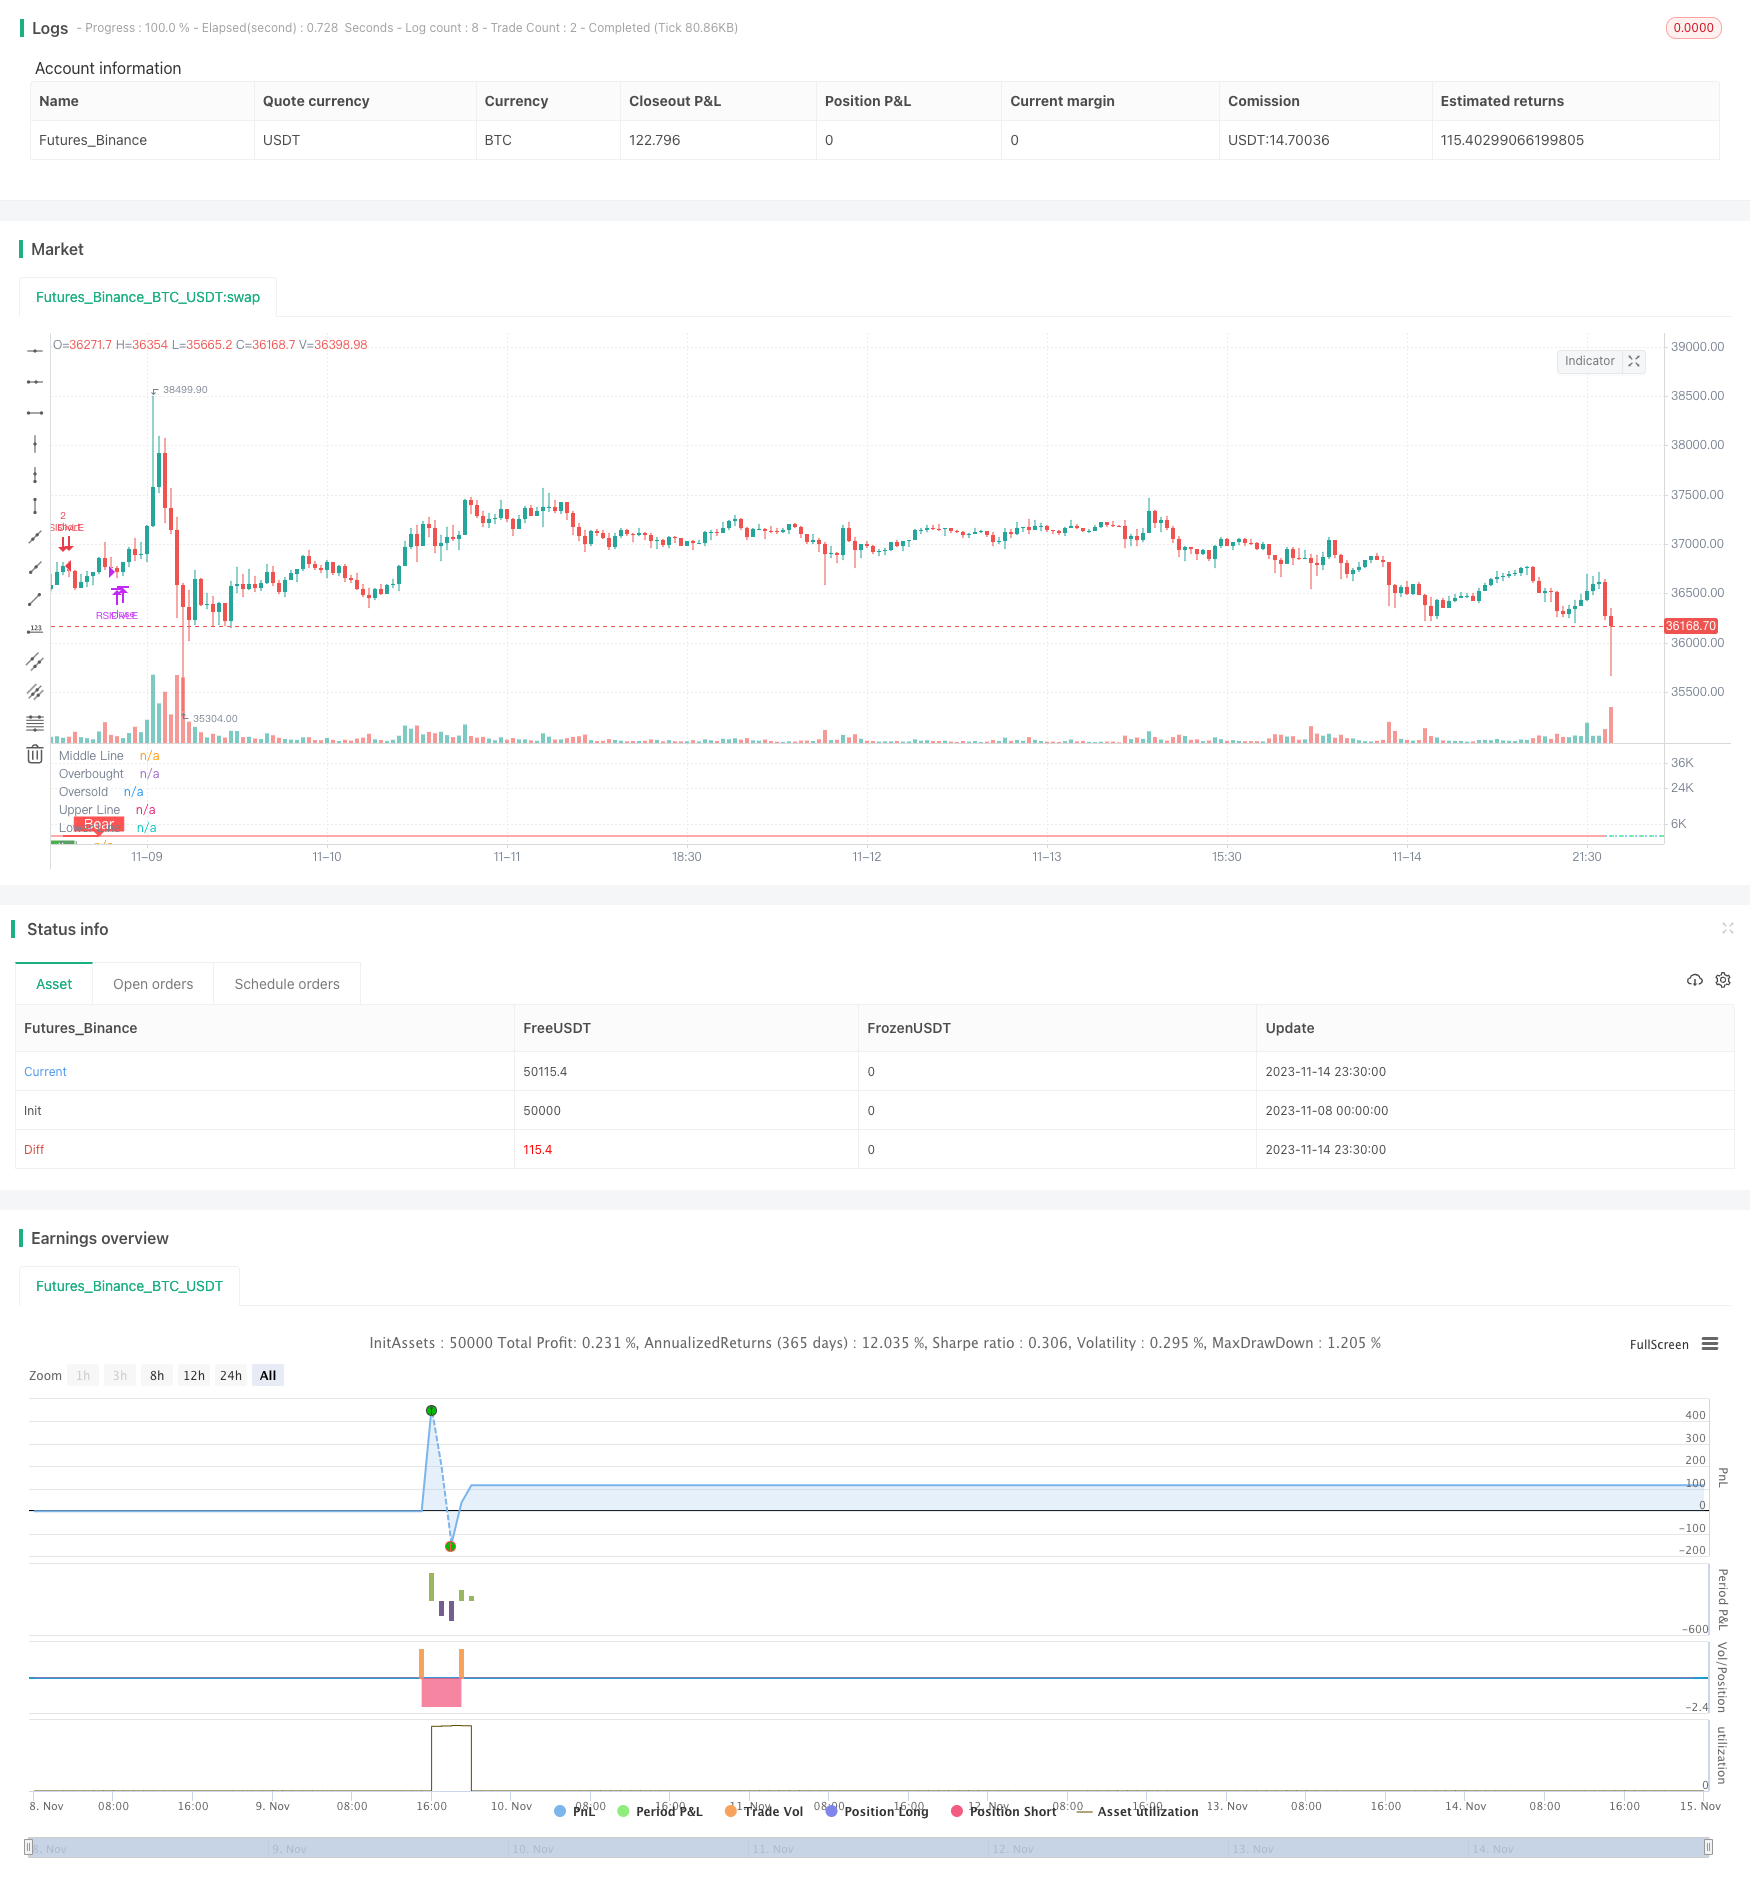
Overview
This strategy determines long and short positions by calculating RSI indicator and crossovers between RSI EMA lines, combined with divergences between RSI and price to find potential trading signals. It belongs to trend following strategies.
Strategy Logic
Calculate 14-period RSI indicator, RSI crossing above 50 is buy signal and crossing below 50 is sell signal.
Calculate 20-period EMA and 14-period EMA of RSI, fast EMA crossing above slow EMA is buy signal and crossing below is sell signal.
Detect divergences between RSI and price:
Regular bullish divergence: price makes new low but RSI does not, buy signal
Hidden bullish divergence: price makes new high but RSI does not, buy signal
Regular bearish divergence: price makes new high but RSI does not, sell signal
Hidden bearish divergence: price makes new low but RSI does not, sell signal
- Stop loss strategies can be enabled, including percentage-based and ATR-based.
Advantage Analysis
RSI indicator is good at detecting overbought and oversold situations. EMAs can smooth out noise in data.
Divergences between RSI and price can provide early reversal signals.
Combining signals from two indicators can validate each other and improve strategy stability.
Stop loss mechanisms control single trade loss.
Risk Analysis
As a momentum indicator, RSI may underperform when price fluctuates violently.
EMAs have time lag and cannot precisely locate turning points.
Divergence signals may produce false signals when trend continues.
Improper stop loss setting may cause unnecessary loss.
Drawdown can be large, sufficient capital is needed.
Optimization Directions
Test different parameters for RSI and EMA calculation to find optimal combinations.
Consider replacing EMA with other indicators like MACD for ensemble optimization.
Add confirmation mechanisms to avoid false divergences, e.g. requiring consecutive signals.
Add profit taking strategies to lock in gains.
Incorporate short-term signals like candlestick patterns for entry, combined with trend judgment of this strategy.
Summary
This strategy integrates overbought/oversold detection of RSI, trend following with EMA, and reversal prediction of divergences into a systematic trend tracking system. With parameter tuning and ensemble optimization, good results can be achieved. But risks like trend shocks and false signals should be guarded against. With proper money management, this strategy can produce steady excess returns in medium-to-long term.
Parameters
| Name | Default | What it controls |
|---|---|---|
| v_input_1 | 14 | RSI Period |
| v_input_2_close | 0 | RSI Source: close | high | low | open | hl2 | hlc3 | hlcc4 | ohlc4 |
| v_input_3 | 3 | Pivot Lookback Right |
| v_input_4 | true | Pivot Lookback Left |
| v_input_5 | 80 | Take Profit at RSI Level |
| v_input_6 | 60 | Max of Lookback Range |
| v_input_7 | 5 | Min of Lookback Range |
| v_input_8 | true | Plot Bullish |
| v_input_9 | true | Plot Hidden Bullish |
| v_input_10 | true | Plot Bearish |
| v_input_11 | false | Plot Hidden Bearish |
| v_input_12 | 0 | Trailing StopLoss Type: NONE | PERC | ATR |
| v_input_13 | 5 | Stop Loss% |
| v_input_14 | 14 | ATR Length (for Trailing stop loss) |
| v_input_15 | 3.5 | ATR Multiplier (for Trailing stop loss) |
| v_input_16 | 14 | RSI Length |
| v_input_17 | 20 | EMA of RSI Length |
| v_input_18 | 14 | Fast EMA |
Source Pine Script
/*backtest
start: 2023-11-08 00:00:00
end: 2023-11-15 00:00:00
period: 30m
basePeriod: 15m
exchanges: [{"eid":"Futures_Binance","currency":"BTC_USDT"}]
*/

//@version=4
strategy(title="RSI Divergence Indicator", overlay=false,pyramiding=2, default_qty_value=2,   default_qty_type=strategy.fixed, initial_capital=10000, currency=currency.USD)

len = input(title="RSI Period", minval=1, defval=14)
src = input(title="RSI Source", defval=close)
lbR = input(title="Pivot Lookback Right", defval=3)
lbL = input(title="Pivot Lookback Left", defval=1)
takeProfitRSILevel = input(title="Take Profit at RSI Level", minval=70, defval=80)

rangeUpper = input(title="Max of Lookback Range", defval=60)
rangeLower = input(title="Min of Lookback Range", defval=5)
plotBull = input(title="Plot Bullish", defval=true)
plotHiddenBull = input(title="Plot Hidden Bullish", defval=true)
plotBear = input(title="Plot Bearish", defval=true)
plotHiddenBear = input(title="Plot Hidden Bearish", defval=false)

sl_type = input("NONE", title="Trailing StopLoss Type", options=['ATR','PERC', 'NONE'])

stopLoss = input(title="Stop Loss%", defval=5, minval=1)

atrLength=input(14, title="ATR Length (for Trailing stop loss)")
atrMultiplier=input(3.5, title="ATR Multiplier (for Trailing stop loss)")


bearColor = color.red
bullColor = color.green
hiddenBullColor = color.new(color.green, 80)
hiddenBearColor = color.new(color.red, 80)
textColor = color.white
noneColor = color.new(color.white, 100)

osc = rsi(src, len)

plot(osc, title="RSI", linewidth=2, color=color.white)
hline(50, title="Middle Line", linestyle=hline.style_dotted)
obLevel = hline(70, title="Overbought", linestyle=hline.style_dotted)
osLevel = hline(30, title="Oversold", linestyle=hline.style_dotted)
fill(obLevel, osLevel, title="Background", color=color.gray, transp=90)

plFound = na(pivotlow(osc, lbL, lbR)) ? false : true
phFound = na(pivothigh(osc, lbL, lbR)) ? false : true

_inRange(cond) =>
    bars = barssince(cond == true)
    rangeLower <= bars and bars <= rangeUpper

//------------------------------------------------------------------------------
// Regular Bullish

// Osc: Higher Low
oscHL = osc[lbR] > valuewhen(plFound, osc[lbR], 1) and _inRange(plFound[1])

// Price: Lower Low
priceLL = low[lbR] < valuewhen(plFound, low[lbR], 1)

bullCond = plotBull and priceLL and oscHL and plFound

plot(
	 plFound ? osc[lbR] : na,
	 offset=-lbR,
	 title="Regular Bullish",
	 linewidth=2,
	 color=(bullCond ? bullColor : noneColor),
	 transp=0
	 )


plotshape(
	 bullCond ? osc[lbR] : na,
	 offset=-lbR,
	 title="Regular Bullish Label",
	 text=" Bull ",
	 style=shape.labelup,
	 location=location.absolute,
	 color=bullColor,
	 textcolor=textColor,
	 transp=0
	 )

//------------------------------------------------------------------------------
// Hidden Bullish

// Osc: Lower Low
oscLL = osc[lbR] < valuewhen(plFound, osc[lbR], 1) and _inRange(plFound[1])

// Price: Higher Low
priceHL = low[lbR] > valuewhen(plFound, low[lbR], 1)

hiddenBullCond = plotHiddenBull and priceHL and oscLL and plFound

plot(
	 plFound ? osc[lbR] : na,
	 offset=-lbR,
	 title="Hidden Bullish",
	 linewidth=2,
	 color=(hiddenBullCond ? hiddenBullColor : noneColor),
	 transp=0
	 )

plotshape(
	 hiddenBullCond ? osc[lbR] : na,
	 offset=-lbR,
	 title="Hidden Bullish Label",
	 text=" H Bull ",
	 style=shape.labelup,
	 location=location.absolute,
	 color=bullColor,
	 textcolor=textColor,
	 transp=0
	 )

longCondition=bullCond or hiddenBullCond
//? osc[lbR] : na
//hiddenBullCond
strategy.entry(id="RSIDivLE", long=true,  when=longCondition)


//Trailing StopLoss
////// Calculate trailing SL
/////////////////////////////////////////////////////
sl_val = sl_type == "ATR"      ? stopLoss * atr(atrLength) :
         sl_type == "PERC" ? close * stopLoss / 100 : 0.00

trailing_sl = 0.0
trailing_sl :=   strategy.position_size>=1 ?  max(low  - sl_val, nz(trailing_sl[1])) :  na

//draw initil stop loss
//plot(strategy.position_size>=1 ? trailing_sl : na, color = color.blue , style=plot.style_linebr,  linewidth = 2, title = "stop loss")
//plot(trailing_sl, title="ATR Trailing Stop Loss", style=plot.style_linebr, linewidth=1, color=color.purple, transp=30)
//Trailing StopLoss
////// Calculate trailing SL
/////////////////////////////////////////////////////


//------------------------------------------------------------------------------
// Regular Bearish

// Osc: Lower High
oscLH = osc[lbR] < valuewhen(phFound, osc[lbR], 1) and _inRange(phFound[1])

// Price: Higher High
priceHH = high[lbR] > valuewhen(phFound, high[lbR], 1)

bearCond = plotBear and priceHH and oscLH and phFound

plot(
	 phFound ? osc[lbR] : na,
	 offset=-lbR,
	 title="Regular Bearish",
	 linewidth=2,
	 color=(bearCond ? bearColor : noneColor),
	 transp=0
	 )

plotshape(
	 bearCond ? osc[lbR] : na,
	 offset=-lbR,
	 title="Regular Bearish Label",
	 text=" Bear ",
	 style=shape.labeldown,
	 location=location.absolute,
	 color=bearColor,
	 textcolor=textColor,
	 transp=0
	 )

//------------------------------------------------------------------------------
// Hidden Bearish

// Osc: Higher High
oscHH = osc[lbR] > valuewhen(phFound, osc[lbR], 1) and _inRange(phFound[1])

// Price: Lower High
priceLH = high[lbR] < valuewhen(phFound, high[lbR], 1)

hiddenBearCond = plotHiddenBear and priceLH and oscHH and phFound

plot(
	 phFound ? osc[lbR] : na,
	 offset=-lbR,
	 title="Hidden Bearish",
	 linewidth=2,
	 color=(hiddenBearCond ? hiddenBearColor : noneColor),
	 transp=0
	 )

plotshape(
	 hiddenBearCond ? osc[lbR] : na,
	 offset=-lbR,
	 title="Hidden Bearish Label",
	 text=" H Bear ",
	 style=shape.labeldown,
	 location=location.absolute,
	 color=bearColor,
	 textcolor=textColor,
	 transp=0
	 )
longCloseCondition=crossover(osc,takeProfitRSILevel) or bearCond
strategy.close(id="RSIDivLE", comment="Close All="+tostring(close - strategy.position_avg_price, "####.##"), when= abs(strategy.position_size)>=1  and  sl_type == "NONE" and longCloseCondition)

//close all on stop loss
strategy.close(id="RSIDivLE", comment="TSL="+tostring(close - strategy.position_avg_price, "####.##"),  when=abs(strategy.position_size)>=1 and (sl_type == "PERC"   or sl_type == "ATR" ) and crossunder(close, trailing_sl)  )  //close<ema55 and rsi5Val<20 //ema34<ema55  //close<ema89

src1 = close,
len6 = input(14, minval=1, title="RSI Length")
len7 = input(20, minval=1, title="EMA of RSI Length")
len8 = input(14,minval=1, title="Fast EMA")
up = rma(max(change(src1), 0), len6)
down = rma(-min(change(src1), 0), len6)
rsi = down == 0 ? 100 : up == 0 ? 0 : 100 - (100 / (1 + up / down))
emaRSI = ema(rsi,len7)
fastEmaRSI=ema(rsi,len8)

plot(emaRSI, title="EMA of RSI", linewidth=1, color=color.red)
plot(fastEmaRSI,title="Fast EMA of RSI", linewidth=1,color = color.lime)
band1 = hline(80, title="Upper Line", linewidth=1, color=color.red)
band0 = hline(20, title="Lower Line", linewidth=1, color=color.lime)
fill(band1, band0, color=color.purple)Published by ChaoZhang on the FMZ strategy square · last modified 2023-11-16. Collected in the Quant Trading Vault. Unvalidated research: re-test with your own data and costs before trusting it.
Build this with AgenKit
A spec is not a trading system. Paste this into your coding agent and AgenKit runs a specialist team — architecture, test-first build, risk gates, review — with paper trading on by default.
/agenkit build a production-grade trading bot with a backtest engine, risk controls and paper trading by default from strategies/RSI-Divergence-Strategy.md- npx agenkit install engineering-kit in your project
- Paste the command into your agent and approve each phase
- Get tests, backtest, risk controls and a paper-trading switch
Understand it first
Before you run this, read the lesson behind the idea and how to backtest it honestly. Specs like this one are the survivors of an unknown number of trials; deflate their results accordingly.
Related specs
- MACD RSI and EMA StrategyPine Script · Mean reversion · 1d
- ATR and EMA based Dynamic Take Profit and Stop Loss Adaptive StrategyPine Script · Mean reversion · 1h
- Advanced Momentum EMA Trend Following with RSI Overbought Oversold Trading StrategyPine Script · Mean reversion · 1d
- Customizable Non Repainting HTF MACD MFI Scalable Bot StrategyPine Script · Mean reversion · 1d
- Dynamic Adaptive Multi Timeframe Trend Following and Range Reversal Hybrid StrategyPine Script · Mean reversion · 2d
- Dynamic MACD and Ichimoku Cloud Trading StrategyPine Script · Mean reversion · 1h