RSI Divergence Trading Strategy 439702
The RSI divergence trading strategy captures mispricing opportunities by analyzing the divergence between the RSI indicator and price. It goes long or short when the divergence appears.
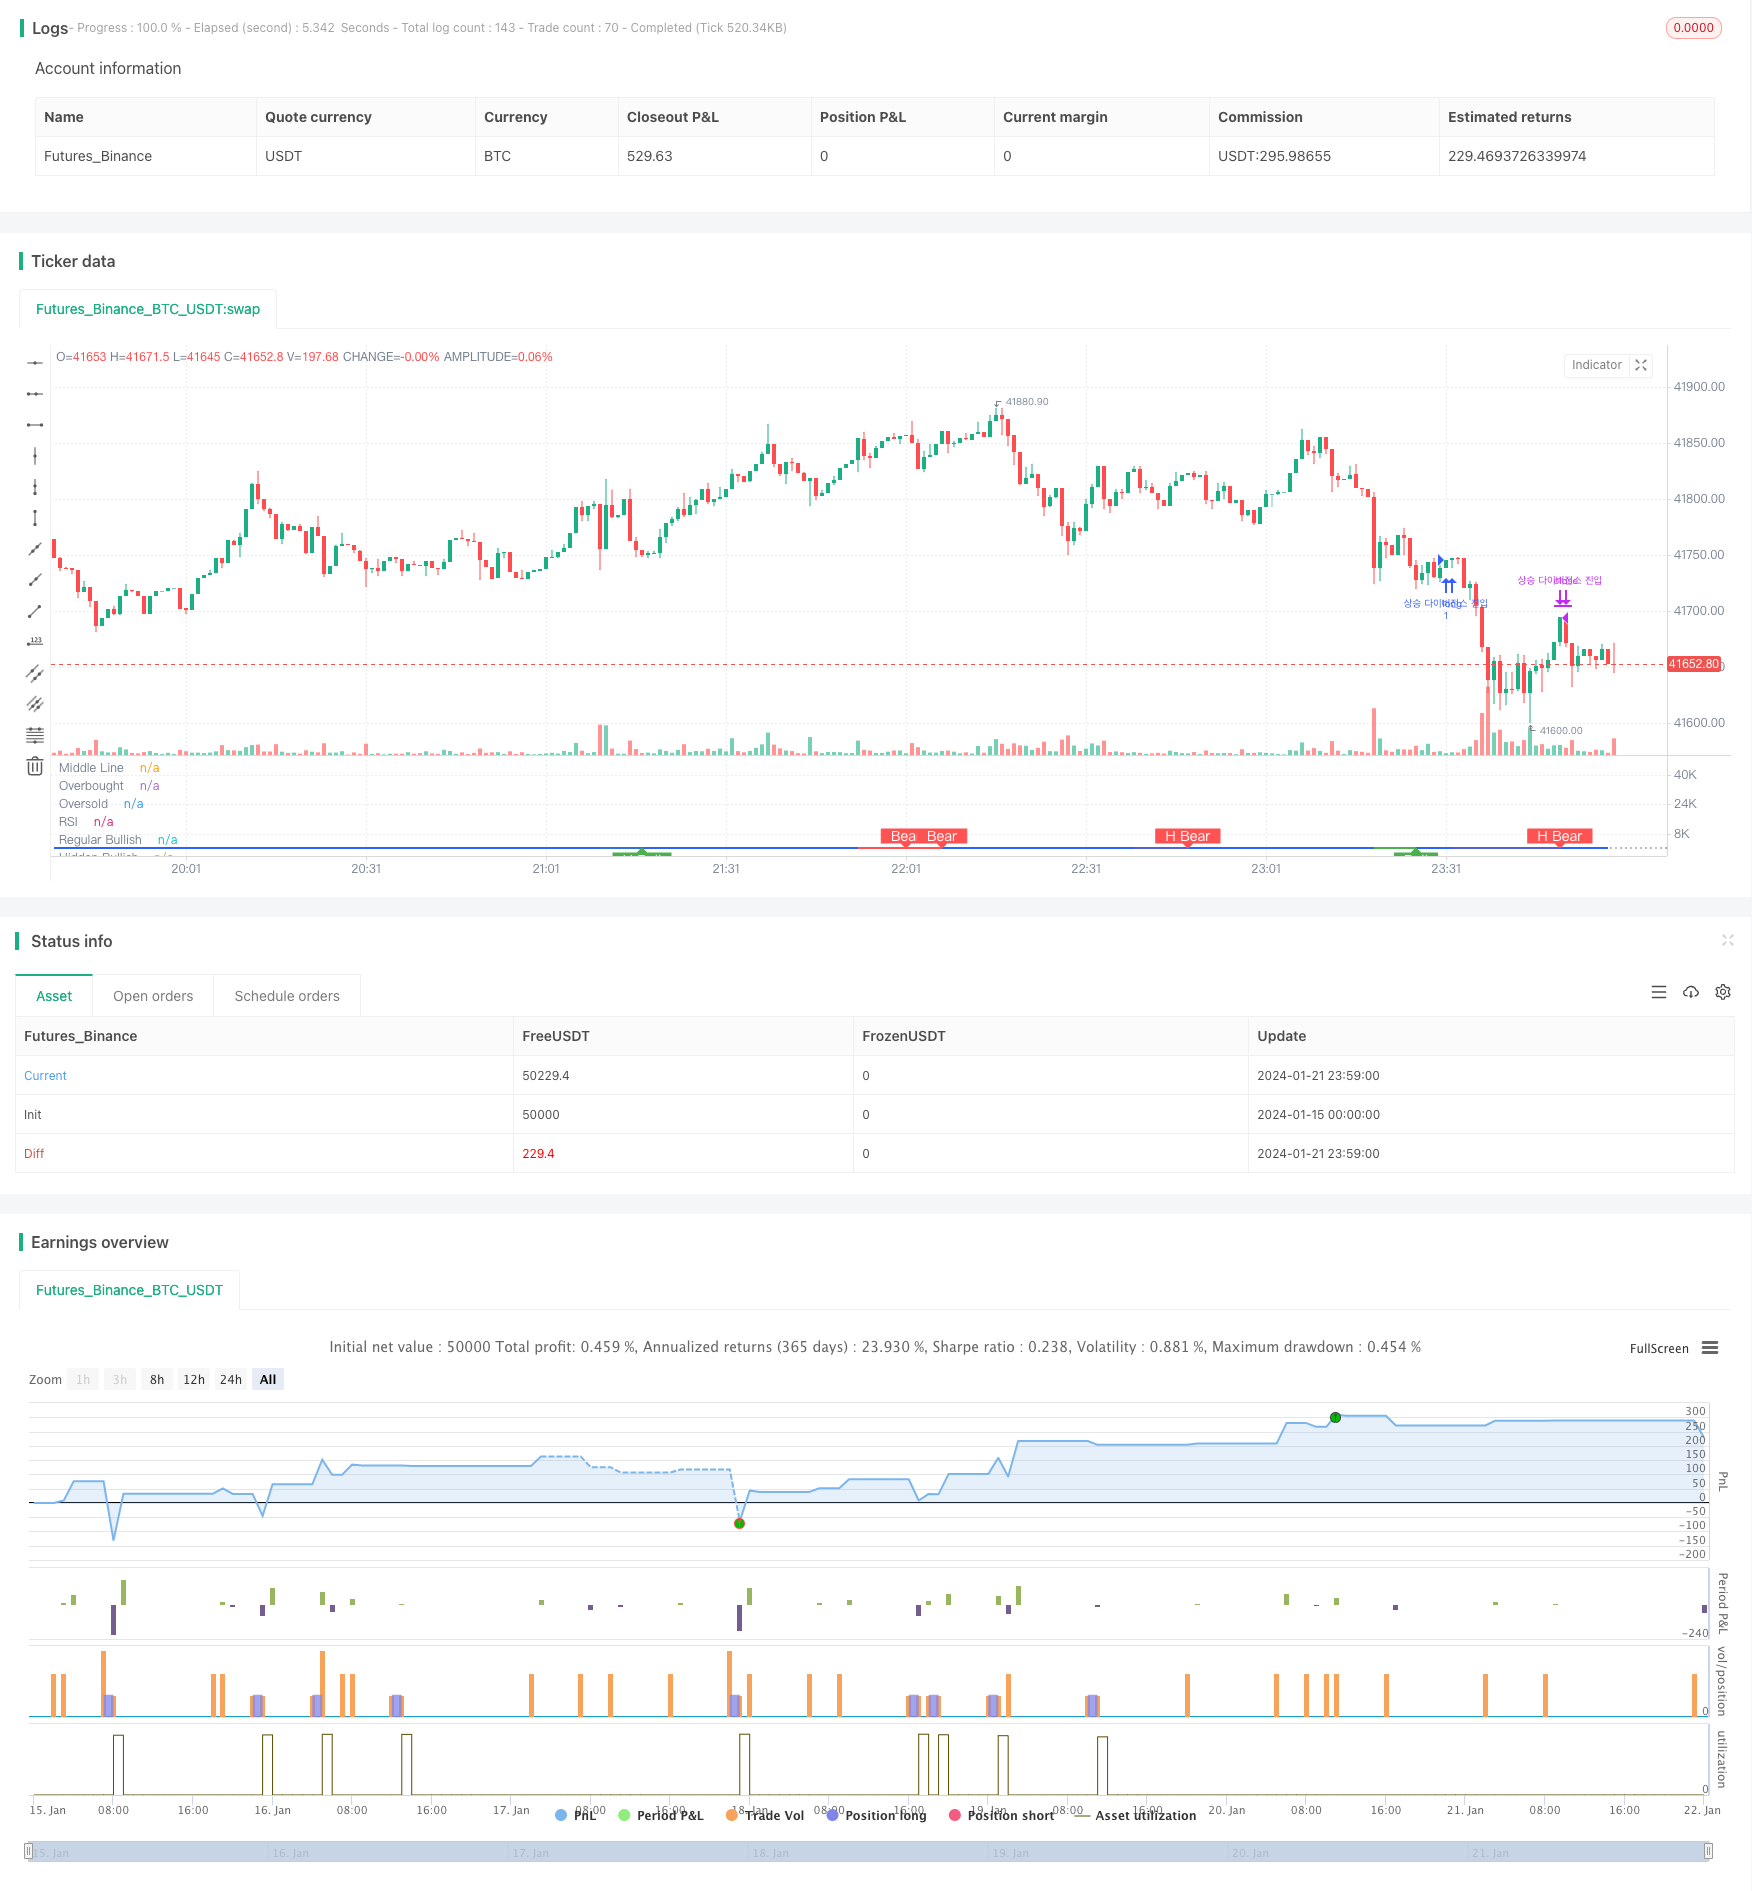
Overview
The RSI divergence trading strategy captures mispricing opportunities by analyzing the divergence between the RSI indicator and price. It goes long or short when the divergence appears.
Strategy Logic
The strategy is based on the value-price divergence when RSI diverges from price. RSI reflects the strength while price reflects the supply-demand relationship. When the two diverge, it indicates market mispricing for arbitrage.
Specifically, a regular bullish divergence happens when RSI forms a higher low while price prints a lower low. This shows that although the market looks weak on the surface, it is actually garnering strength internally for a bounce. When RSI diverges from price and breaks above the 50-line, it presents an opportunity to catch the bounce.
A regular bearish divergence happens when RSI makes a lower high while price forms a higher high. This suggests that although the market looks strong externally, it is showing weakness signals internally. When RSI diverges from price and breaks below the 50-line, it allows profiting from the short side.
There are also hidden bullish and bearish divergences where the relationship between RSI and price is opposite of regular divergences, but the logic remains the same for taking profits.
Advantages
- Captures market mispricing from value-price divergence
- Improves win rate combining indicator and price divergence
- Covers more opportunities distinguishing all types of divergences
Risk Analysis
- Fake divergences can happen under special market conditions
- Breaking 50-line has relatively low success rate, can optimize
- Picking wrong direction could lead to big losses
Optimization Directions
- Optimize RSI parameters for higher accuracy
- Combine signals from other indicators to confirm divergences
- Assess risk-reward for longs and shorts to control per trade loss
Summary
The RSI divergence strategy arbitrages market mispricing through analyzing divergence between value and price signals. Its advantage lies in timely catching trend reversal opportunities, while its risk comes from the accuracy of divergence recognition. With continuous optimization, steady gains can be achieved in live trading.
Parameters
| Name | Default | What it controls |
|---|---|---|
| v_input_int_1 | 14 | RSI Period |
| v_input_1_close | 0 | RSI Source: close | high | low | open | hl2 | hlc3 | hlcc4 | ohlc4 |
| v_input_2 | 5 | Pivot Lookback Right |
| v_input_3 | 5 | Pivot Lookback Left |
| v_input_4 | 60 | Max of Lookback Range |
| v_input_5 | 5 | Min of Lookback Range |
| v_input_6 | true | Plot Bullish |
| v_input_7 | true | Plot Hidden Bullish |
| v_input_8 | true | Plot Bearish |
| v_input_9 | true | Plot Hidden Bearish |
Source Pine Script
/*backtest
start: 2024-01-15 00:00:00
end: 2024-01-22 00:00:00
period: 1m
basePeriod: 1m
exchanges: [{"eid":"Futures_Binance","currency":"BTC_USDT"}]
*/

//@version=5
strategy(title="Divergence Indicator")
len = input.int(title="RSI Period", minval=1, defval=14)
src = input(title="RSI Source", defval=close)
lbR = input(title="Pivot Lookback Right", defval=5)
lbL = input(title="Pivot Lookback Left", defval=5)
rangeUpper = input(title="Max of Lookback Range", defval=60)
rangeLower = input(title="Min of Lookback Range", defval=5)
plotBull = input(title="Plot Bullish", defval=true)
plotHiddenBull = input(title="Plot Hidden Bullish", defval=true)
plotBear = input(title="Plot Bearish", defval=true)
plotHiddenBear = input(title="Plot Hidden Bearish", defval=true)
bearColor = color.red
bullColor = color.green
hiddenBullColor = color.new(color.green, 80)
hiddenBearColor = color.new(color.red, 80)
textColor = color.white
noneColor = color.new(color.white, 100)
osc = ta.rsi(src, len)

plot(osc, title="RSI", linewidth=2, color=#2962FF)
hline(50, title="Middle Line", color=#787B86, linestyle=hline.style_dotted)
obLevel = hline(70, title="Overbought", color=#787B86, linestyle=hline.style_dotted)
osLevel = hline(30, title="Oversold", color=#787B86, linestyle=hline.style_dotted)
fill(obLevel, osLevel, title="Background", color=color.rgb(33, 150, 243, 90))

plFound = na(ta.pivotlow(osc, lbL, lbR)) ? false : true
phFound = na(ta.pivothigh(osc, lbL, lbR)) ? false : true
_inRange(cond) =>
	bars = ta.barssince(cond == true)
	rangeLower <= bars and bars <= rangeUpper

//------------------------------------------------------------------------------
// Regular Bullish
// Osc: Higher Low

oscHL = osc[lbR] > ta.valuewhen(plFound, osc[lbR], 1) and _inRange(plFound[1])

// Price: Lower Low

priceLL = low[lbR] < ta.valuewhen(plFound, low[lbR], 1)
// bull : 상승 Condition : 조건
bullCond = plotBull and priceLL and oscHL and plFound // 상승다이버전스?
strategy.entry("상승 다이버전스 진입", strategy.long, when = bullCond)
strategy.close("상승 다이버전스 진입", when = ta.crossover(osc, 50))
plot(
     plFound ? osc[lbR] : na,
     offset=-lbR,
     title="Regular Bullish",
     linewidth=2,
     color=(bullCond ? bullColor : noneColor)
     )

plotshape(
	 bullCond ? osc[lbR] : na,
	 offset=-lbR,
	 title="Regular Bullish Label",
	 text=" Bull ",
	 style=shape.labelup,
	 location=location.absolute,
	 color=bullColor,
	 textcolor=textColor
	 )

//------------------------------------------------------------------------------
// Hidden Bullish
// Osc: Lower Low

oscLL = osc[lbR] < ta.valuewhen(plFound, osc[lbR], 1) and _inRange(plFound[1])

// Price: Higher Low

priceHL = low[lbR] > ta.valuewhen(plFound, low[lbR], 1)
hiddenBullCond = plotHiddenBull and priceHL and oscLL and plFound
// strategy.entry("히든 상승 다이버전스 진입", strategy.long, when = hiddenBullCond)
// strategy.close("히든 상승 다이버전스 진입", when = ta.crossover(osc, 50))
plot(
	 plFound ? osc[lbR] : na,
	 offset=-lbR,
	 title="Hidden Bullish",
	 linewidth=2,
	 color=(hiddenBullCond ? hiddenBullColor : noneColor)
	 )

plotshape(
	 hiddenBullCond ? osc[lbR] : na,
	 offset=-lbR,
	 title="Hidden Bullish Label",
	 text=" H Bull ",
	 style=shape.labelup,
	 location=location.absolute,
	 color=bullColor,
	 textcolor=textColor
	 )

//------------------------------------------------------------------------------
// Regular Bearish
// Osc: Lower High

oscLH = osc[lbR] < ta.valuewhen(phFound, osc[lbR], 1) and _inRange(phFound[1])

// Price: Higher High

priceHH = high[lbR] > ta.valuewhen(phFound, high[lbR], 1)
// bear : 하락
bearCond = plotBear and priceHH and oscLH and phFound
// strategy.entry("하락 다이버전스 진입", strategy.short, when = bearCond)
// strategy.close("하락 다이버전스 진입", when = ta.crossunder(osc, 50))
plot(
	 phFound ? osc[lbR] : na,
	 offset=-lbR,
	 title="Regular Bearish",
	 linewidth=2,
	 color=(bearCond ? bearColor : noneColor)
	 )

plotshape(
	 bearCond ? osc[lbR] : na,
	 offset=-lbR,
	 title="Regular Bearish Label",
	 text=" Bear ",
	 style=shape.labeldown,
	 location=location.absolute,
	 color=bearColor,
	 textcolor=textColor
	 )

//------------------------------------------------------------------------------
// Hidden Bearish
// Osc: Higher High

oscHH = osc[lbR] > ta.valuewhen(phFound, osc[lbR], 1) and _inRange(phFound[1])

// Price: Lower High

priceLH = high[lbR] < ta.valuewhen(phFound, high[lbR], 1)

hiddenBearCond = plotHiddenBear and priceLH and oscHH and phFound
// strategy.entry("히든 하락 다이버전스 진입", strategy.short, when = hiddenBearCond)
// strategy.close("히든 하락 다이버전스 진입", when = ta.crossunder(osc, 50))
plot(
	 phFound ? osc[lbR] : na,
	 offset=-lbR,
	 title="Hidden Bearish",
	 linewidth=2,
	 color=(hiddenBearCond ? hiddenBearColor : noneColor)
	 )

plotshape(
	 hiddenBearCond ? osc[lbR] : na,
	 offset=-lbR,
	 title="Hidden Bearish Label",
	 text=" H Bear ",
	 style=shape.labeldown,
	 location=location.absolute,
	 color=bearColor,
	 textcolor=textColor
)Published by ChaoZhang on the FMZ strategy square · last modified 2024-01-23. Collected in the Quant Trading Vault. Unvalidated research: re-test with your own data and costs before trusting it.
Build this with AgenKit
A spec is not a trading system. Paste this into your coding agent and AgenKit runs a specialist team — architecture, test-first build, risk gates, review — with paper trading on by default.
/agenkit build a spread arbitrage engine with WebSocket order routing and leg-risk controls from strategies/RSI-Divergence-Trading-Strategy-439702.md- npx agenkit install engineering-kit in your project
- Paste the command into your agent and approve each phase
- Get tests, backtest, risk controls and a paper-trading switch
Understand it first
Before you run this, read the lesson behind the idea and how to backtest it honestly. Specs like this one are the survivors of an unknown number of trials; deflate their results accordingly.
Related specs
- Triple Moving Average Quantitative Trading Strategy 433095Pine Script · Arbitrage · 1d
- multiple auxiliary RSI indicator strategyPine Script · Arbitrage · 1d
- Oscillating Market Long StrategyPine Script · Arbitrage · 1d
- Momentum Arbitrage Strategy Backtest AnalysisPine Script · Arbitrage · 1h
- The Triple Moving Average Channel Strategy for Patiently Mining Valuable Information from Candlestick LinesPine Script · Arbitrage · 1d
- Dual Timeframe Volatility Spread Trading StrategyPine Script · Arbitrage · 2h