Strategy vault / Mean reversion
RSI Dual Cross Reversal Strategy
This strategy is a trend following strategy based on the dual cross reversal principle of the RSI indicator. It uses crossovers between RSI lines of different periods as buy and sell signals, while also incorporating…
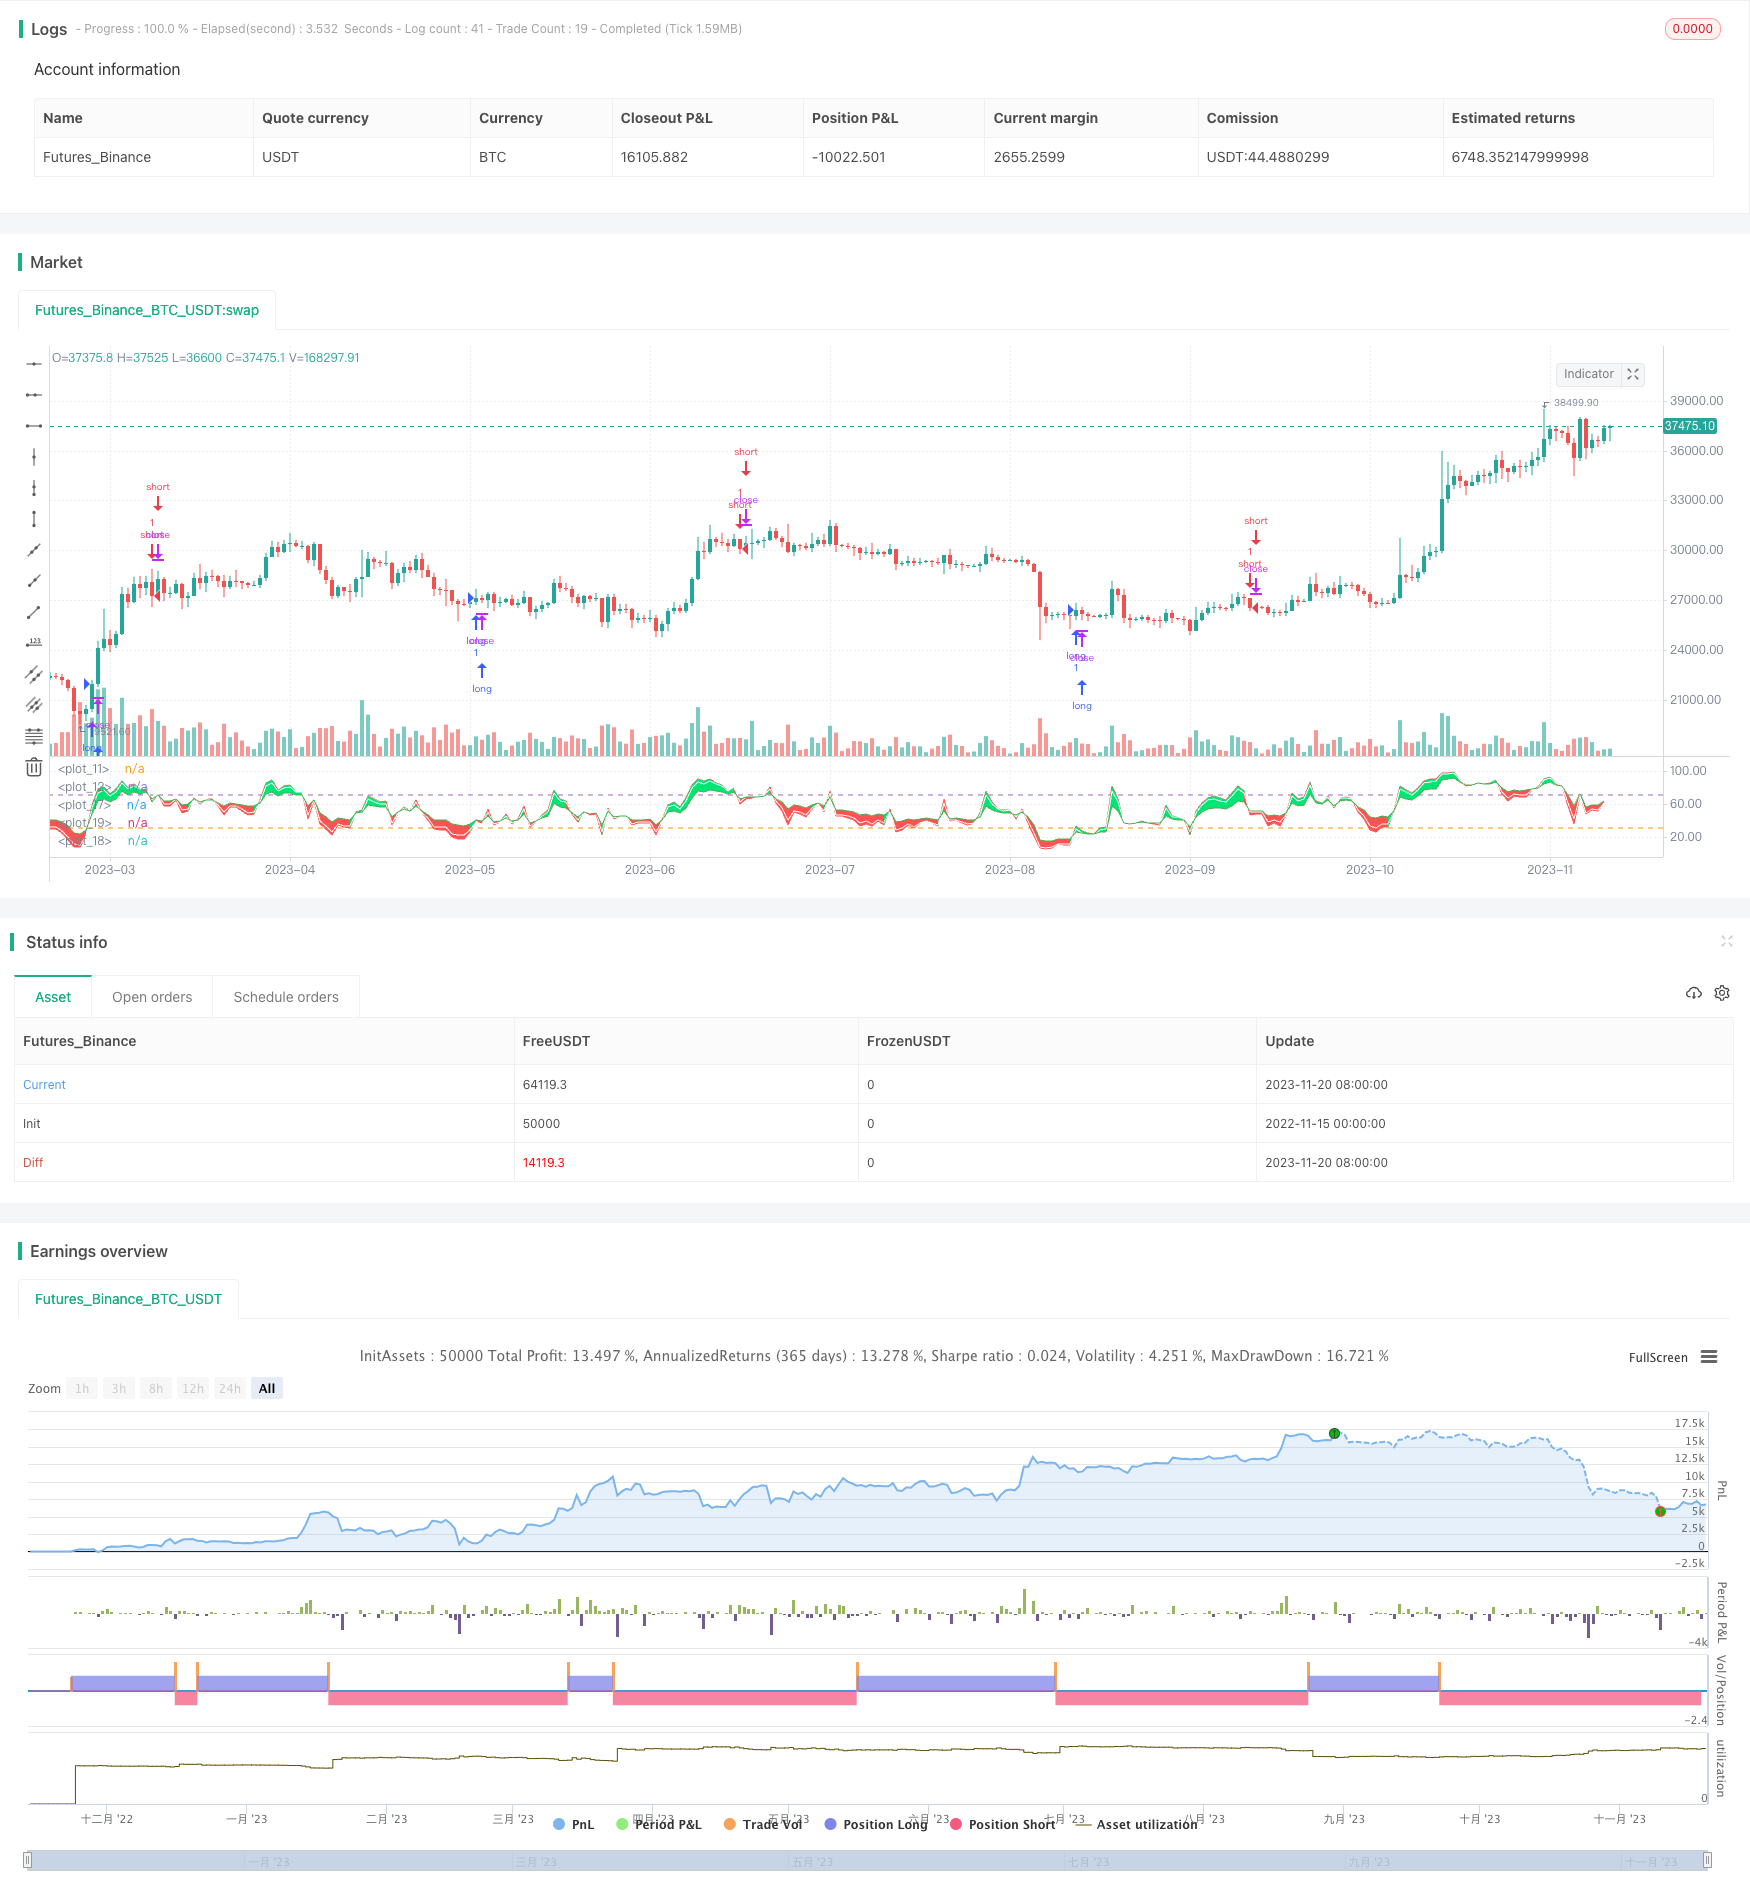
Overview
This strategy is a trend following strategy based on the dual cross reversal principle of the RSI indicator. It uses crossovers between RSI lines of different periods as buy and sell signals, while also incorporating RSI indicator judgments on whether the current situation is overbought or oversold to further confirm the validity of trading signals.
Strategy Logic
The strategy is mainly based on the 5-day and 11-day two RSI indicator lines. When the faster RSI (5-day line) breaks through the slower RSI (11-day line) upward while the 6-day RSI is below 30 at the same time, a buy signal is generated; When the faster RSI breaks through the slower RSI downward while the 6-day RSI is above 70 at the same time, a sell signal is generated.
The strategy also draws 30 and 70 horizontal lines, with 30 representing the oversold area and 70 representing the overbought area. The basic idea of the RSI indicator is that when in the overbought/oversold area, it means the asset is over/under valued and one should consider taking profit/buying opportunities. Therefore, the strategy incorporates judgments on the 6-day RSI to see if it is in the OBOS region to filter out some false signals and improve reliability.
When buy and sell signals are generated, the strategy will place long and short orders accordingly. So it is a dual directional trading strategy that can track both uptrends and downtrends.
Advantages
- High reliability due to dual cross principle
- Avoid false signals by incorporating multi-period RSI
- Dual directional trading suitable for trend following
- RSI indicator is stable with large optimization space
Risks and Solutions
Dual cross signals lag and may miss some ups and downs
Solution: Shorten faster RSI period parameter to make signals more sensitiveMore false signals may occur in trending markets
Solution: Adjust OBOS parameter to avoid false signals in trendsDivergence or failure probabilities of RSI indicator
Solution: Combine with other indicators to avoid sole failure probability
Optimization Directions
Period parameter optimization: Adjust faster and slower RSI periods, find best combination
OBOS parameter optimization: Adjust OBOS parameters to improve signal accuracy
Combine with other indicators: Incorporate MA, volatility indicators etc to form comprehensive system
Conclusion
This strategy is a reliable trend following strategy based on the RSI dual cross reversal logic. Its multi-period RSI design can avoid certain false signals and thus has good practical results. Through parameter optimization and indicator combinations, the strategy has potential for even better performance. In summary, the strategy has clear logic and strong practicality, and is worth key attention and further optimization.
Parameters
| Name | Default | What it controls |
|---|---|---|
| v_input_1 | 5 | MA 1 |
| v_input_2 | 11 | MA 1 |
| v_input_3 | 6 | MA 1 |
Source Pine Script
/*backtest
start: 2022-11-15 00:00:00
end: 2023-11-21 00:00:00
period: 1d
basePeriod: 1h
exchanges: [{"eid":"Futures_Binance","currency":"BTC_USDT"}]
*/

// This source code is subject to the terms of the Mozilla Public License 2.0 at https://mozilla.org/MPL/2.0/
// © email_analysts
// This code gives indication on the chart to go long or short based on RSI crossover strategy.
//Default value has been taken as 5 and 11, with 6 being used to identify highs & lows.
//@version=4
strategy("RSITrendStrategy", overlay=false)
len1 = input(title="MA 1", defval = 5)
len2 = input(title="MA 1", defval = 11)
len3 = input(title="MA 1", defval = 6)

h1 = hline(30.)
h2 = hline(70.)
///fill(h1, h2, color = color.new(color.blue, 80))
sh = rsi(close, len1)
ln = rsi(close, len2)
rs = rsi(close, len3)
p1 = plot(sh, color = color.red)
p2 = plot(ln, color = color.green)
p3 = plot(rs, color = color.white)

mycol = sh > ln ? color.lime : color.red
fill(p1, p2, color = mycol)

buy = (sh[1] < ln[1] and sh > ln and rs[1] < 30)
if (buy)
    strategy.entry("long", strategy.long)

sell = (sh[1] > ln[1] and sh < ln and rs[1] > 70)
if (sell)
    strategy.entry("short", strategy.short)
Published by ChaoZhang on the FMZ strategy square · last modified 2023-11-22. Collected in the Quant Trading Vault. Unvalidated research: re-test with your own data and costs before trusting it.
Build this with AgenKit
A spec is not a trading system. Paste this into your coding agent and AgenKit runs a specialist team — architecture, test-first build, risk gates, review — with paper trading on by default.
/agenkit build a production-grade trading bot with a backtest engine, risk controls and paper trading by default from strategies/RSI-Dual-Cross-Reversal-Strategy.md- npx agenkit install engineering-kit in your project
- Paste the command into your agent and approve each phase
- Get tests, backtest, risk controls and a paper-trading switch
Understand it first
Before you run this, read the lesson behind the idea and how to backtest it honestly. Specs like this one are the survivors of an unknown number of trials; deflate their results accordingly.
Related specs
- ATR and EMA based Dynamic Take Profit and Stop Loss Adaptive StrategyPine Script · Mean reversion · 1h
- Adaptive Mean Reversion Trading Strategy Based on Chande Momentum OscillatorPine Script · Mean reversion · 1d
- Adaptive RSI Oscillator Dynamic Trading Strategy with Threshold OptimizationPine Script · Mean reversion · 1d
- Advanced 15 Minute Chart Trading Signal StrategyPine Script · Mean reversion · 3h
- Advanced Fibonacci Retracement Trend Following and Reversal Trading StrategyPine Script · Mean reversion · 3h
- Advanced Momentum EMA Trend Following with RSI Overbought Oversold Trading StrategyPine Script · Mean reversion · 1d