RSI Dynamic Breakout Retracement Trading Strategy
This strategy is a dynamic trading system based on the Relative Strength Index (RSI), identifying trades through overbought and oversold zones. Operating within specific time windows, it incorporates partial…
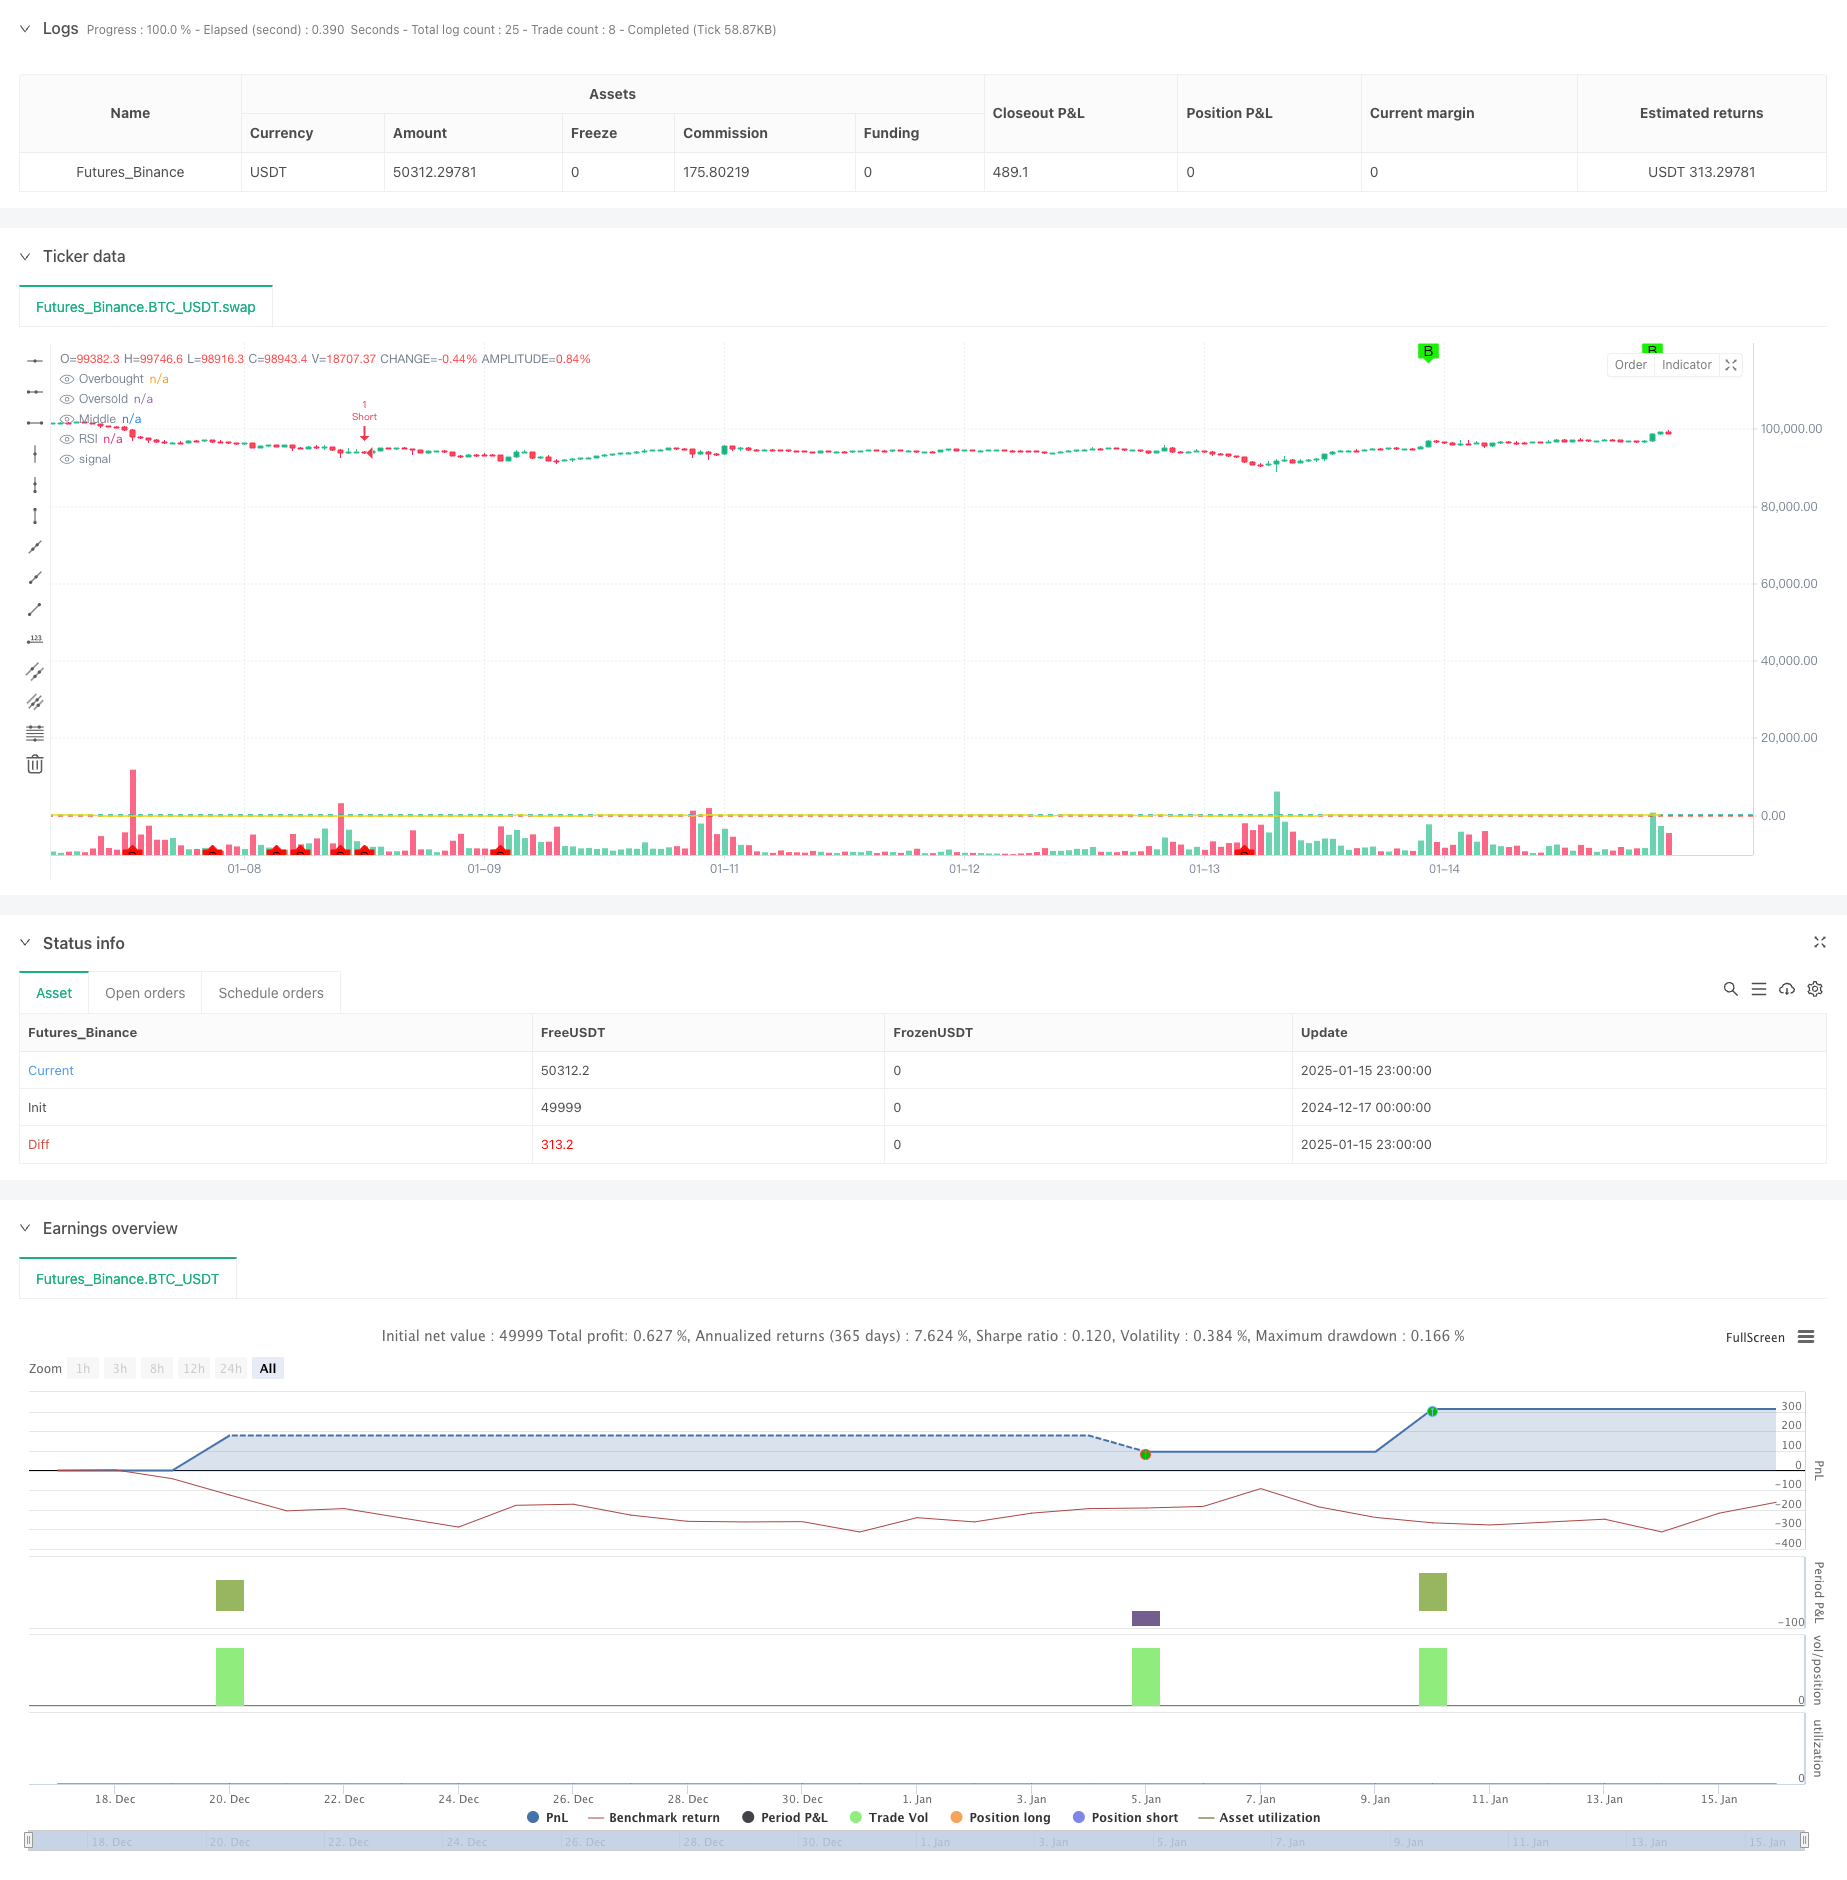
Overview
This strategy is a dynamic trading system based on the Relative Strength Index (RSI), identifying trades through overbought and oversold zones. Operating within specific time windows, it incorporates partial profit-taking and dynamic stop-loss mechanisms. The system monitors RSI breakthroughs at levels 70 and 30 to determine trading signals, utilizing flexible position management methods to optimize trading outcomes.
Strategy Principle
The core logic is built on the RSI indicator, encompassing these key elements:
- Uses 14-period RSI to calculate market momentum
- Generates short signals at RSI 70 breakthrough and long signals at RSI 30
- Executes trades between 8:00 and 11:00 GMT+2
- Employs a dual take-profit mechanism with 50% partial and full profit targets
- Adjusts stop-loss to breakeven after reaching partial profit target
- Uses fixed PIPS for stop-loss and profit targets
Strategy Advantages
- Trading window restriction reduces false signals and improves trade quality
- Dual take-profit mechanism secures quick gains while maintaining exposure to larger moves
- Dynamic stop-loss protects profits and reduces drawdown risk
- RSI indicator helps identify market overbought and oversold conditions
- Strategy parameters can be flexibly adjusted for different market conditions
Strategy Risks
- RSI indicator may generate false signals in ranging markets
- Fixed time window might miss opportunities in other periods
- Fixed PIPS stops may not suit all market conditions
- Slippage risk in volatile market conditions
- Partial profit mechanism might exit strong trends too early
Strategy Optimization Directions
- Implement adaptive RSI periods to better suit market conditions
- Dynamically adjust stop-loss and profit levels based on volatility
- Add trend filters to reduce false signals in ranging markets
- Optimize trading window based on market characteristics
- Incorporate volume confirmation to improve signal reliability
Summary
The strategy captures market overbought and oversold opportunities through RSI indicator, combining strict risk management and time filtering to form a complete trading system. While it has some limitations, the suggested optimization directions can further enhance strategy stability and profitability. The modular design makes it easy to adjust and optimize, suitable as a base strategy for personalized improvements.
Source Pine Script
/*backtest
start: 2024-12-17 00:00:00
end: 2025-01-16 00:00:00
period: 1h
basePeriod: 1h
exchanges: [{"eid":"Futures_Binance","currency":"BTC_USDT","balance":49999}]
*/

//@version=5
strategy(title="RSI Overbought and Oversold Levels - Mikel Vaquero", shorttitle="RSI Levels", overlay=true)

// Configuración del RSI
rsiLengthInput = input.int(14, minval=1, title="RSI Length")
rsiSourceInput = input.source(close, title="RSI Source")
rsiLevelOverbought = input(70, title="Overbought Level")
rsiLevelOversold = input(30, title="Oversold Level")
rsiLevelMiddle = input(50, title="Middle Level") // Nueva entrada para el nivel 50

// Configuración del stop loss y take profit en pips
stopLossPips = input.int(15, title="Stop Loss (pips)")
takeProfitPips = input.int(100, title="Take Profit (pips)")
partialProfitPips = input.int(50, title="Partial Profit (pips)")

// Configuración del horario de operación
startHour = input.int(8, title="Start Hour (GMT+2)", minval=0, maxval=23)
startMinute = input.int(0, title="Start Minute (GMT+2)", minval=0, maxval=59)
endHour = input.int(11, title="End Hour (GMT+2)", minval=0, maxval=23)
endMinute = input.int(0, title="End Minute (GMT+2)", minval=0, maxval=59)

// Calcular el RSI
up = ta.rma(math.max(ta.change(rsiSourceInput), 0), rsiLengthInput)
down = ta.rma(-math.min(ta.change(rsiSourceInput), 0), rsiLengthInput)
rsi = down == 0 ? 100 : up == 0 ? 0 : 100 - (100 / (1 + up / down))

// Condiciones de sobrecompra y sobreventa
overboughtCondition = ta.crossover(rsi, rsiLevelOverbought)
oversoldCondition = ta.crossunder(rsi, rsiLevelOversold)

// Plotear el RSI y los niveles
plot(rsi, "RSI", color=color.rgb(236, 222, 13))
hline(rsiLevelOverbought, "Overbought", color=color.rgb(6, 245, 6))
hline(rsiLevelOversold, "Oversold", color=color.rgb(243, 32, 4))
hline(rsiLevelMiddle, "Middle", color=color.blue) // Nueva línea para el nivel 50

// Plotear formas para las condiciones
plotshape(series=overboughtCondition, title="Overbought", location=location.top, color=color.rgb(26, 241, 6), style=shape.labeldown, text="B")
plotshape(series=oversoldCondition, title="Oversold", location=location.bottom, color=#fa0d05, style=shape.labelup, text="S")

// Condiciones de alerta
alertcondition(overboughtCondition, title='RSI Overbought', message='RSI has crossed above the overbought level')
alertcondition(oversoldCondition, title='RSI Oversold', message='RSI has crossed below the oversold level')

// Convertir los valores de pips a la escala de precios del gráfico
pipValue = syminfo.mintick * 10
stopLoss = stopLossPips * pipValue
takeProfit = takeProfitPips * pipValue
partialProfit = partialProfitPips * pipValue

// Configurar las horas de operación (horario español)
timeInRange = (hour(time, "GMT+2") > startHour or (hour(time, "GMT+2") == startHour and minute(time, "GMT+2") >= startMinute)) and (hour(time, "GMT+2") < endHour or (hour(time, "GMT+2") == endHour and minute(time, "GMT+2") < endMinute))

// Variables de estado para rastrear la señal actual
var bool longPositionTaken = false
var bool shortPositionTaken = false

// Estrategia de entrada y salida
if timeInRange
    if overboughtCondition and not longPositionTaken
        strategy.entry("Long", strategy.long)
        strategy.exit("Partial Take Profit", from_entry="Long", qty_percent=50, limit=close + partialProfit)
        strategy.exit("Stop Loss", from_entry="Long", stop=close - stopLoss)
        strategy.exit("Full Take Profit", from_entry="Long", limit=close + takeProfit)
        longPositionTaken := true
        shortPositionTaken := false

    if oversoldCondition and not shortPositionTaken
        strategy.entry("Short", strategy.short)
        strategy.exit("Partial Take Profit", from_entry="Short", qty_percent=50, limit=close - partialProfit)
        strategy.exit("Stop Loss", from_entry="Short", stop=close + stopLoss)
        strategy.exit("Full Take Profit", from_entry="Short", limit=close - takeProfit)
        shortPositionTaken := true
        longPositionTaken := false

// Ajustar el stop loss a breakeven después de tomar la ganancia parcial
if strategy.position_size > 0 and close >= strategy.position_avg_price + partialProfit
    strategy.exit("Move Stop to Breakeven", stop=strategy.position_avg_price, qty_percent=50)

if strategy.position_size < 0 and close <= strategy.position_avg_price - partialProfit
    strategy.exit("Move Stop to Breakeven", stop=strategy.position_avg_price, qty_percent=50)
Published by ChaoZhang on the FMZ strategy square · last modified 2025-01-17. Collected in the Quant Trading Vault. Unvalidated research: re-test with your own data and costs before trusting it.
Build this with AgenKit
A spec is not a trading system. Paste this into your coding agent and AgenKit runs a specialist team — architecture, test-first build, risk gates, review — with paper trading on by default.
/agenkit build a production-grade trading bot with a backtest engine, risk controls and paper trading by default from strategies/RSI-Dynamic-Breakout-Retracement-Trading-Strategy.md- npx agenkit install engineering-kit in your project
- Paste the command into your agent and approve each phase
- Get tests, backtest, risk controls and a paper-trading switch
Understand it first
Before you run this, read the lesson behind the idea and how to backtest it honestly. Specs like this one are the survivors of an unknown number of trials; deflate their results accordingly.
Related specs
- Multi Filter Trend Breakthrough Smart Moving Average Trading StrategyPine Script · Breakout · 1h
- Multi Indicator Momentum Breakout with Smoothed Candlestick Trading StrategyPine Script · Breakout · 6h
- Multi Indicator Trend Breakout Strategy with Dynamic Stop LossPine Script · Breakout · 1d
- Multi Technical Indicator Dynamic Wave Trading StrategyPine Script · Breakout · 1h
- Multi factor Intelligent Trading StrategyPine Script · Breakout · 1d
- Stochastic RSI and Volume Based Trading StrategyPine Script · Breakout · 2h