Strategy vault / Mean reversion
RSI Dynamic Drawdown Stop Loss Strategy
This strategy is based on the Wyckoff Methodology, combining the Relative Strength Index (RSI) and Volume Moving Average (Volume MA) to identify the accumulation and distribution phases of the market, generating buy…
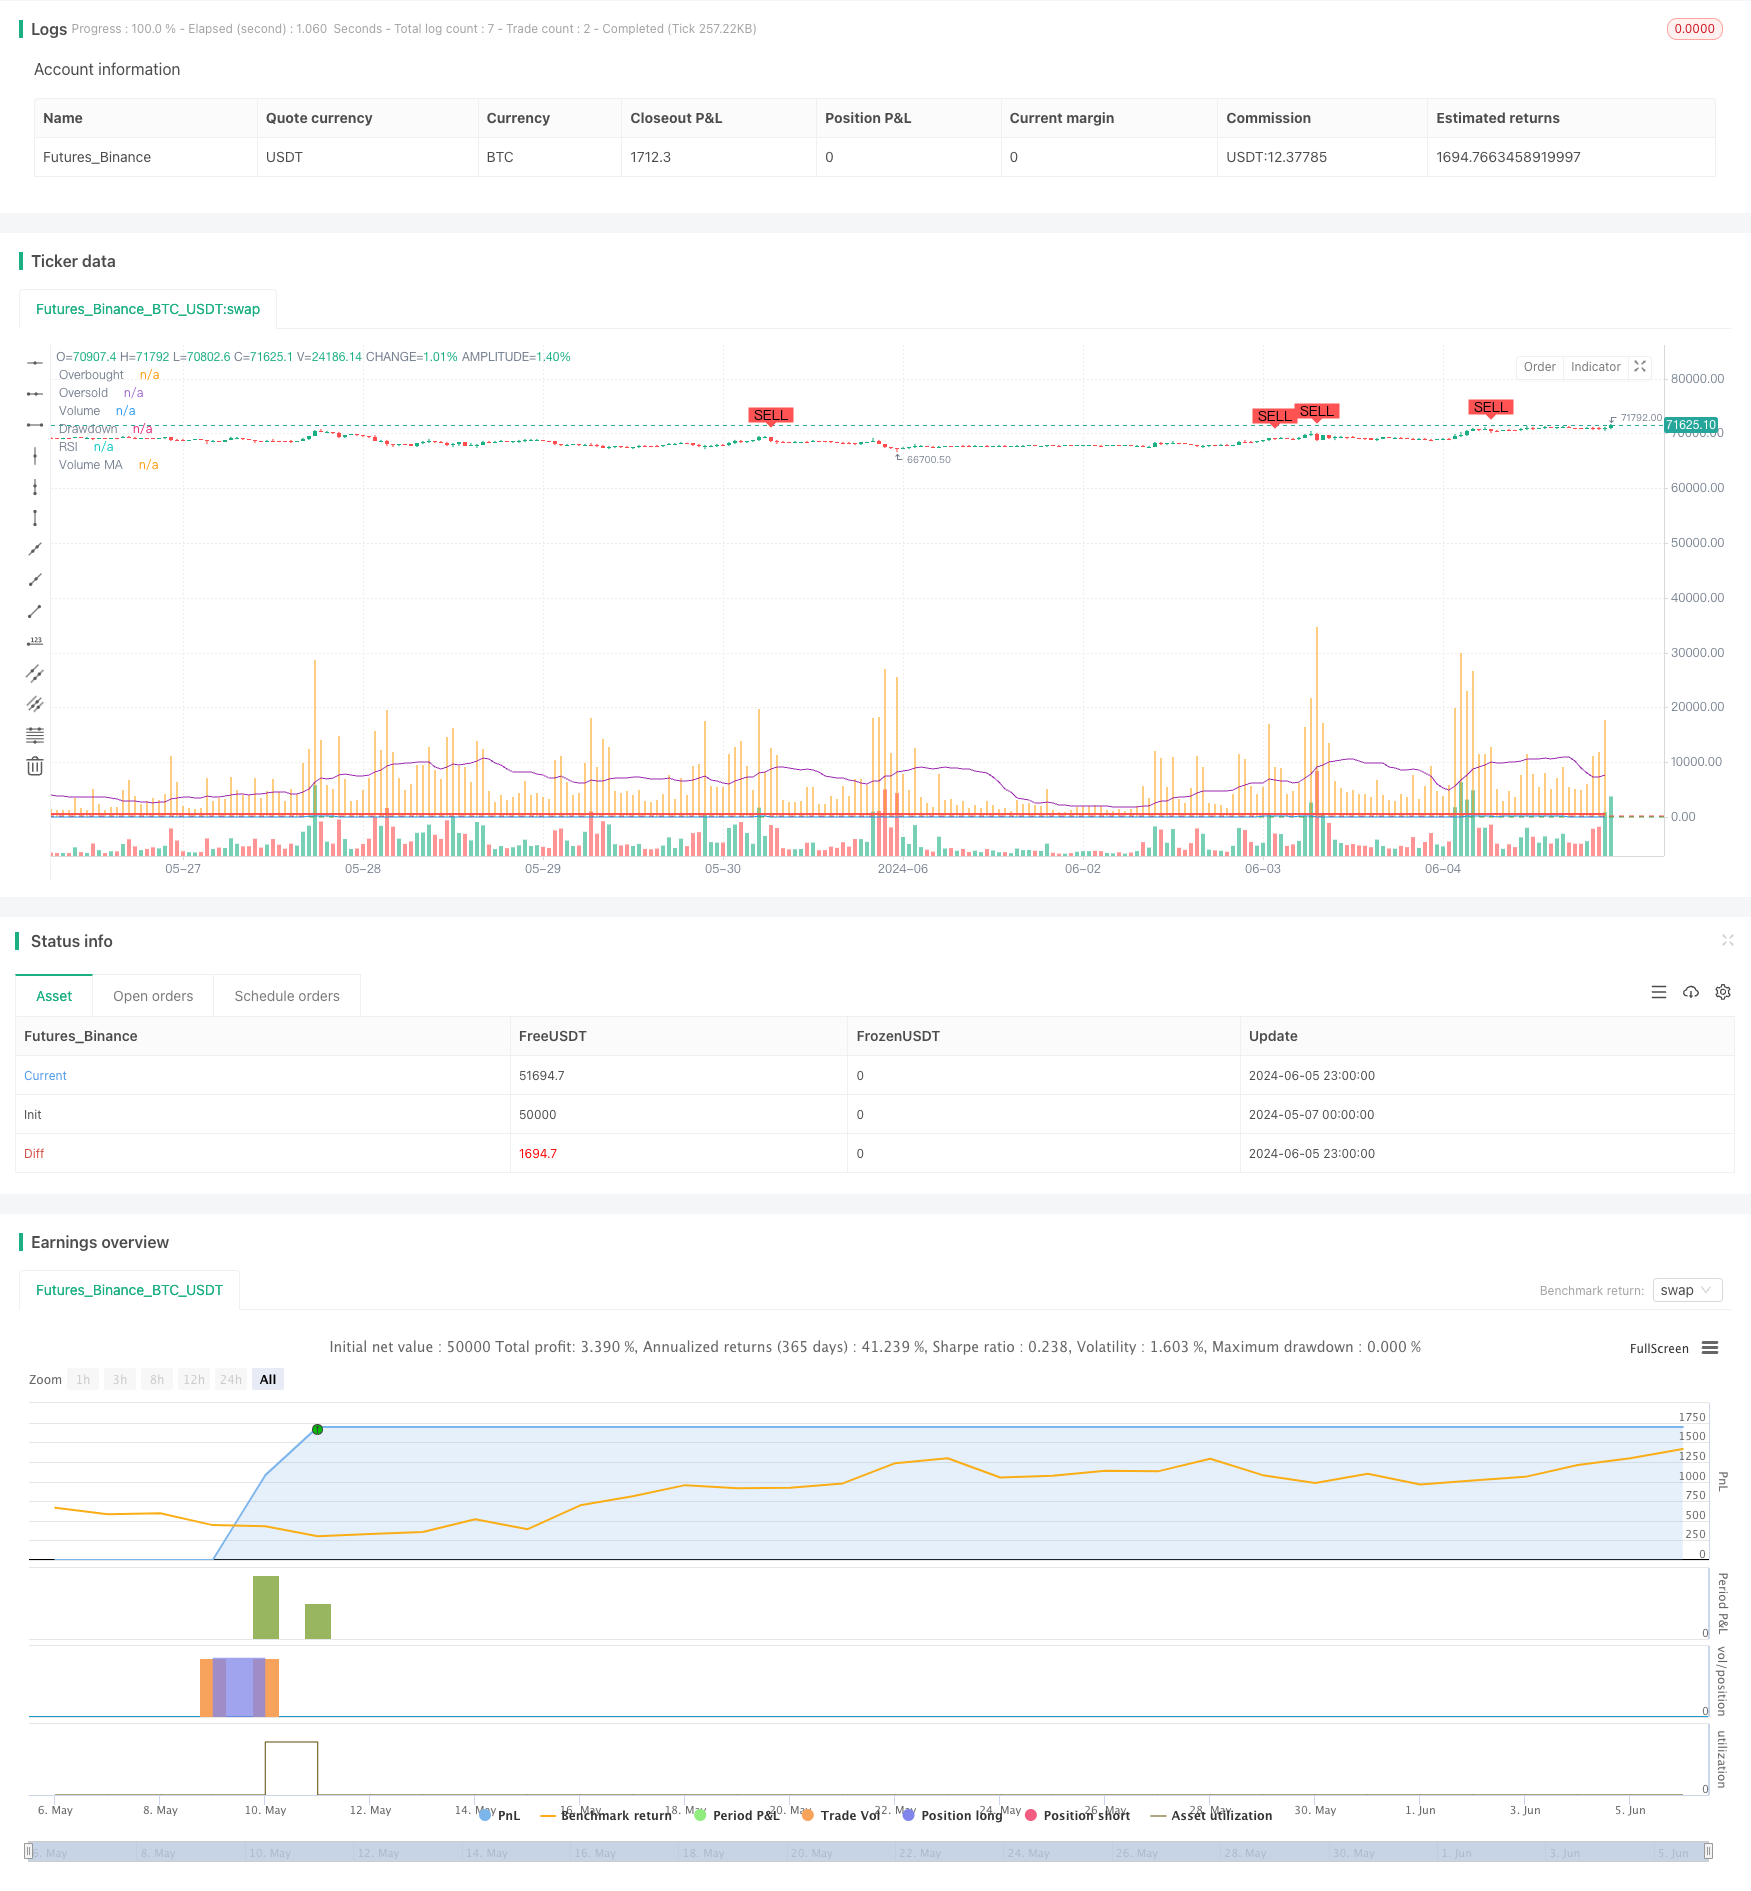
Overview
This strategy is based on the Wyckoff Methodology, combining the Relative Strength Index (RSI) and Volume Moving Average (Volume MA) to identify the accumulation and distribution phases of the market, generating buy and sell signals. Additionally, the strategy employs a dynamic drawdown stop-loss mechanism to control risk by setting a maximum drawdown threshold.
Strategy Principle
- Calculate the RSI indicator and Volume Moving Average.
- When the RSI crosses above the oversold area and the volume is greater than the Volume MA, it identifies the market's accumulation phase and generates a buy signal.
- When the RSI crosses below the overbought area and the volume is greater than the Volume MA, it identifies the market's distribution phase and generates a sell signal.
- The strategy simultaneously tracks the account's maximum equity and current drawdown. If the current drawdown exceeds the set maximum drawdown threshold, the strategy closes all positions.
- Buy positions are closed during the distribution phase or when the drawdown exceeds the maximum drawdown, while sell positions are closed during the accumulation phase or when the drawdown exceeds the maximum drawdown.
Strategy Advantages
- By combining RSI and volume indicators, the strategy can more accurately capture the accumulation and distribution phases of the market.
- The dynamic drawdown stop-loss mechanism effectively controls the strategy's maximum drawdown, reducing overall strategy risk.
- Suitable for 5-minute high-frequency data, allowing quick response to market changes and timely position adjustments.
Strategy Risks
- RSI and volume indicators may generate misleading signals under certain market conditions, leading to incorrect trading decisions by the strategy.
- The setting of the maximum drawdown threshold needs to be adjusted according to market characteristics and personal risk preferences; improper settings may lead to premature position closing or excessive risk-taking.
- The strategy may generate frequent trading signals in choppy markets, increasing trading costs.
Strategy Optimization Directions
- Consider introducing other technical indicators such as MACD, Bollinger Bands, etc., to improve the accuracy of the strategy's signals.
- Optimize the parameters of the RSI and volume indicators, such as adjusting the length of the RSI, overbought/oversold thresholds, etc., to adapt to different market conditions.
- In addition to drawdown stop-loss, incorporate trailing stop-loss or profit protection mechanisms to further control risk and lock in profits.
Summary
The RSI Dynamic Drawdown Stop-Loss Strategy identifies the accumulation and distribution phases of the market by combining RSI and volume indicators while employing a dynamic drawdown stop-loss mechanism to control risk. The strategy considers both market trend and risk management, making it practical to some extent. However, the strategy's performance depends on the choice of indicator parameters and market characteristics, requiring continuous optimization and adjustment to improve its stability and profitability.
Source Pine Script
/*backtest
start: 2024-05-07 00:00:00
end: 2024-06-06 00:00:00
period: 1h
basePeriod: 15m
exchanges: [{"eid":"Futures_Binance","currency":"BTC_USDT"}]
*/

//@version=5
strategy("Wyckoff Methodology Strategy with Max Drawdown", overlay=true)

// Define input parameters
length = input(14, title="RSI Length")
overbought = input(70, title="RSI Overbought Level")
oversold = input(30, title="RSI Oversold Level")
volume_length = input(20, title="Volume MA Length")
initial_capital = input(10000, title="Initial Capital")
max_drawdown = input(500, title="Max Drawdown")

// Calculate RSI
rsi = ta.rsi(close, length)

// Calculate Volume Moving Average
vol_ma = ta.sma(volume, volume_length)

// Identify Accumulation Phase
accumulation = ta.crossover(rsi, oversold) and volume > vol_ma

// Identify Distribution Phase
distribution = ta.crossunder(rsi, overbought) and volume > vol_ma

// Plot RSI
hline(overbought, "Overbought", color=color.red)
hline(oversold, "Oversold", color=color.green)
plot(rsi, title="RSI", color=color.blue)

// Plot Volume and Volume Moving Average
plot(volume, title="Volume", color=color.orange, style=plot.style_histogram)
plot(vol_ma, title="Volume MA", color=color.purple)

// Variables to track drawdown
var float max_equity = initial_capital
var float drawdown = 0.0

// Update max equity and drawdown
current_equity = strategy.equity
if (current_equity > max_equity)
    max_equity := current_equity
drawdown := max_equity - current_equity

// Generate Buy and Sell Signals
if (accumulation and drawdown < max_drawdown)
    strategy.entry("Buy", strategy.long)
if (distribution and drawdown < max_drawdown)
    strategy.entry("Sell", strategy.short)

// Plot Buy and Sell signals on chart
plotshape(series=accumulation, location=location.belowbar, color=color.green, style=shape.labelup, title="Buy Signal", text="BUY")
plotshape(series=distribution, location=location.abovebar, color=color.red, style=shape.labeldown, title="Sell Signal", text="SELL")

// Close positions if drawdown exceeds max drawdown
if (drawdown >= max_drawdown)
    strategy.close_all("Max Drawdown Exceeded")

// Set strategy exit conditions
strategy.close("Buy", when=distribution or drawdown >= max_drawdown)
strategy.close("Sell", when=accumulation or drawdown >= max_drawdown)

// Display drawdown on chart
plot(drawdown, title="Drawdown", color=color.red, linewidth=2, style=plot.style_stepline)
Published by ChaoZhang on the FMZ strategy square · last modified 2024-06-07. Collected in the Quant Trading Vault. Unvalidated research: re-test with your own data and costs before trusting it.
Build this with AgenKit
A spec is not a trading system. Paste this into your coding agent and AgenKit runs a specialist team — architecture, test-first build, risk gates, review — with paper trading on by default.
/agenkit build a production-grade trading bot with a backtest engine, risk controls and paper trading by default from strategies/RSI-Dynamic-Drawdown-Stop-Loss-Strategy.md- npx agenkit install engineering-kit in your project
- Paste the command into your agent and approve each phase
- Get tests, backtest, risk controls and a paper-trading switch
Understand it first
Before you run this, read the lesson behind the idea and how to backtest it honestly. Specs like this one are the survivors of an unknown number of trials; deflate their results accordingly.
Related specs
- Advanced 15 Minute Chart Trading Signal StrategyPine Script · Mean reversion · 3h
- CCTBBO Reversal Tracking StrategyPine Script · Mean reversion · 45m
- Multi Timeframe Gold Reversal Tracking StrategyPine Script · Mean reversion · 2h
- Price Volatility Mean Reversion StrategyPine Script · Mean reversion · 2d
- Reversal Bollinger Band RSI MACD Quant StrategyPine Script · Mean reversion · 4h
- Bollinger Bands and VWAP based Quantitative Trading StrategyPine Script · Mean reversion · 1h