Strategy vault / Mean reversion
RSI Indicator Based Moving Stop Loss Buy Sell Strategy
This strategy sets the buy signal line and sell signal line based on the RSI indicator, combined with moving stop loss to achieve automated buying and selling. It sends a buy signal when the RSI indicator is lower…
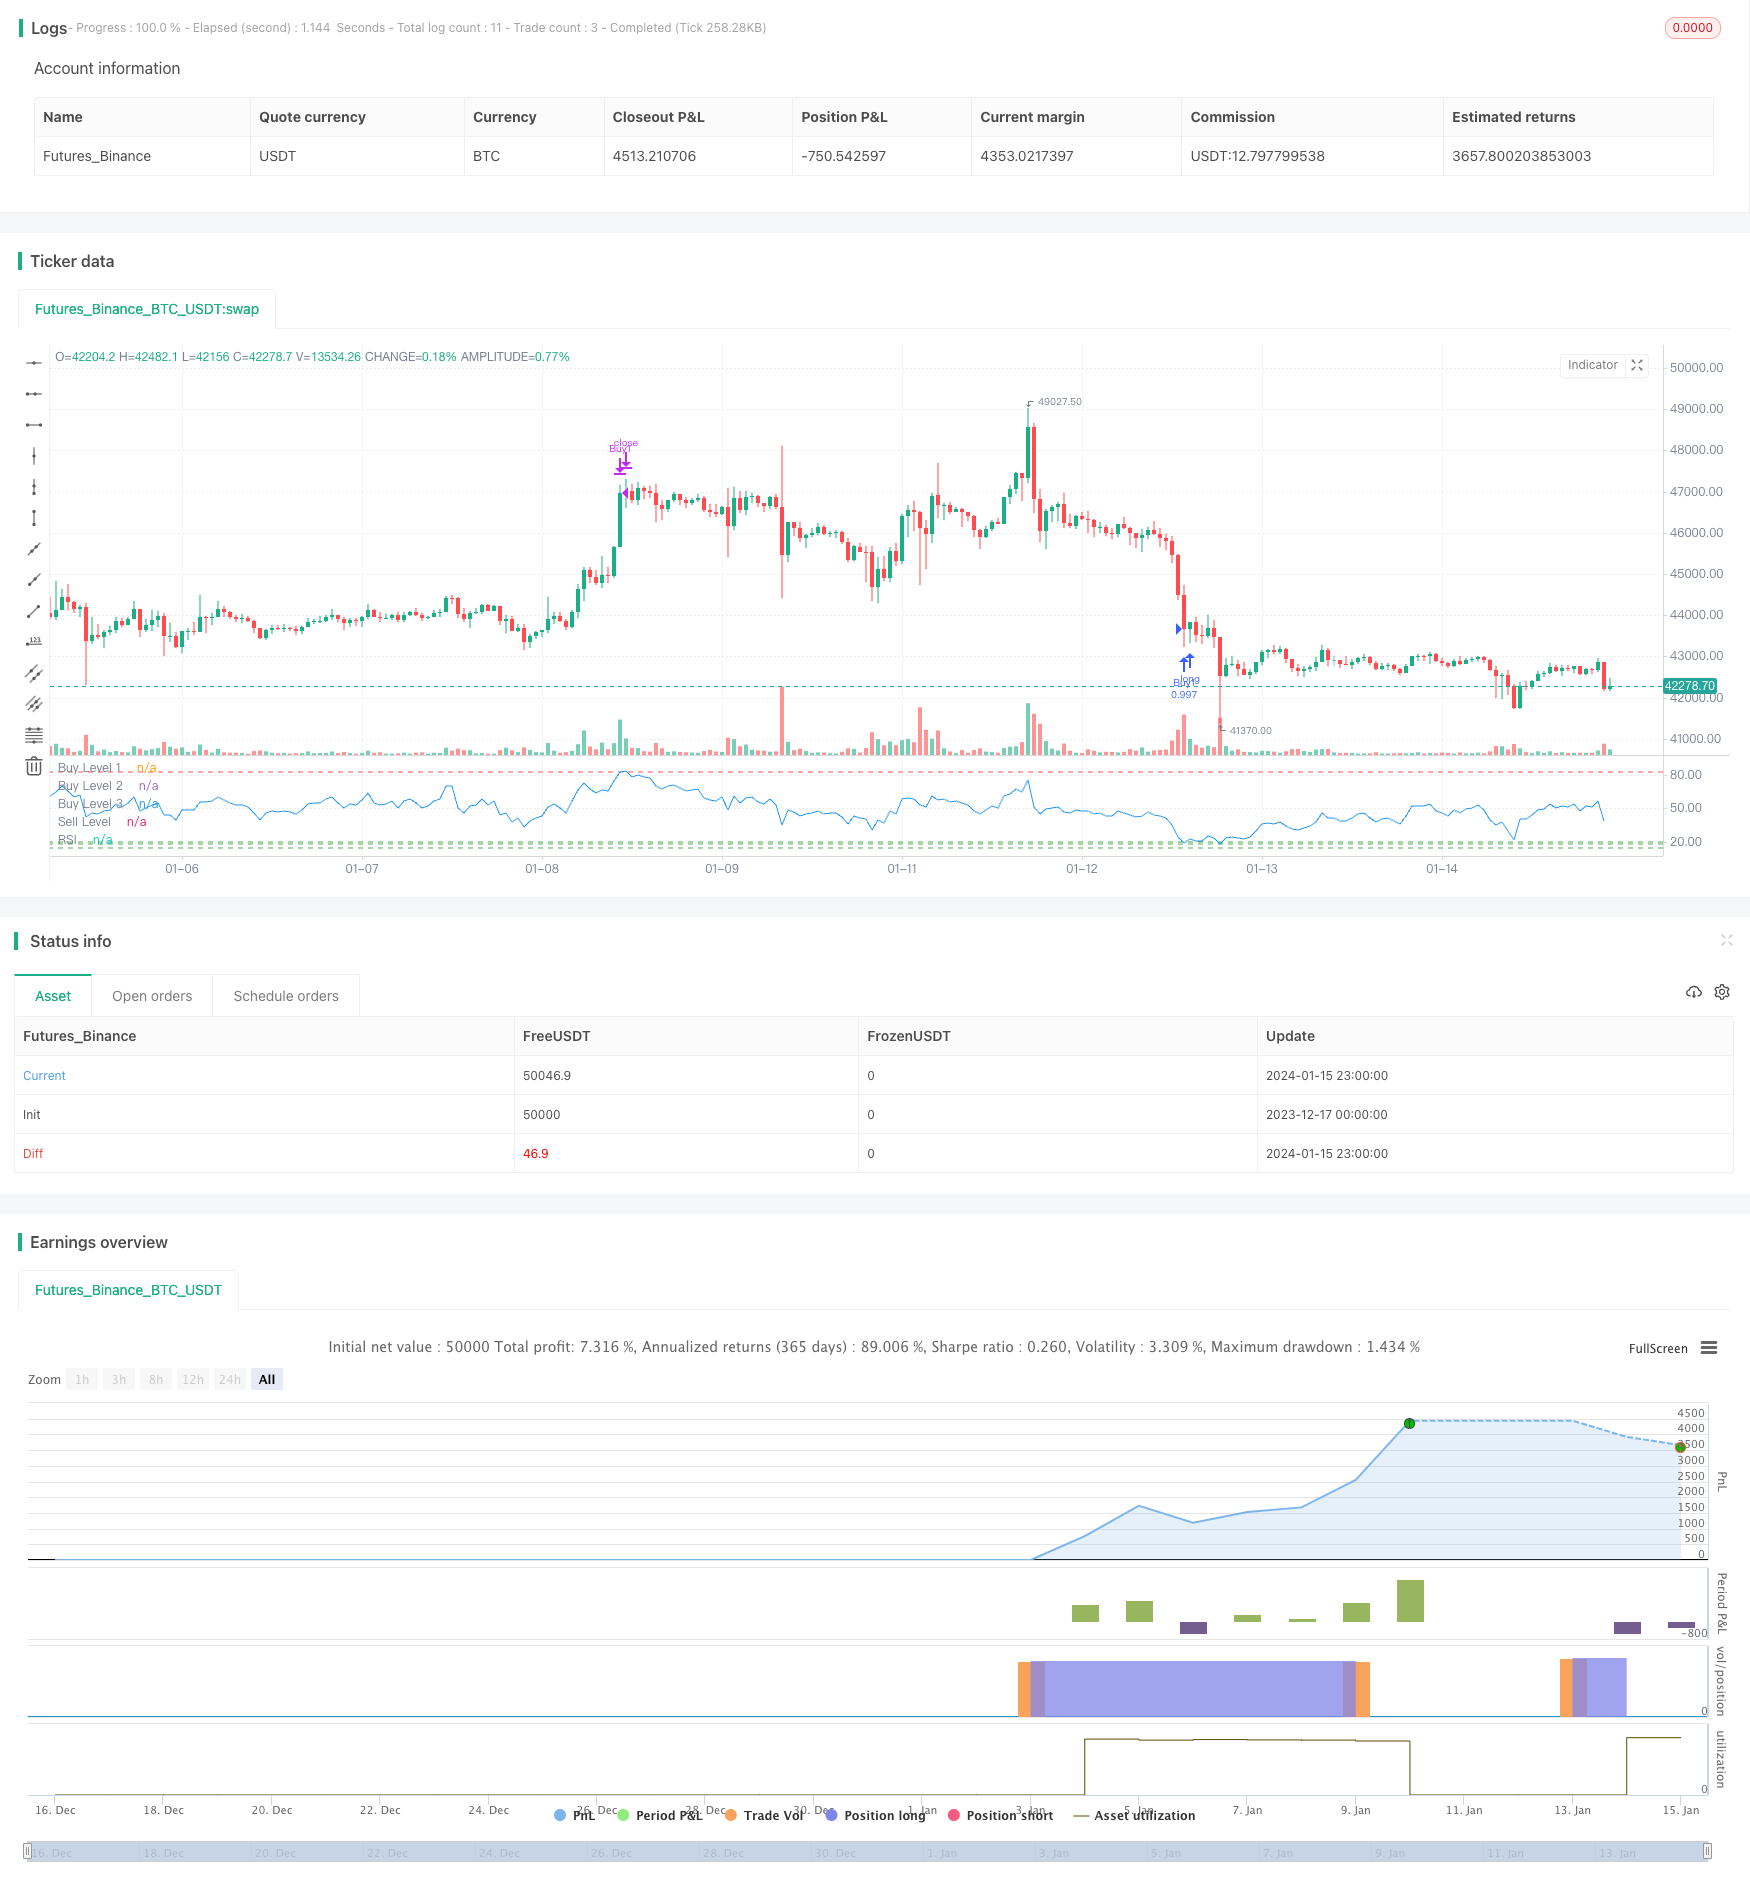
Overview
This strategy sets the buy signal line and sell signal line based on the RSI indicator, combined with moving stop loss to achieve automated buying and selling. It sends a buy signal when the RSI indicator is lower than the buy signal line, and a sell signal when the RSI indicator is higher than the sell signal line. At the same time, it sets a moving stop loss to lock in profits and control risks.
Strategy Principle
This strategy is mainly based on the overbought and oversold zones of the RSI indicator to determine entry and exit timing. RSI below 20 is considered oversold, and above 80 is considered overbought. The strategy sets three RSI low buy signal lines at 20, 18, and 14. When the closing price is higher than the previous day and the RSI indicator is below the corresponding buy line, a buy signal is issued. The strategy sets an RSI high sell signal line at 83. When the RSI indicator is higher than this sell line, a sell signal is issued. In addition, the strategy also sets a moving stop loss. If the price falls below 5% of the buy price, it will stop loss sell.
The whole strategy judges the timing of buying and selling through the overbought and oversold zones of the RSI indicator, and sets a stop loss to lock in profits and control risks. It is a typical quantitative trading strategy based on technical indicators.
Advantage Analysis
The advantages of this strategy include:
Use the classic and widely verified RSI indicator to determine trading points and effectively capture overbought and oversold opportunities.
Setting multiple buy lines allows split buying at different low prices, reducing the cost of buying.
Configuring a moving stop loss to control losses and lock in profits can effectively manage risks.
The strategy logic is simple and clear, easy to understand and modify, and easy to verify in live trading.
RSI indicator parameters can be customized and adjusted for different products and markets.
Risk Analysis
There are also some risks to this strategy:
Relying on a single indicator, it is prone to false signals and the RSI indicator signals may not be accurate.
There is no profit taking strategy, risks of letting losses expand.
There are risks of the overbought and oversold zone breakdowns, especially in range-bound markets.
In extreme market conditions, prices may break through the stop loss line directly and fail to stop loss.
The solutions are:
Use multiple indicators combined to avoid false signals.
Add profit taking strategies like zones or sar.
Adjust RSI parameters to narrow the overbought/oversold zones.
Use dynamic stop loss or manual intervention when necessary.
Optimization Directions
The strategy can be optimized in the following aspects:
Combine other indicators to form an indicator portfolio to avoid false signals, such as RSI + KDJ, RSI + MACD.
Add profit taking strategies like trailing stop loss, time-based exit, moving exit channel.
Parameter optimization, adjust RSI parameters based on different products and timeframes.
Strategy derivatives such as reversal strategies, scaling in strategies.
Narrow the buy/sell zones appropriately to avoid false signals.
Conclusion
In summary, this is a typical quantitative trading strategy based on RSI indicator by setting buy/sell signals. The strategy is simple and easy to implement, but relies on a single indicator with high risks of no profit taking. We can further improve it through parameter tuning, strategy combo, adding profit taking mechanisms etc.
Parameters
| Name | Default | What it controls |
|---|---|---|
| v_input_1 | 12 | RSI Period |
| v_input_2 | 83 | RSI Sell Level |
| v_input_3 | 5 | Stop Percentage |
Source Pine Script
/*backtest
start: 2023-12-17 00:00:00
end: 2024-01-16 00:00:00
period: 1h
basePeriod: 15m
exchanges: [{"eid":"Futures_Binance","currency":"BTC_USDT"}]
*/

//@version=5
strategy("RSI Buy/Sell Strategy", overlay=false)

// Input for RSI period
rsiPeriod = input(12, title="RSI Period")

// Input for RSI levels
rsiBuyLevel1 = 20
rsiBuyLevel2 = 18
rsiBuyLevel3 = 14
rsiSellLevel = input(83, title="RSI Sell Level")

// Input for stop loss percentage
stopLossPercent = input(5, title="Stop Percentage")

// Calculate RSI
rsiValue = ta.rsi(close, rsiPeriod)

// Buy Conditions: RSI below buy levels
buyCondition1 = close[1] > close and rsiValue <= rsiBuyLevel1
buyCondition2 = close[1] > close and rsiValue <= rsiBuyLevel2
buyCondition3 = close[1] > close and rsiValue <= rsiBuyLevel3

// Sell Conditions: RSI above sell level or stop loss
sellCondition = (rsiValue > rsiSellLevel )//or ( close[1] < close * (1 - stopLossPercent / 100))

// Calculate position size based on 10% of current equity
positionSize = strategy.equity * 0.8 / close

// Plot RSI on the chart
plot(rsiValue, title="RSI", color=color.blue)

// Plot horizontal lines for buy and sell levels
hline(rsiBuyLevel1, "Buy Level 1", color=color.green)
hline(rsiBuyLevel2, "Buy Level 2", color=color.green)
hline(rsiBuyLevel3, "Buy Level 3", color=color.green)
hline(rsiSellLevel, "Sell Level", color=color.red)

// Execute Buy and Sell orders with stop loss
strategy.entry("Buy1", strategy.long, when = buyCondition1, qty = positionSize,stop=close * stopLossPercent / 100)
strategy.entry("Buy2", strategy.long, when = buyCondition2, qty = positionSize,stop=close * stopLossPercent / 100)
strategy.entry("Buy3", strategy.long, when = buyCondition3, qty = positionSize,stop=close * stopLossPercent / 100)

strategy.close("Buy1", when = sellCondition)
strategy.close("Buy2", when = sellCondition)
strategy.close("Buy3", when = sellCondition)
Published by ChaoZhang on the FMZ strategy square · last modified 2024-01-17. Collected in the Quant Trading Vault. Unvalidated research: re-test with your own data and costs before trusting it.
Build this with AgenKit
A spec is not a trading system. Paste this into your coding agent and AgenKit runs a specialist team — architecture, test-first build, risk gates, review — with paper trading on by default.
/agenkit build a production-grade trading bot with a backtest engine, risk controls and paper trading by default from strategies/RSI-Indicator-Based-Moving-Stop-Loss-Buy-Sell-Strategy.md- npx agenkit install engineering-kit in your project
- Paste the command into your agent and approve each phase
- Get tests, backtest, risk controls and a paper-trading switch
Understand it first
Before you run this, read the lesson behind the idea and how to backtest it honestly. Specs like this one are the survivors of an unknown number of trials; deflate their results accordingly.
Related specs
- Combining Simple Moving Average and Adaptive Moving Average StrategyPine Script · Mean reversion · 5m
- Multi Dimensional Technical Indicator Cross Confirmation Buy Signal Optimization StrategyPine Script · Mean reversion · 1d
- Multi Indicator Synergistic SAR Reversal Strategy with Filtered Entry ModelPine Script · Mean reversion · 3h
- Combined Moving Average and Infinite Impulse Response Line StrategyPine Script · Mean reversion · 1m
- MACD RSI and EMA StrategyPine Script · Mean reversion · 1d
- Momentum Reversal Moving Average Combination StrategyPine Script · Mean reversion · 3m