Strategy vault / Mean reversion
RSI Mean Reversion Trading Strategy 430760
This strategy uses the RSI indicator to identify trends and overbought/oversold conditions. Combined with EMA to determine current trend direction, it opens reverse positions when the trend direction is consistent…
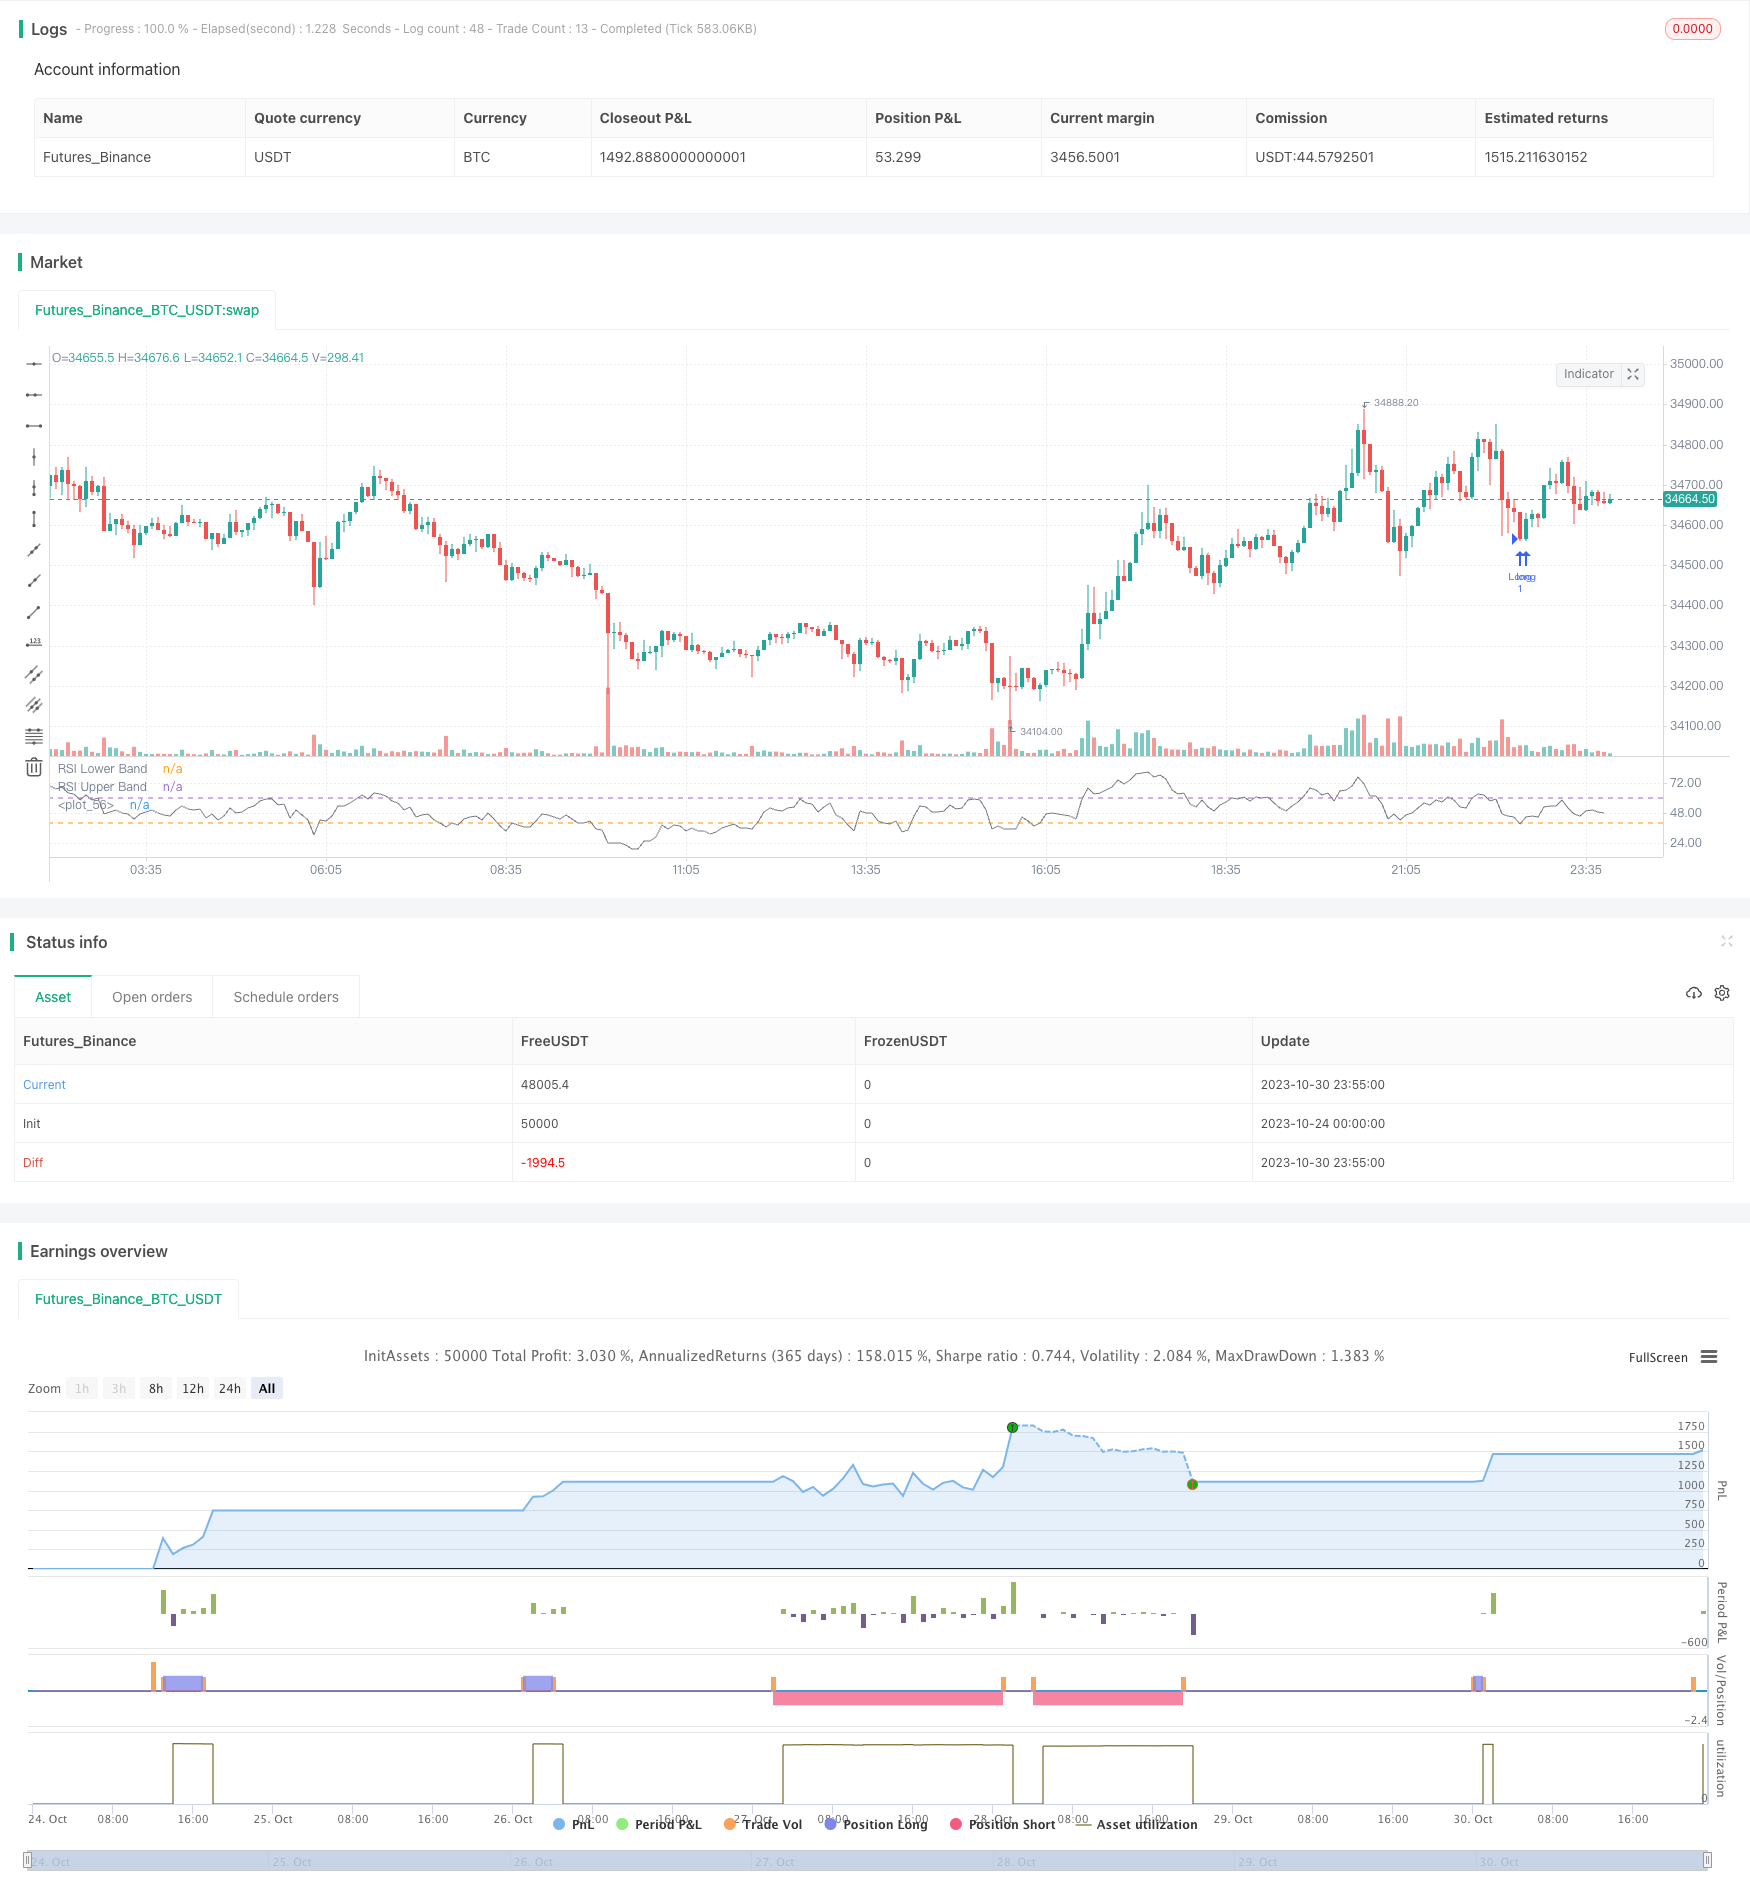
Overview
This strategy uses the RSI indicator to identify trends and overbought/oversold conditions. Combined with EMA to determine current trend direction, it opens reverse positions when the trend direction is consistent with RSI signals to implement mean reversion trading.
Strategy Logic
Use EMA indicator to determine current trend direction. Above EMA defines an uptrend while below EMA defines a downtrend.
Use RSI indicator to identify overbought/oversold conditions. RSI above 60 is overbought zone and below 40 is oversold zone.
When uptrend and RSI below 40, a buy signal is triggered. When downtrend and RSI above 60, a sell signal is triggered.
When buy/sell signals triggered, take profit and stop loss prices are set based on certain percentage of entry price.
When position size greater than 0, take profit order is placed. When position size less than 0, stop loss order is placed.
Advantage Analysis
The strategy reasonably combines EMA and RSI to identify trends and overbought/oversold conditions, avoiding trading against trends.
The mean reversion approach catches short-term rotations for profits.
Take profit and stop loss points help lock in profits and control risks.
Simple and clear logic, easy to understand and implement, suitable for beginners.
Parameters like EMA period and RSI can be optimized for different products and market environments.
Risk Analysis
Failed reversal risk. Short-term reversal may fail, resulting in losses.
Unclear trend risk. EMA may fail to identify a clear trend in ranging markets, generating wrong signals.
Stop loss triggered risk. Stop loss set too close may be unexpectedly triggered.
Overfitting risk. Excessive optimization on historical data may not apply for live trading.
High trading frequency risk. Too frequent trading incurs significant transaction costs.
Improvement
Optimize EMA and RSI parameters to find best combination through backtesting.
Add filters to avoid wrong signals in ranging market. For example, add volume condition.
Optimize take profit/stop loss ratio to lock in profits. Stop loss should not be too wide.
Add position sizing rules like fixed fraction to control single trade loss.
Combine other indicators like MACD, KD to improve signal accuracy or use multivariate models.
Backtest on live data and continuously optimize for latest market conditions.
Conclusion
This strategy implements a short-term mean reversion approach based on EMA and RSI, with clear logic of trend identification and overbought/oversold detection. It sets take profit and stop loss to control risks while profiting from short-term rotations. The simplicity and clarity are its advantages. Further optimizations can yield good backtest results. But risks like failed reversal and ranging market should be noted for live trading. Overall it provides a simple and practical short-term trading idea for beginners to learn from.
Parameters
| Name | Default | What it controls |
|---|---|---|
| v_input_1 | true | Long Entry |
| v_input_2 | true | Short Entry |
| v_input_3 | 100 | EMA Length |
| v_input_float_2 | true | Short Take Profit |
| v_input_float_4 | 1.5 | Short Stop Loss |
| v_input_float_1 | true | (?Take Profit Percentage)Long Take Profit |
| v_input_float_3 | 1.5 | (?Stop Percentage)Long Stop Loss |
Source Pine Script
/*backtest
start: 2023-10-24 00:00:00
end: 2023-10-31 00:00:00
period: 5m
basePeriod: 1m
exchanges: [{"eid":"Futures_Binance","currency":"BTC_USDT"}]
*/

// This source code is subject to the terms of the Mozilla Public License 2.0 at https://mozilla.org/MPL/2.0/
// © Sarahann999
//@version=5
strategy("RSI Strategy", shorttitle="RSI", overlay= false)

//Inputs
long_entry = input(true, title='Long Entry')
short_entry = input(true, title='Short Entry')
emaSettings = input(100, 'EMA Length')
ema = ta.ema(close,emaSettings)
rsi = ta.rsi(close,14)

//Conditions
uptrend = close > ema
downtrend = close < ema
OB = rsi > 60
OS = rsi < 40
buySignal = uptrend and OS and strategy.position_size == 0
sellSignal = downtrend and OB and strategy.position_size == 0

//Calculate Take Profit Percentage
longProfitPerc = input.float(title="Long Take Profit", group='Take Profit Percentage',
     minval=0.0, step=0.1, defval=1) / 100
shortProfitPerc = input.float(title="Short Take Profit",
     minval=0.0, step=0.1, defval=1) / 100

// Figure out take profit price 1
longExitPrice  = strategy.position_avg_price * (1 + longProfitPerc)
shortExitPrice = strategy.position_avg_price * (1 - shortProfitPerc)

// Make inputs that set the stop %  1
longStopPerc = input.float(title="Long Stop Loss", group='Stop Percentage',
     minval=0.0, step=0.1, defval=1.5) / 100
shortStopPerc = input.float(title="Short Stop Loss",
     minval=0.0, step=0.1, defval=1.5) / 100

// Figure Out Stop Price
longStopPrice  = strategy.position_avg_price * (1 - longStopPerc)
shortStopPrice = strategy.position_avg_price * (1 + shortStopPerc)

// Submit entry orders
if buySignal and long_entry
    strategy.entry(id="Long", direction=strategy.long, alert_message="Enter Long")

if sellSignal and short_entry
    strategy.entry(id="Short", direction=strategy.short, alert_message="Enter Short")

//Submit exit orders based on take profit price
if (strategy.position_size > 0)
    strategy.exit(id="Long TP/SL", limit=longExitPrice, stop=longStopPrice, alert_message="Long Exit 1 at {{close}}")
if (strategy.position_size < 0)
    strategy.exit(id="Short TP/SL", limit=shortExitPrice, stop=shortStopPrice, alert_message="Short Exit 1 at {{close}}")

//note: for custom alert messages to read, "{{strategy.order.alert_message}}" must be placed into the alert dialogue box when the alert is set.

plot(rsi, color= color.gray)
hline(40, "RSI Lower Band")
hline(60, "RSI Upper Band")Published by ChaoZhang on the FMZ strategy square · last modified 2023-11-01. Collected in the Quant Trading Vault. Unvalidated research: re-test with your own data and costs before trusting it.
Build this with AgenKit
A spec is not a trading system. Paste this into your coding agent and AgenKit runs a specialist team — architecture, test-first build, risk gates, review — with paper trading on by default.
/agenkit build a production-grade trading bot with a backtest engine, risk controls and paper trading by default from strategies/RSI-Mean-Reversion-Trading-Strategy-430760.md- npx agenkit install engineering-kit in your project
- Paste the command into your agent and approve each phase
- Get tests, backtest, risk controls and a paper-trading switch
Understand it first
Before you run this, read the lesson behind the idea and how to backtest it honestly. Specs like this one are the survivors of an unknown number of trials; deflate their results accordingly.
Related specs
- ATR and EMA based Dynamic Take Profit and Stop Loss Adaptive StrategyPine Script · Mean reversion · 1h
- Advanced 15 Minute Chart Trading Signal StrategyPine Script · Mean reversion · 3h
- BONK Multi Factor Trading StrategyPine Script · Mean reversion · 1d
- Chaikin Oscillator StrategyPine Script · Mean reversion · 3h
- Customizable Non Repainting HTF MACD MFI Scalable Bot StrategyPine Script · Mean reversion · 1d
- Dynamic Adaptive Multi Timeframe Trend Following and Range Reversal Hybrid StrategyPine Script · Mean reversion · 2d