Strategy vault / Mean reversion
RSI Reversal Trading Strategy 432118
The RSI reversal trading strategy is a quantitative trading strategy that identifies overbought and oversold conditions using the Relative Strength Index (RSI) indicator and enters long or short trades at reversal…
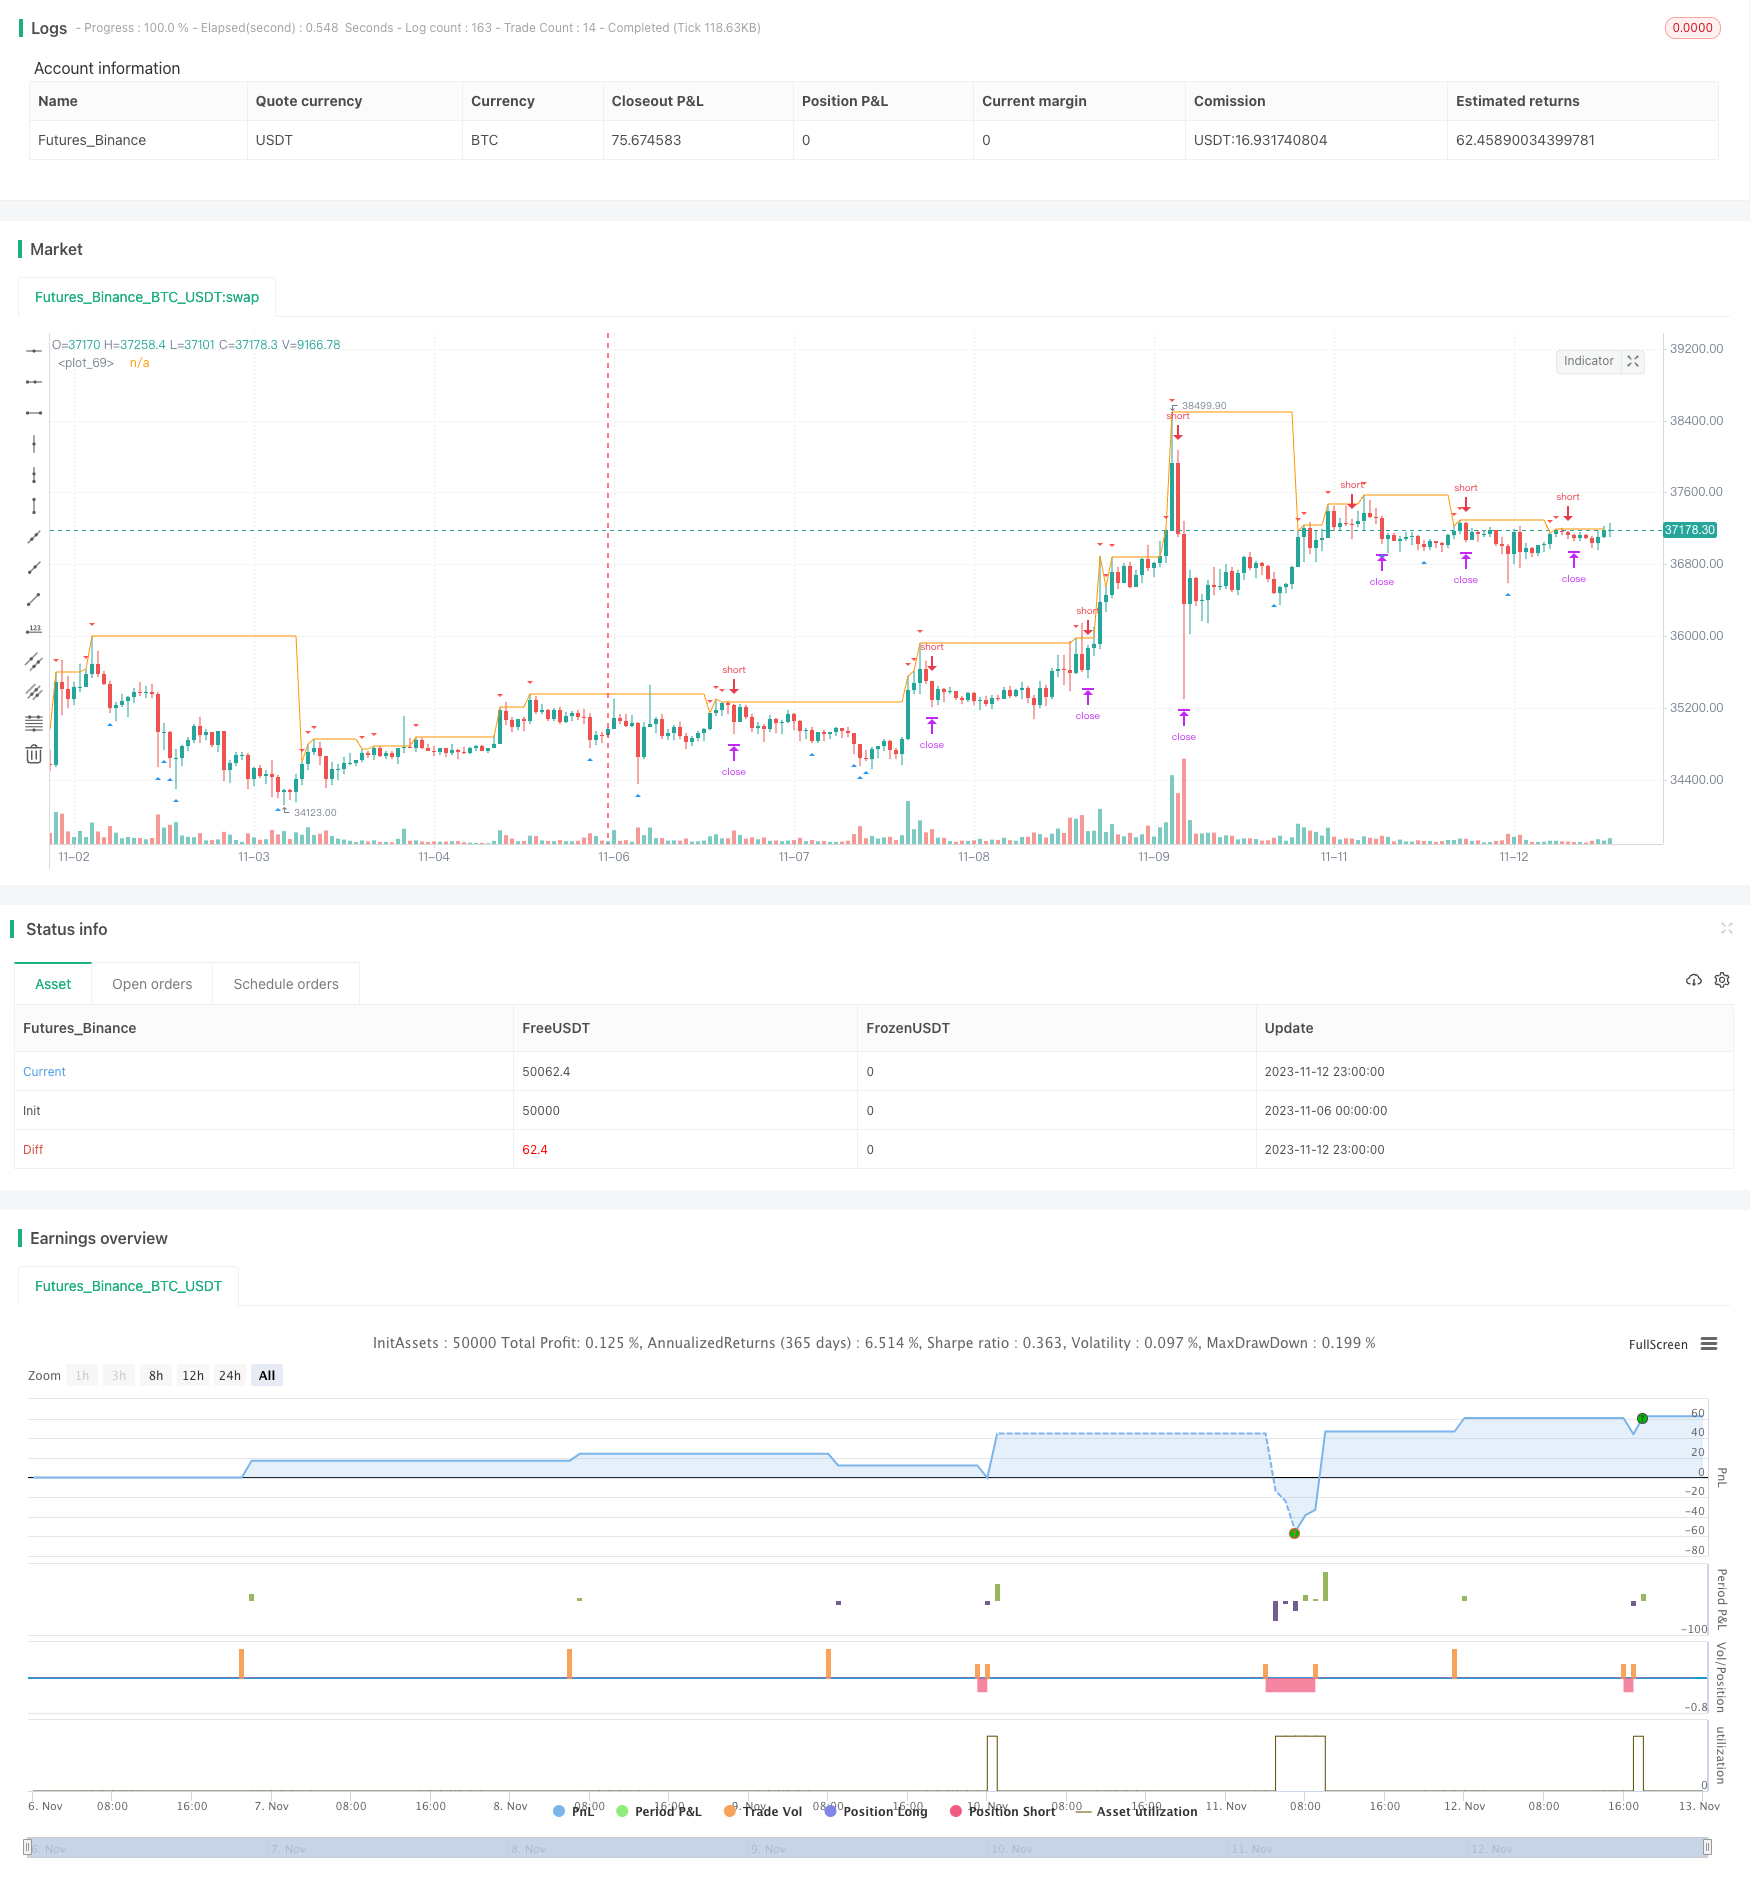
Overview
The RSI reversal trading strategy is a quantitative trading strategy that identifies overbought and oversold conditions using the Relative Strength Index (RSI) indicator and enters long or short trades at reversal points. This strategy sets RSI overbought and oversold threshold levels and goes short when RSI enters the overbought zone and goes long when RSI enters the oversold zone to capture price reversals.
Strategy Logic
The strategy is based on the following core logic:
RSI can reflect whether the current market is overbought or oversold. RSI measures the relative momentum of upside vs downside by calculating the ratio of average up changes to average down changes over a period of time.
When RSI enters the overbought zone (usually regarded as RSI above 70), it indicates strong upside momentum. There will be more traders long holding bullish positions and the room for continuing upside is limited. The price may reverse downwards to correct the overbought condition.
When RSI enters the oversold zone (usually below 30), it indicates strong downside momentum. There will be more traders short holding bearish positions and the room for continuing downside is limited. The price may reverse upwards to correct the oversold condition.
Therefore, we can set the RSI overbought threshold at 90 and oversold threshold at 10. Go short when RSI enters the overbought zone and go long when RSI enters the oversold zone to capture reversals.
Specifically, the strategy logic is:
Calculate the RSI indicator value, using close price as the RSI source, with a length of 2 periods.
When RSI crosses above 90, it indicates entering the overbought zone, go short. When RSI crosses below 10, it indicates entering the oversold zone, go long.
Set a stop loss for each trade. Long stop at lowest low price, short stop at highest high price.
Set a trailing stop for each trade. If RSI continues into more extreme overbought/oversold levels, adjust the trailing stop to give more room.
Consider taking profit when RSI reverts back to neutral zone around 50.
If no reversal after 3 bars, close trade to avoid unlimited loss.
Advantages
The RSI reversal strategy has the following advantages:
Using RSI to identify overbought/oversold conditions can effectively capture market reversal points. RSI is accurate in judging extremes and has high reversal success rate.
Reversal strategies have systematic edge of continuing to follow trends. It can go short on overbought and long on oversold timely to avoid being trapped.
The stop loss mechanism effectively controls the loss on individual trades. Even if reversal fails, loss is contained within certain range.
Trailing stop can flexibly adjust stop distance based on continued price movement, balancing between keeping stop triggered and capturing more price difference.
Forced exit after fixed bars ensures trades without timely reversal will not lead to unlimited losses.
Adjustable RSI parameters can adapt the strategy to different markets.
Risks
The strategy also has the following risks:
As a technical indicator strategy, RSI reversal performance may have curve fitting bias. Real trading reversal success rate may be lower than backtest results.
Although RSI can identity overbought/oversold conditions, it cannot predict the exact reversal timing. Risk of no reversal after entry and price continues trending.
RSI overbought/oversold levels may not be reasonably set. Wrong levels may lead to missing reversals or getting stopped out before reversals.
Probability of price making another reversal before reaching take profit. Take profit may not get filled.
Stop loss distance set unreasonably tight or too loose may render stops ineffective.
Trading commissions can also impact strategy profitability.
Enhancements
The strategy can be enhanced in the following ways:
Test different RSI parameters to find optimal combinations, such as RSI length, overbought/oversold threshold levels.
Add more filters to avoid false reversal signals, such as combining with MACD etc to increase probability.
Optimize stop loss strategy, e.g. ATR based stops, volatility adjusted distances.
Optimize take profit strategy, such as moving take profit, trailing more price difference.
Add machine learning models to assist judging reversals and improve success rate.
Test strategy across different markets and instruments to find best parameters for real trading.
Combine with trading volume, only consider reversal signals when volume surges.
Conclusion
In conclusion, the RSI reversal strategy takes advantage of RSI's strength in identifying overbought and oversold market conditions and trades at reversal points, providing decent systematic returns. But it also has risks that need to be addressed through RSI parameters and stop/take profit optimization, and filtering with other indicators. If executed properly, RSI reversal can form an effective component in a quantitative trading system.
Parameters
| Name | Default | What it controls |
|---|---|---|
| v_input_1 | 2 | RSI Length |
| v_input_2_close | 0 | RSI Source: close | high | low | open | hl2 | hlc3 | hlcc4 | ohlc4 |
Source Pine Script
/*backtest
start: 2023-11-06 00:00:00
end: 2023-11-13 00:00:00
period: 1h
basePeriod: 15m
exchanges: [{"eid":"Futures_Binance","currency":"BTC_USDT"}]
*/

//@version=4
// Copyright (c) 2021-present, RicMos
//study("RSI2 Sell Strategy, overlay=true)

//------------------------------------------USER VARIABLE DEFINITIONS --------------------------------------
var float lots = 0.1
//var float fixed_commission = 0.6 // forex pairs commission  value USD per position size two sides
var float fixed_commission = 10 // BTC commission value USD per position size two sides
//var float money = 10000 //forex pairs position size
var float money = 0.3333 //BTC position size


strategy(title="RSI2 Sell Strategy", commission_type=strategy.commission.cash_per_order, calc_on_every_tick =true, commission_value = fixed_commission/2, overlay=true, default_qty_value= lots*100000, initial_capital=1000, currency = "USD", calc_on_order_fills = false)
len = input(2, minval=1, title="RSI Length")
src = input(close, "RSI Source", type = input.source)
upRsi = rma(max(change(src), 0), len)
downRsi = rma(-min(change(src), 0), len)
rsi = downRsi == 0 ? 100 : upRsi == 0 ? 0 : 100 - (100 / (1 + upRsi / downRsi))
var color buyColor = color.blue
var color sellColor = color.red


plotshape(rsi <= 10 ? low : na, title="Arrow Up", style=shape.triangleup, location=location.belowbar, size=size.tiny, color=buyColor)
plotshape(rsi >= 90 ? high : na, title="Arrow Down", style=shape.triangledown, location=location.abovebar, size=size.tiny, color=sellColor)


// long = rsi <= 10
// var float longsl = 0
// var int long_ts_points = 0

// if long
//     longsl:= low
//     long_ts_points := 200

// if rsi >= 70
//     long_ts_points := 100
// else if rsi >= 80
//     long_ts_points := 80


// plot (longsl)
// var int barsPassed = 0
// barsPassed := barssince(long)
// if long
//     strategy.entry("long", long = strategy.long, qty = 10000, stop = high)
// strategy.exit("slLo", from_entry="long", stop = longsl-0.0002, trail_points = long_ts_points )
// //strategy.close("long", when = rsi[1]>=50 and rsi < 50 , comment = "rsi under 50" )
// strategy.cancel_all(barsPassed > 3  and not long)


short = rsi >= 90
var float shortsl = 0
var int short_ts_points = 0
//var bool stClose = 0

if short
    shortsl:= high
    short_ts_points := 200

if rsi <= 30
    short_ts_points := 100
    //stClose :=1
else if rsi <= 20
    short_ts_points := 80
//else
    //stClose := 0

plot (shortsl)
var int barsPassedSh = 0
barsPassedSh := barssince(short)
if short
    strategy.entry("short", long = strategy.short, qty = money, stop = low)
strategy.exit("slSh", from_entry="short", stop = shortsl, trail_points = short_ts_points, trail_offset =20 )
//strategy.close("short", comment="rsi<30", when = stClose)


//strategy.close("long", when = rsi[1]>=50 and rsi < 50 , comment = "rsi under 50" )
strategy.cancel_all(barsPassedSh > 3  and not short)
Published by ChaoZhang on the FMZ strategy square · last modified 2023-11-14. Collected in the Quant Trading Vault. Unvalidated research: re-test with your own data and costs before trusting it.
Build this with AgenKit
A spec is not a trading system. Paste this into your coding agent and AgenKit runs a specialist team — architecture, test-first build, risk gates, review — with paper trading on by default.
/agenkit build a production-grade trading bot with a backtest engine, risk controls and paper trading by default from strategies/RSI-Reversal-Trading-Strategy-432118.md- npx agenkit install engineering-kit in your project
- Paste the command into your agent and approve each phase
- Get tests, backtest, risk controls and a paper-trading switch
Understand it first
Before you run this, read the lesson behind the idea and how to backtest it honestly. Specs like this one are the survivors of an unknown number of trials; deflate their results accordingly.
Related specs
- ATR and EMA based Dynamic Take Profit and Stop Loss Adaptive StrategyPine Script · Mean reversion · 1h
- Adaptive Mean Reversion Trading Strategy Based on Chande Momentum OscillatorPine Script · Mean reversion · 1d
- Adaptive RSI Oscillator Dynamic Trading Strategy with Threshold OptimizationPine Script · Mean reversion · 1d
- Advanced 15 Minute Chart Trading Signal StrategyPine Script · Mean reversion · 3h
- Advanced Fibonacci Retracement Trend Following and Reversal Trading StrategyPine Script · Mean reversion · 3h
- Advanced Momentum EMA Trend Following with RSI Overbought Oversold Trading StrategyPine Script · Mean reversion · 1d