Strategy vault / Mean reversion
RSI Threshold Trading Strategy
This strategy implements a simple threshold trading strategy based on the Relative Strength Index (RSI). It buys when RSI falls below the threshold of 30 and sells when RSI rises above the threshold of 40. The…
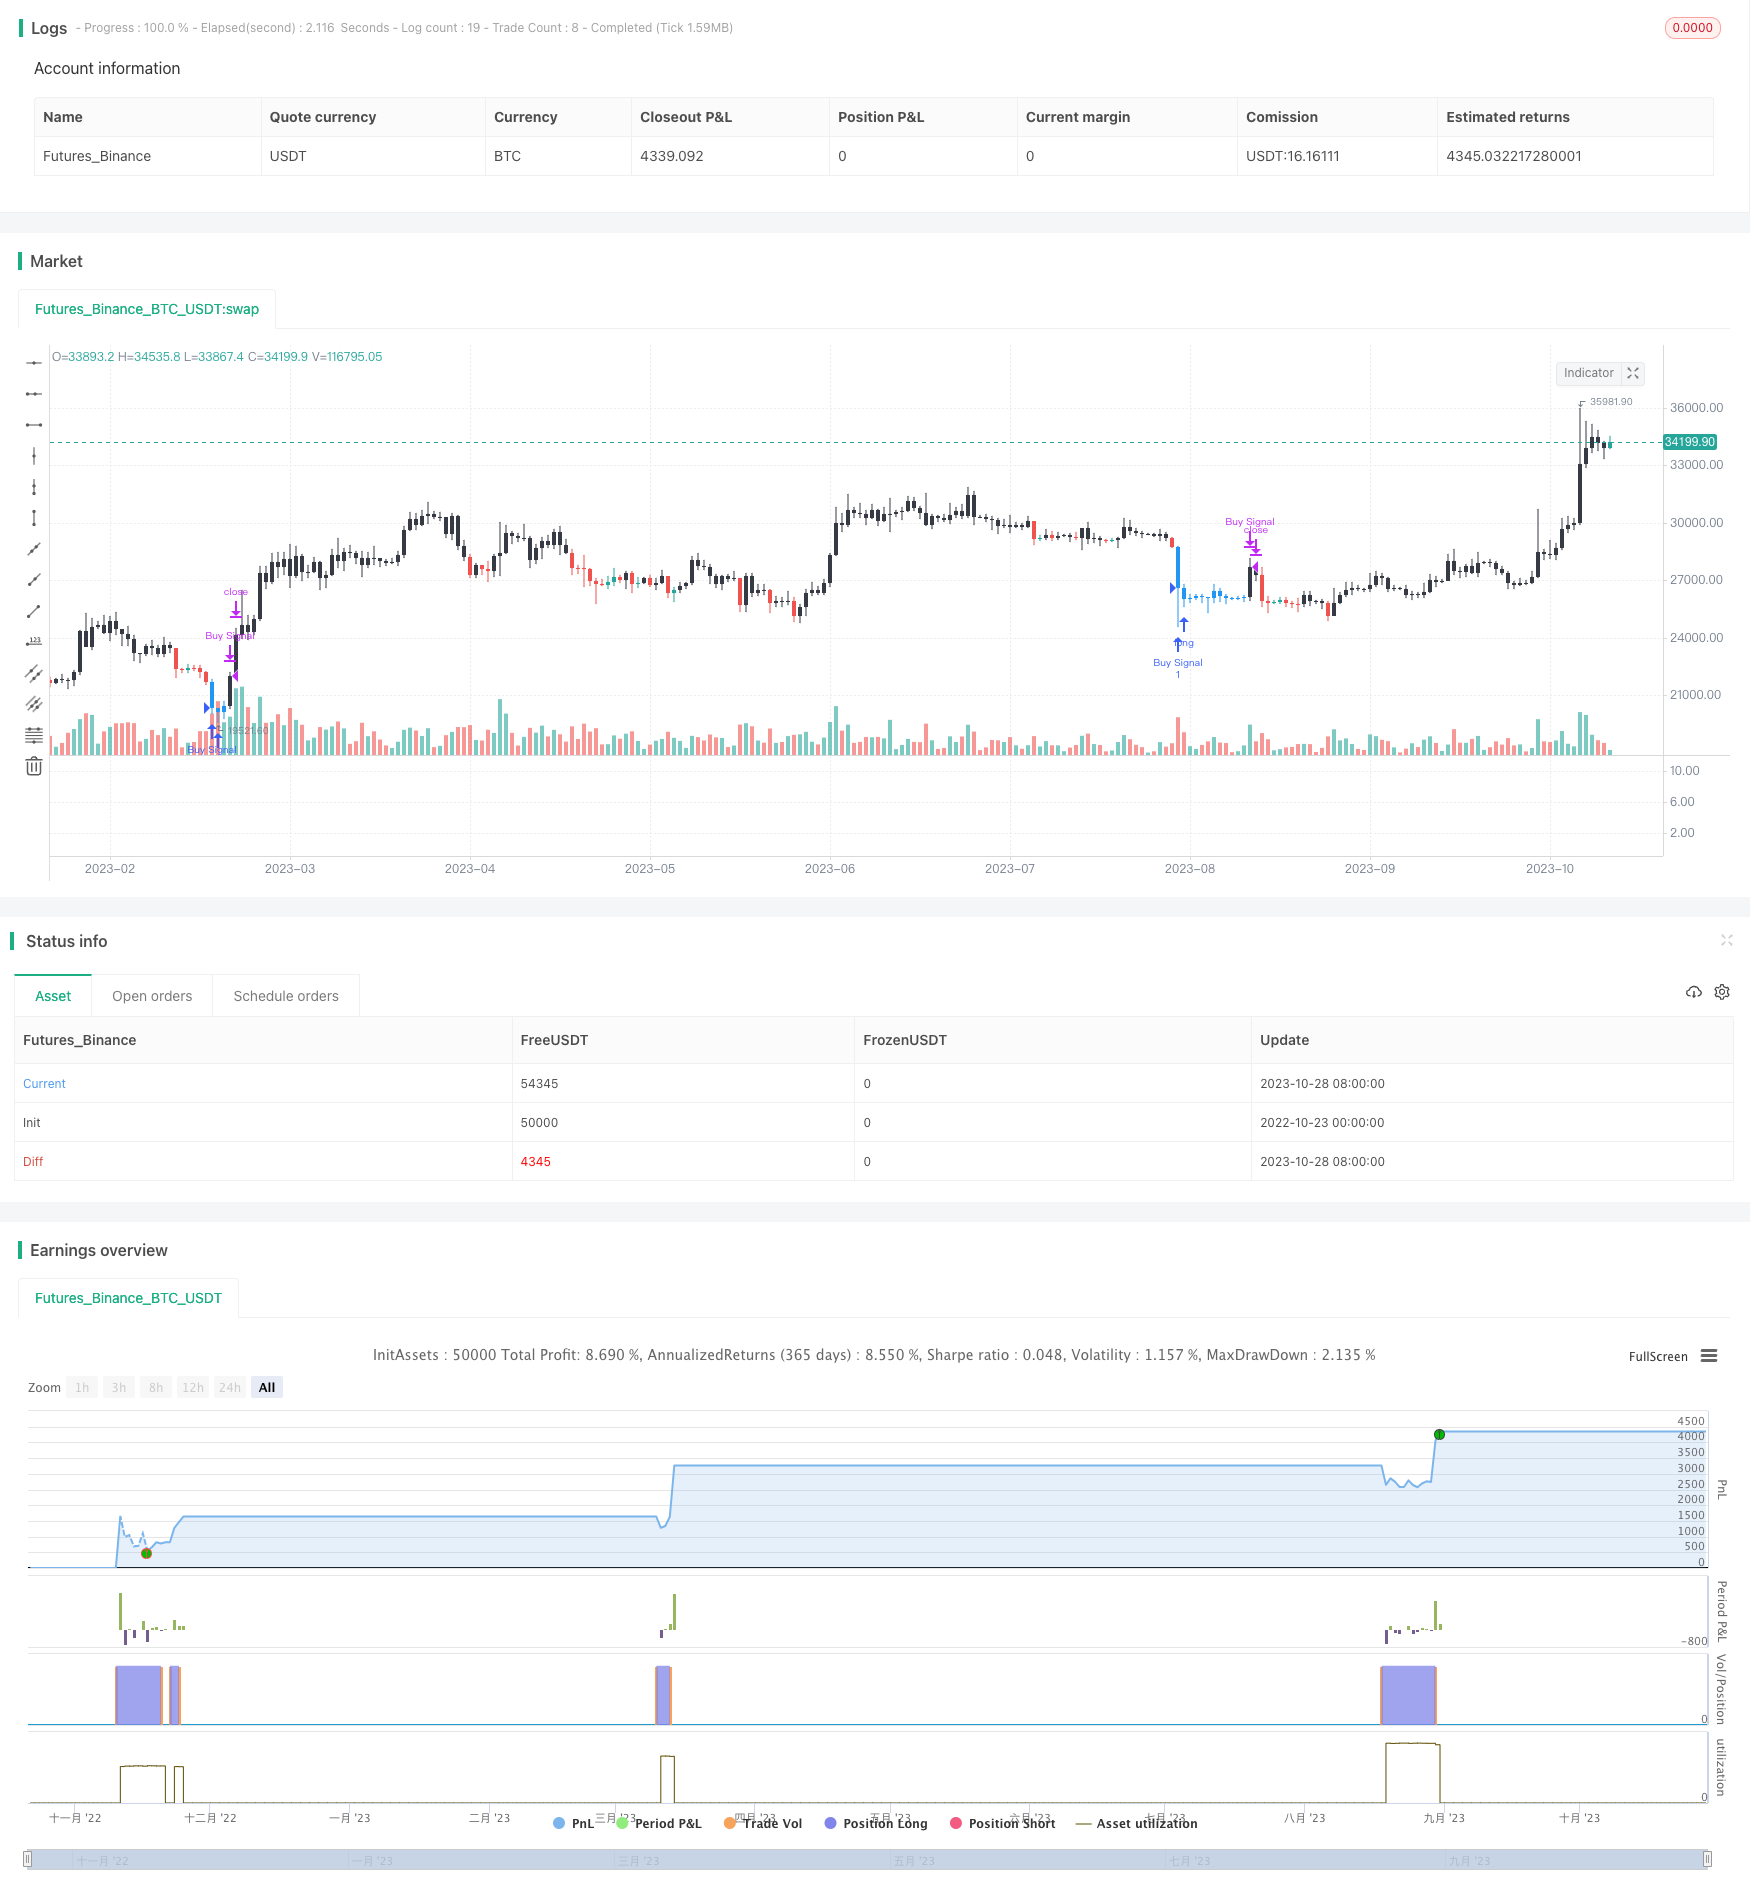
Overview
This strategy implements a simple threshold trading strategy based on the Relative Strength Index (RSI). It buys when RSI falls below the threshold of 30 and sells when RSI rises above the threshold of 40. The holding period is fixed at 10 days. The strategy is suitable for medium-term trading.
Strategy Logic
The strategy mainly uses the oversold and overbought zones of the RSI indicator to generate trading signals. The RSI reflects the speed of price changes over a period. RSI below 30 indicates an oversold zone where price may bounce back. RSI above 70 indicates an overbought zone where price may fall.
Specifically, the strategy first calculates the 10-day RSI, then sets the thresholds at 30 and 40. When 10-day RSI falls below 30, a buy signal is generated. When 10-day RSI rises above 40, a sell signal is generated. Upon receiving the buy signal, it opens a long position. Upon receiving the sell signal, if the holding days exceed 10 days, it closes the position directly. Otherwise, it continues holding until the 10th day to sell out.
The strategy is simple and easy to understand, identifying oversold and overbought zones using the RSI to implement a threshold trading strategy based on an indicator.
Advantages
- Uses the widely applied RSI indicator with room for parameter optimization
The strategy uses the prevalent RSI indicator. RSI parameters can be adjusted and optimized to suit different periods and market environments.
- Implements simple trend following
RSI can reflect price change trends. The strategy judges price moves based on RSI to achieve simple trend following.
- Relatively good risk control
The strategy adopts a fixed holding period to effectively control single loss. Meanwhile, RSI parameters can be tuned to reduce erroneous trading.
Risks
- RSI parameters susceptible to overoptimization
RSI parameters can be flexibly set but over-optimization and backtest bias may bring live trading risks.
- Lagging effect exists
RSI is a trend-following indicator and reacts slowly to sudden events, with some lagging effect. Other indicators should be combined.
- Fixed holding period lacks flexibility
The fixed holding period mandates profit-taking and stop-loss points and cannot be adjusted based on market changes. A dynamic adjustment of stop profit and stop loss is desired.
Enhancement Directions
Optimize RSI parameters and test impacts of different values.
Add other indicators to form a combined system utilizing strengths of different indicators.
Enhance stop profit/loss strategy to allow dynamic adjustments based on market conditions.
Optimize position sizing to dynamically adjust positions based on market conditions.
Test products suitable for the strategy, choosing liquid products with high volatility.
Optimize trading hours and test impacts on the strategy.
Conclusion
The strategy is relatively simple, implementing a threshold-based trading strategy using RSI. Its advantages include simplicity, ease of understanding and relatively good risk control. However, issues like RSI parameter optimization difficulty and inflexible stop profit/loss exist. Future enhancements include parameter optimization, stop profit/loss enhancements, position sizing etc. Further optimizations are needed before live trading.
Parameters
| Name | Default | What it controls |
|---|---|---|
| v_input_1 | 40 | overbought value |
| v_input_2 | 30 | oversold value |
| v_input_3 | 2018 | Backtest Start Year |
| v_input_4 | true | Backtest Start Month |
| v_input_5 | true | Backtest Start Day |
| v_input_6 | 2021 | Backtest Stop Year |
| v_input_7 | 16 | Backtest Stop Month |
| v_input_8 | 2 | Backtest Stop Day |
| v_input_9 | true | Color Background? |
Source Pine Script
/*backtest
start: 2022-10-23 00:00:00
end: 2023-10-29 00:00:00
period: 1d
basePeriod: 1h
exchanges: [{"eid":"Futures_Binance","currency":"BTC_USDT"}]
*/

// This source code is subject to the terms of the Mozilla Public License 2.0 at https://mozilla.org/MPL/2.0/
// © Bitduke

//@version=4
// strategy("Simple RSI Buy/Sell at a level", shorttitle="Simple RSI Strategy", overlay=true,calc_on_every_tick=false,pyramiding=1, default_qty_type=strategy.cash,default_qty_value=1000, currency=currency.USD, initial_capital=1000,commission_type=strategy.commission.percent, commission_value=0.075)
overbought = input(40, title="overbought value")
oversold = input(30, title="oversold value")
// Component Test Periods Code Begin
testStartYear = input(2018, "Backtest Start Year")
testStartMonth = input(1, "Backtest Start Month")
testStartDay = input(1, "Backtest Start Day")
testPeriodStart = timestamp(testStartYear,testStartMonth,testStartDay,0,0)

testStopYear = input(2021, "Backtest Stop Year")
testStopMonth = input(16, "Backtest Stop Month")
testStopDay = input(2, "Backtest Stop Day")
testPeriodStop = timestamp(testStopYear,testStopMonth,testStopDay,0,0)

// A switch to control background coloring of the test period
testPeriodBackground = input(title="Color Background?", type=input.bool, defval=true)
testPeriodBackgroundColor = testPeriodBackground and (time >= testPeriodStart) and (time <= testPeriodStop) ? #00FF00 : na
bgcolor(testPeriodBackgroundColor, transp=97)

testPeriod() => true
// Component Test Periods Code End
//////////////////////////////////////////////////////////////////////

myrsi = rsi(close, 10) > overbought
myrsi2 = rsi(close, 10) < oversold

barcolor(myrsi ? color.black : na)
barcolor(myrsi2 ? color.blue : na)


myEntry = myrsi2 and hour(time) <= 9

strategy.entry("Buy Signal", strategy.long, when = myEntry and testPeriod())

// Close 10 bar periods after the condition that triggered the entry

//if (myEntry[10])
    //strategy.close("Buy Signal")
strategy.close("Buy Signal", when = barssince(myEntry) >= 10 or myrsi and testPeriod())

//strategy.entry("Sell Signal",strategy.short, when = myrsi2)
Published by ChaoZhang on the FMZ strategy square · last modified 2023-10-30. Collected in the Quant Trading Vault. Unvalidated research: re-test with your own data and costs before trusting it.
Build this with AgenKit
A spec is not a trading system. Paste this into your coding agent and AgenKit runs a specialist team — architecture, test-first build, risk gates, review — with paper trading on by default.
/agenkit build a production-grade trading bot with a backtest engine, risk controls and paper trading by default from strategies/RSI-Threshold-Trading-Strategy.md- npx agenkit install engineering-kit in your project
- Paste the command into your agent and approve each phase
- Get tests, backtest, risk controls and a paper-trading switch
Understand it first
Before you run this, read the lesson behind the idea and how to backtest it honestly. Specs like this one are the survivors of an unknown number of trials; deflate their results accordingly.
Related specs
- ATR and EMA based Dynamic Take Profit and Stop Loss Adaptive StrategyPine Script · Mean reversion · 1h
- Adaptive Mean Reversion Trading Strategy Based on Chande Momentum OscillatorPine Script · Mean reversion · 1d
- Adaptive RSI Oscillator Dynamic Trading Strategy with Threshold OptimizationPine Script · Mean reversion · 1d
- Advanced 15 Minute Chart Trading Signal StrategyPine Script · Mean reversion · 3h
- Advanced Fibonacci Retracement Trend Following and Reversal Trading StrategyPine Script · Mean reversion · 3h
- Advanced Momentum EMA Trend Following with RSI Overbought Oversold Trading StrategyPine Script · Mean reversion · 1d