Strategy vault / Trend following
RSI Trend Following Strategy 430252
This strategy designs a simple trend following trading system based on the RSI indicator, which can determine the market trend direction through RSI and implement automated long and short positions within a specific…
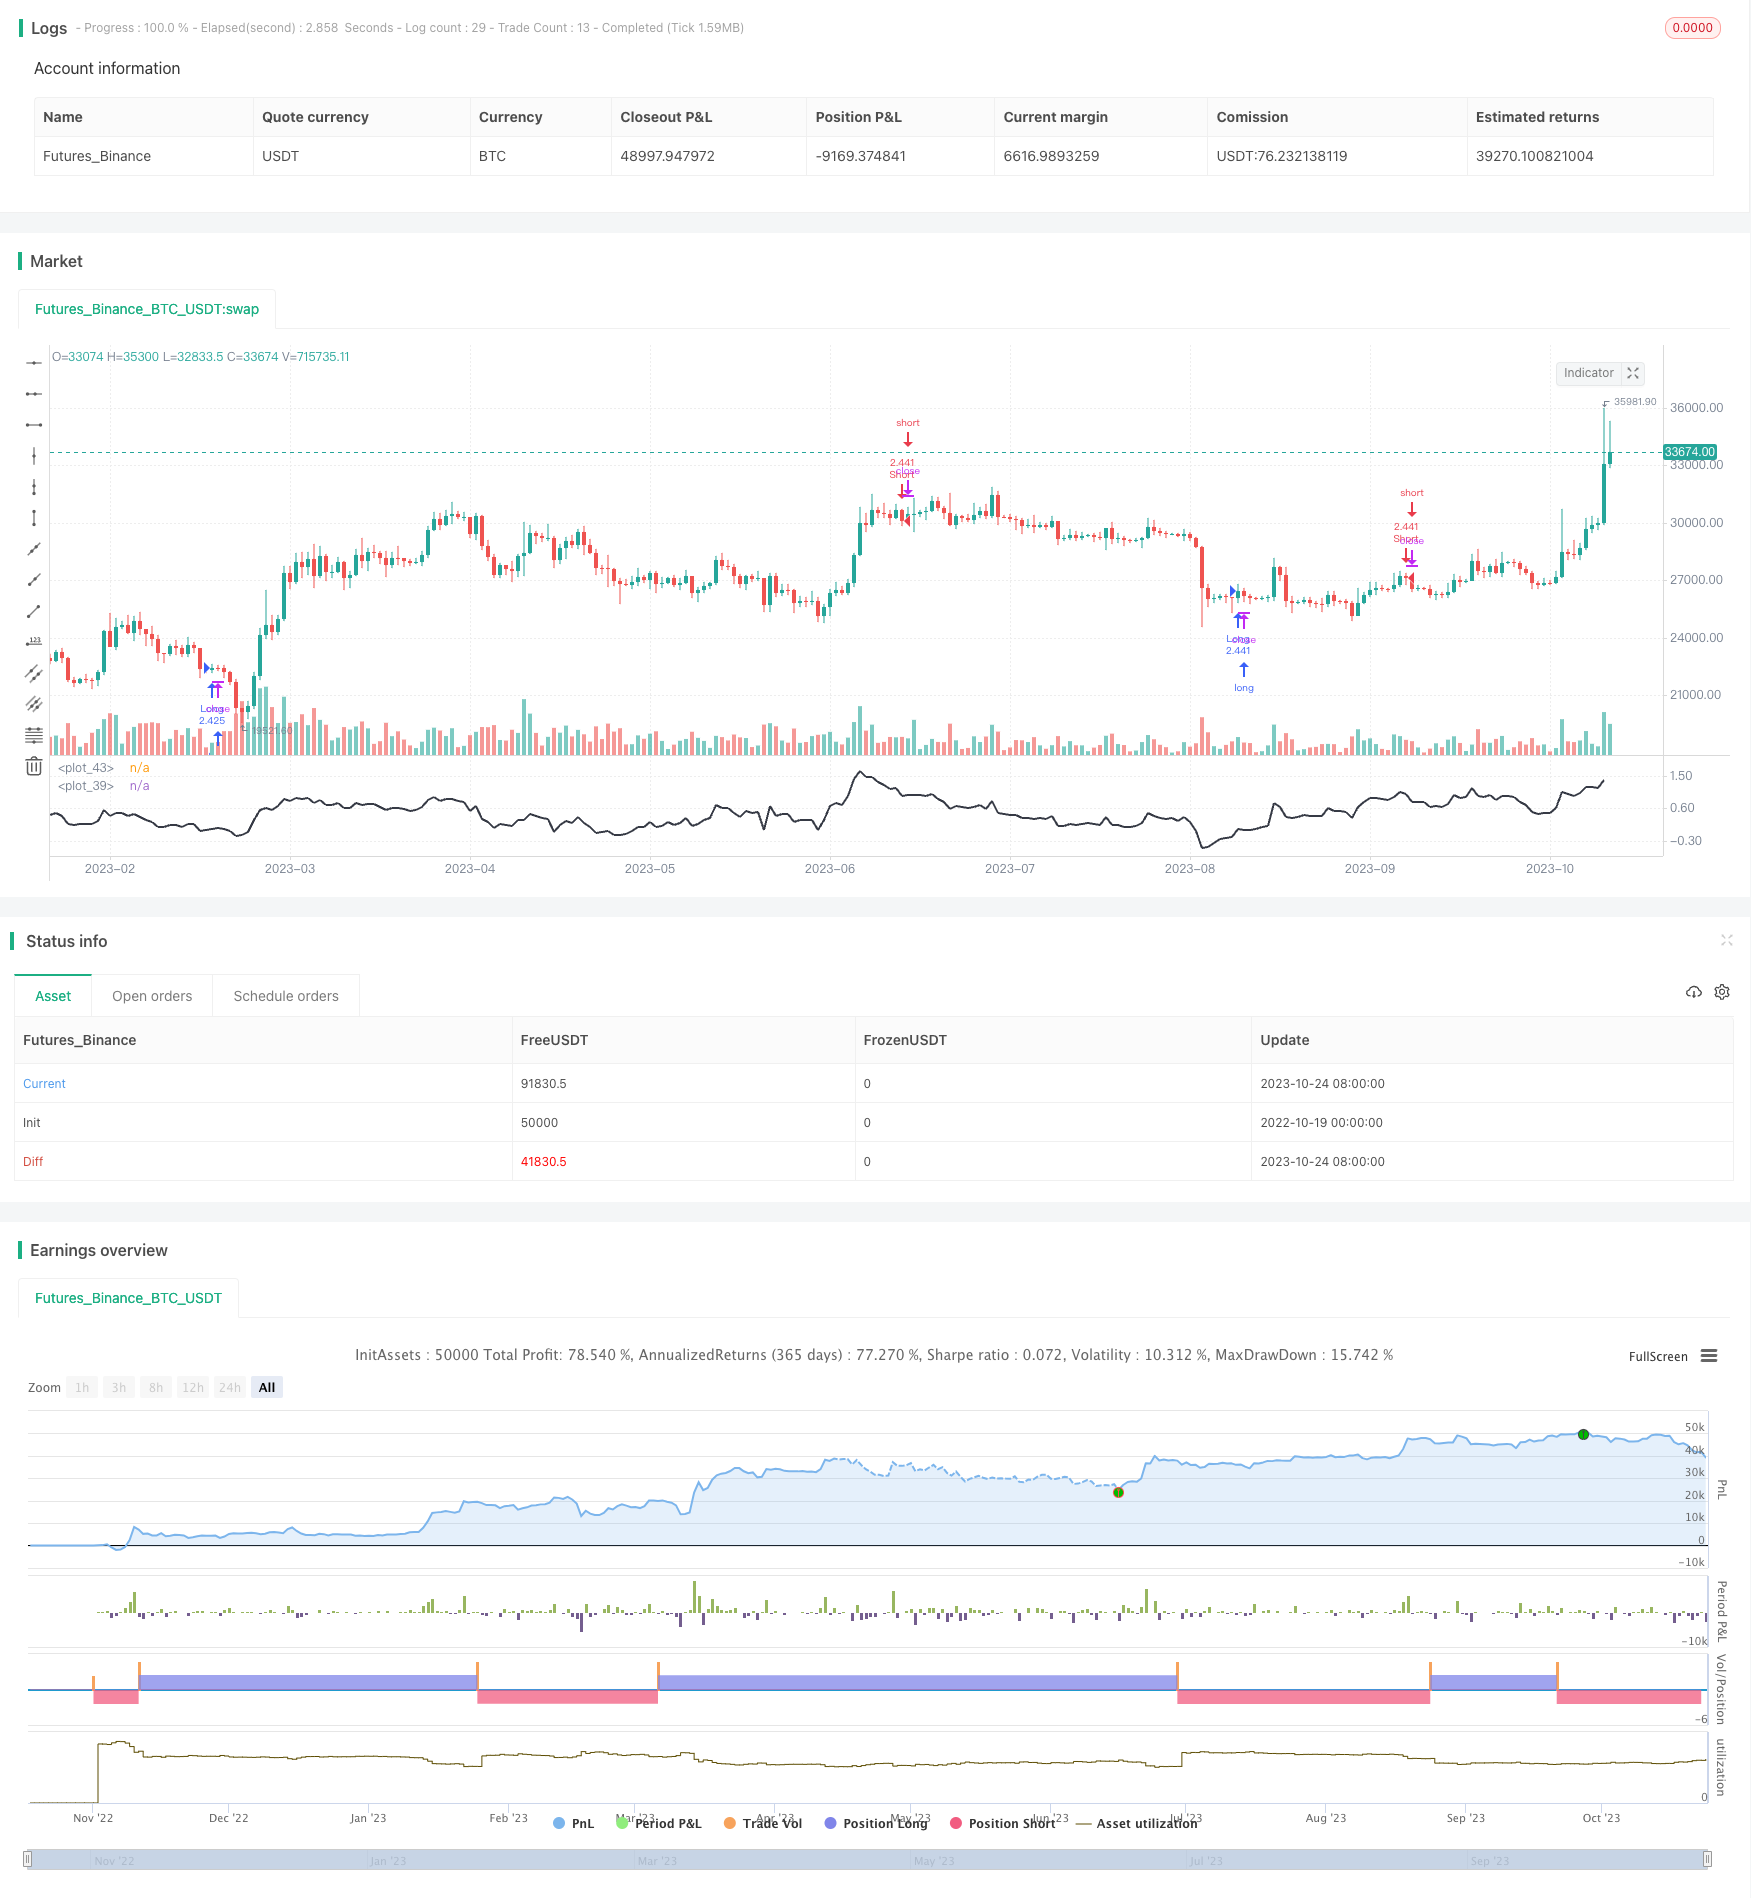
Overview
This strategy designs a simple trend following trading system based on the RSI indicator, which can determine the market trend direction through RSI and implement automated long and short positions within a specific date range.
Strategy Logic
The strategy uses RSI indicator to determine market trend, and Bollinger Bands to confirm overbought and oversold zones.
Firstly, RSI value is calculated. The upper and lower bands of Bollinger Bands are calculated based on moving average and standard deviation of RSI. RSI fluctuates between 0-1, and Bollinger Bands identifies overbought and oversold zones through standard deviation. When RSI is higher than the upper band, it's overbought zone, and when lower than the lower band, it's oversold zone.
When RSI breaks through from the lower to the upper band, a buy signal is generated. When RSI breaks through from the upper to the lower band, a sell signal is generated, to follow the trend. After entering the market, no stop loss or take profit is set until positions are closed at the end of the specified date range.
The strategy simply and effectively uses RSI to determine trend direction, and Bollinger Bands to identify specific trading opportunities. By defining the date range, unnecessary risks can be avoided.
Advantage Analysis
- Using RSI to determine trend direction is simple and effective
- Combining Bollinger Bands to confirm trading signals avoids false breakouts
- Defining trading date range helps avoid market risks
- No stop loss or take profit, maximizes trend following
- Flexible parameter adjustment, adapts to various market environments
Risks and Optimization
- Market may have violent swings, leading to losses
- No stop loss or take profit fails to effectively control risks
- Improper parameter settings may cause overtrading or missing opportunities
Optimization Directions:
- Add stop loss and take profit to control risks
- Optimize parameter settings to improve win rate
- Add other indicators to filter signals and avoid false breakouts
- Dynamically adjust position sizing
Summary
In summary, this is a very simple and direct trend following strategy. Using RSI to determine trend, Bollinger Bands to filter signals, and defining trading date range, can effectively follow trends and control risks. But the strategy can be further optimized. While keeping it simple and effective, methods like stop loss, parameter optimization and signal filtering can be added to make it more suitable for live trading.
Parameters
| Name | Default | What it controls |
|---|---|---|
| v_input_1 | true | Long |
| v_input_2 | true | Short |
| v_input_3 | 100 | Lot, % |
| v_input_4_close | 0 | source: close | high | low | open | hl2 | hlc3 | hlcc4 | ohlc4 |
| v_input_5 | 14 | RSI or MFI length |
| v_input_6 | true | use RSI or MFI |
| v_input_7 | 2018 | From Year |
| v_input_8 | 2100 | To Year |
| v_input_9 | true | From Month |
| v_input_10 | 12 | To Month |
| v_input_11 | true | From Day |
| v_input_12 | 31 | To Day |
| v_input_13 | 50 | BB length |
| v_input_14 | 1.618 | mult |
Source Pine Script
/*backtest
start: 2022-10-19 00:00:00
end: 2023-10-25 00:00:00
period: 1d
basePeriod: 1h
exchanges: [{"eid":"Futures_Binance","currency":"BTC_USDT"}]
*/

//Gidra
//2018

//@version=2
strategy(title = "Gidra's RSI or MFI Strategy v0.1", shorttitle = "Gidra's RSI or MFI v0.1", overlay = false, default_qty_type = strategy.percent_of_equity, default_qty_value = 100, pyramiding = 1)

//Settings
needlong = input(true, defval = true, title = "Long")
needshort = input(true, defval = true, title = "Short")
capital = input(100, defval = 100, minval = 1, maxval = 10000, title = "Lot, %")
src = input(close, title="source")
lengthRSI = input(14, title="RSI or MFI length")
// RSI %B
useRSI = input(true, title="use RSI or MFI")
fromyear = input(2018, defval = 2018, minval = 1900, maxval = 2100, title = "From Year")
toyear = input(2100, defval = 2100, minval = 1900, maxval = 2100, title = "To Year")
frommonth = input(01, defval = 01, minval = 01, maxval = 12, title = "From Month")
tomonth = input(12, defval = 12, minval = 01, maxval = 12, title = "To Month")
fromday = input(01, defval = 01, minval = 01, maxval = 31, title = "From Day")
today = input(31, defval = 31, minval = 01, maxval = 31, title = "To Day")

//MFI
upper = sum(volume * (change(src) <= 0 ? 0 : src), lengthRSI)
lower = sum(volume * (change(src) >= 0 ? 0 : src), lengthRSI)
mf = rsi(upper, lower)

//RSI
rsi = useRSI?rsi(src, lengthRSI): mf

// %B
length = input(50, minval=1, title="BB length")
mult = input(1.618, minval=0.001, maxval=50)
basis = sma(rsi, length)
dev = mult * stdev(rsi, length)
upperr = basis + dev
lowerr = basis - dev
bbr = (rsi - lowerr)/(upperr - lowerr)

plot(bbr, color=black, transp=0, linewidth=2)
// band1 = hline(1, color=white, linestyle=dashed)
// band0 = hline(0, color=white, linestyle=dashed)
// fill(band1, band0, color=teal)
hline(0.5, color=white)

//Signals
up = bbr >= 0 and bbr[1] < 0
dn = bbr <= 1 and bbr[1] > 1
//exit = ((bbr[1] < 0.5 and bbr >= 0.5) or (bbr[1] > 0.5 and bbr <= 0.5))

lot = strategy.position_size == 0 ? strategy.equity / close * capital / 100 : lot[1]

//Trading
if up
    strategy.entry("Long", strategy.long, needlong == false ? 0 : lot, when=(time > timestamp(fromyear, frommonth, fromday, 00, 00) and time < timestamp(toyear, tomonth, today, 23, 59)))

if dn
    strategy.entry("Short", strategy.short, needshort == false ? 0 : lot, when=(time > timestamp(fromyear, frommonth, fromday, 00, 00) and time < timestamp(toyear, tomonth, today, 23, 59)))

if time > timestamp(toyear, tomonth, today, 23, 59)// or exit
strategy.close_all()Published by ChaoZhang on the FMZ strategy square · last modified 2023-10-26. Collected in the Quant Trading Vault. Unvalidated research: re-test with your own data and costs before trusting it.
Build this with AgenKit
A spec is not a trading system. Paste this into your coding agent and AgenKit runs a specialist team — architecture, test-first build, risk gates, review — with paper trading on by default.
/agenkit build a production-grade trading bot with a backtest engine, risk controls and paper trading by default from strategies/RSI-Trend-Following-Strategy-430252.md- npx agenkit install engineering-kit in your project
- Paste the command into your agent and approve each phase
- Get tests, backtest, risk controls and a paper-trading switch
Understand it first
Before you run this, read the lesson behind the idea and how to backtest it honestly. Specs like this one are the survivors of an unknown number of trials; deflate their results accordingly.
Related specs
- BB Percentage Index Trend Fading StrategyPine Script · Trend following · 1h
- Bollinger Bands and RSI Trend Following StrategyPine Script · Trend following · 1h
- EMA Cross Trend Following Strategy with SMA Stop Loss and Re Entry MechanismPine Script · Trend following · 1h
- EMA and RSI Trend Trading StrategyPine Script · Trend following · 1d
- Multi Indicator Trend Divergence Quantitative Trading StrategyPine Script · Trend following · 1d
- Multi Indicator Trend Following Strategy with Dynamic Risk ManagementPine Script · Trend following · 2h