Strategy vault / Trend following
RSI Trend Following Strategy with Trailing Stop Loss
This strategy is an automated trading strategy that identifies trend using the RSI indicator and confirms the trend with moving averages, with stop loss and take profit settings. It goes long when RSI goes above 68…
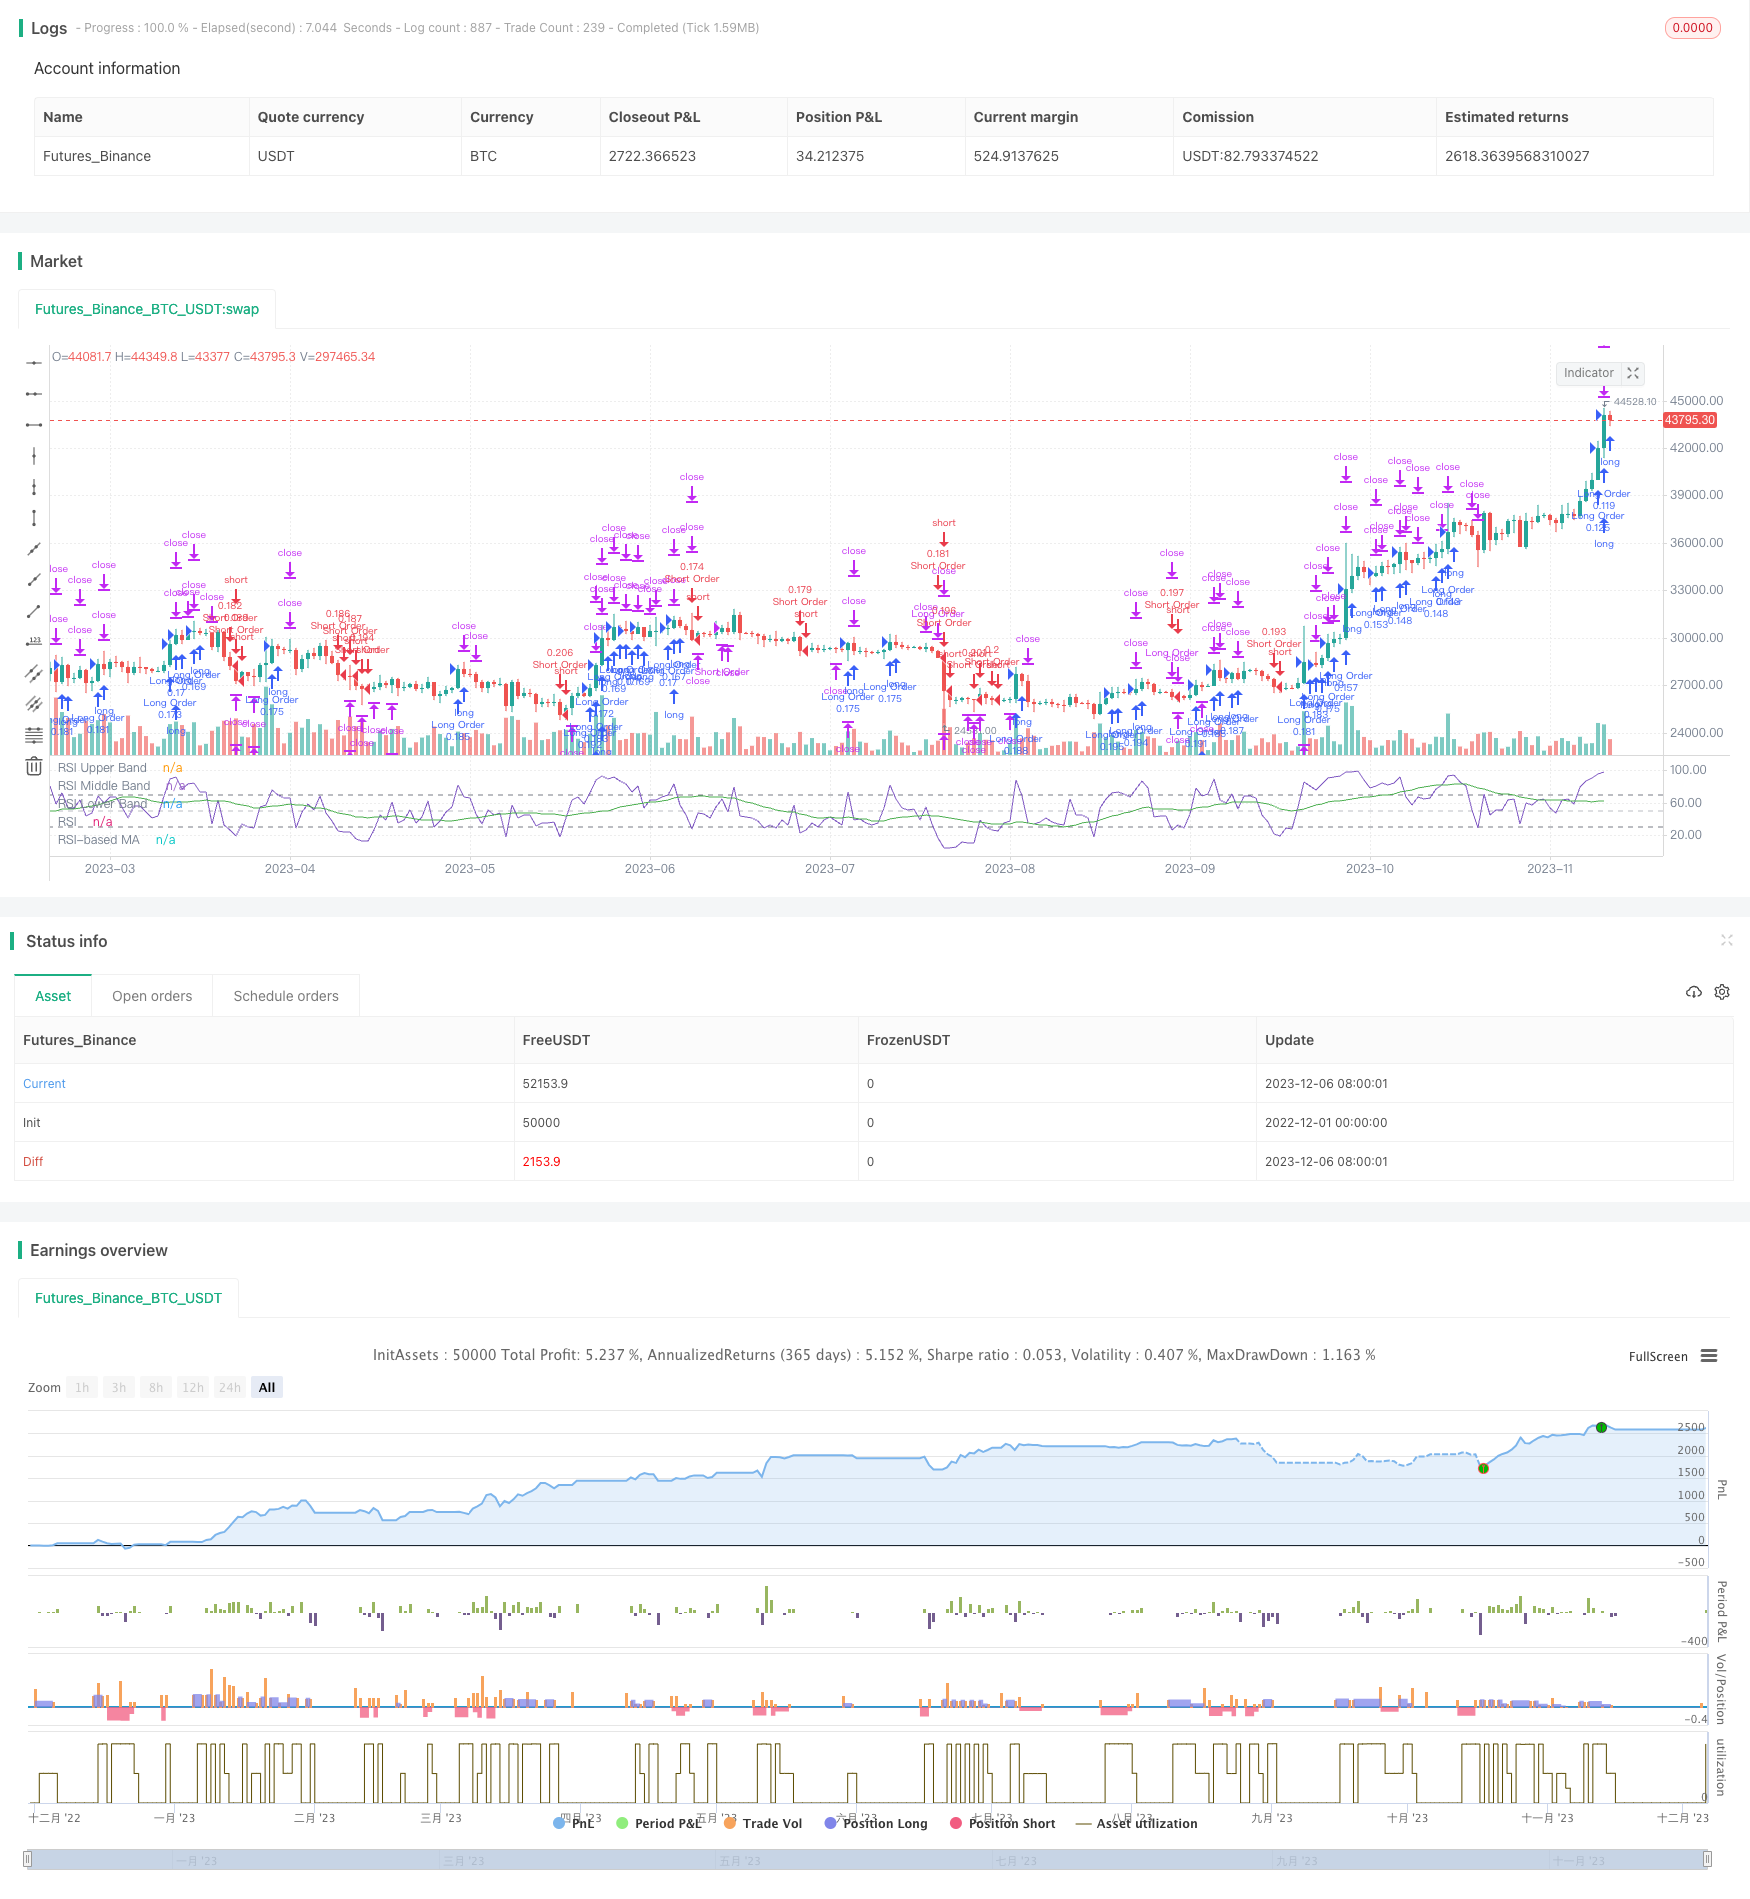
Overview
This strategy is an automated trading strategy that identifies trend using the RSI indicator and confirms the trend with moving averages, with stop loss and take profit settings. It goes long when RSI goes above 68 and the current moving average crosses above the previous moving average, and goes short when RSI drops below 28 and the current moving average crosses below the previous moving average. Stop loss and take profit points are also configured.
Strategy Logic
The strategy mainly uses the RSI indicator to identify overbought and oversold conditions to determine the trend. Values above 70 for RSI indicate an overbought condition and values below 30 indicate an oversold condition. The trend is confirmed using the golden cross and death cross signals from the moving averages. The specific trading signals are:
Long signal: RSI goes above 68 and current moving average crosses above previous moving average, go long.
Short signal: RSI goes below 28 and current moving average crosses below previous moving average, go short.
The stop loss and take profit settings are staggered, from more loose to more strict:
Long take profit: Take profit 50% of position at 1.4% above the high, take profit 100% at 0.8% above the high.
Long stop loss: Set stop loss at 2% below the entry price.
Short take profit: Take profit 50% of position at 0.4% below the low, take profit 100% at 0.8% below the low. Short stop loss: Set stop loss at 2% above the entry price.
Also, when trend reverses, like RSI breaking below 30 when long, close entire long position at market; when RSI breaks above 60 when short, close entire short position at market.
Advantages
- Use RSI to determine overbought/oversold to avoid buying high and selling low.
- Filters with moving averages to reduce trades against the major trend.
- Staggered take profit targets to maximize profits.
- Wider stop loss allows for some retracement.
- Trend reversal based position closing reacts fast to sudden events.
Risks
- Poor RSI parameter tuning leading to inaccurate signals.
- Poor moving average parameter tuning leading to weak filtering.
- Stop loss too wide leading to large losses.
- Take profit too tight leaving profits on the table.
- Inaccurate reversal signal closing positions unnecessarily.
To address the above risks, extensive parameter tuning should be done. Stop loss and take profit should also be set appropriately based on market volatility. Reversal signals should be used carefully to avoid unnecessary losses.
Enhancement Opportunities
The strategy can be further improved:
- Add more filters like volume to improve signal accuracy.
- Implement trailing stop loss to lock in profits.
- Use trailing take profit for some exits to maximize profits.
- Add instrument switching for using optimal parameters.
- Incorporate cost of carry for futures to dynamically adjust stops.
Conclusion
Overall this is a mature and reliable trend following strategy. It identifies trend well using RSI and further filters with moving averages. It also implements sensible stop loss and staggered take profit settings. It can perform very well in trending markets if tuned appropriately. Further optimizations can lead to even better performance.
Parameters
| Name | Default | What it controls |
|---|---|---|
| v_input_int_3 | true | Start Date |
| v_input_int_4 | 6 | Start Month |
| v_input_int_5 | 2022 | Start Year |
| v_input_1 | 2 | Return Precision |
| v_input_int_1 | 4 | (?RSI Settings)RSI Length |
| v_input_source_1_close | 0 | Source: close | high | low | open | hl2 | hlc3 | hlcc4 | ohlc4 |
| v_input_string_1 | 0 | (?MA Settings)MA Type: SMA | Bollinger Bands | EMA | SMMA (RMA) | WMA | VWMA |
| v_input_int_2 | 23 | MA Length |
| v_input_float_1 | 2 | BB StdDev |
Source Pine Script
// © CRabbit
//@version=5

// Starting with $100 and using 10% of the account per trade
strategy("RSI Template", shorttitle="RSI", overlay=false, initial_capital=100, default_qty_value=10, default_qty_type=strategy.percent_of_equity)

// RSI Indicator
ma(source, length, type) =>
    switch type
        "SMA" => ta.sma(source, length)
        "Bollinger Bands" => ta.sma(source, length)
        "EMA" => ta.ema(source, length)
        "SMMA (RMA)" => ta.rma(source, length)
        "WMA" => ta.wma(source, length)
        "VWMA" => ta.vwma(source, length)

rsiLengthInput = input.int(4, minval=1, title="RSI Length", group="RSI Settings")
rsiSourceInput = input.source(close, "Source", group="RSI Settings")
maTypeInput = input.string("SMA", title="MA Type", options=["SMA", "Bollinger Bands", "EMA", "SMMA (RMA)", "WMA", "VWMA"], group="MA Settings")
maLengthInput = input.int(23, title="MA Length", group="MA Settings")
bbMultInput = input.float(2.0, minval=0.001, maxval=50, title="BB StdDev", group="MA Settings")

up = ta.rma(math.max(ta.change(rsiSourceInput), 0), rsiLengthInput)
down = ta.rma(-math.min(ta.change(rsiSourceInput), 0), rsiLengthInput)
rsi = down == 0 ? 100 : up == 0 ? 0 : 100 - (100 / (1 + up / down))
rsiMA = ma(rsi, maLengthInput, maTypeInput)
isBB = maTypeInput == "Bollinger Bands"

plot(rsi, "RSI", color=#7E57C2)
plot(rsiMA, "RSI-based MA", color=color.green)
rsiUpperBand = hline(70, "RSI Upper Band", color=#787B86)
hline(50, "RSI Middle Band", color=color.new(#787B86, 50))
rsiLowerBand = hline(30, "RSI Lower Band", color=#787B86)
fill(rsiUpperBand, rsiLowerBand, color=color.rgb(126, 87, 194, 90), title="RSI Background Fill")


// Configure backtest start date with inputs
startDate = input.int(title="Start Date", defval=1, minval=1, maxval=31)
startMonth = input.int(title="Start Month", defval=6, minval=1, maxval=12)
startYear = input.int(title="Start Year", defval=2022, minval=1800, maxval=2100)

// See if this bar's time happened on/after start date
afterStartDate = (time >= timestamp(syminfo.timezone,
     startYear, startMonth, startDate, 0, 0))


// Long and Short buy strategy
// Submit a market open/ close Long order, but only on/after start date
if (afterStartDate)
    if rsi > 68 and (rsiMA > rsiMA[1])
        strategy.entry("Long Order", strategy.long, comment="ENTER-LONG")
    if rsi < 30
        strategy.close("Long Order", alert_message="L-CL")

strategy.exit("L-TP1", from_entry="Long Order", limit=high * 1.004, qty_percent=50, alert_message="L-TP1" + str.tostring(high * 1.004))
strategy.exit("L-TP2", from_entry="Long Order", limit=high * 1.008, qty_percent=100, alert_message="L-TP2" + str.tostring(high * 1.008))
strategy.exit("Exit Long", from_entry="Long Order", stop=low * 0.98, alert_message="L-SL" + str.tostring(low * 0.98))


// Submit a market Open/ Close Short order, but only on/after start date
if (afterStartDate)
    if rsi < 28 and (rsiMA < rsiMA[1])
        strategy.entry("Short Order", strategy.short, comment="ENTER-SHORT")
    if rsi > 60
        strategy.close("Short Order", alert_message="S-CL")

strategy.exit("S-TP1", from_entry="Short Order", limit=low * 0.996, qty_percent=50, alert_message="S-TP1" + str.tostring(low * 0.996))
strategy.exit("S-TP2", from_entry="Short Order", limit=low * 0.992, qty_percent=100, alert_message="S-TP2" + str.tostring(low * 0.992))
strategy.exit("Exit Short", from_entry="Short Order", stop=high * 1.02, alert_message="S-SL" + str.tostring(high * 1.02))

// MONTHLY TABLE //

prec      = input(2, title = "Return Precision")

new_month = month(time) != month(time[1])
new_year  = year(time)  != year(time[1])

eq = strategy.equity

bar_pnl = eq / eq[1] - 1

cur_month_pnl = 0.0
cur_year_pnl  = 0.0

// Current Monthly P&L
cur_month_pnl := new_month ? 0.0 :
                 (1 + cur_month_pnl[1]) * (1 + bar_pnl) - 1

// Current Yearly P&L
cur_year_pnl := new_year ? 0.0 :
                 (1 + cur_year_pnl[1]) * (1 + bar_pnl) - 1

// Arrays to store Yearly and Monthly P&Ls
var month_pnl  = array.new_float(0)
var month_time = array.new_int(0)

var year_pnl  = array.new_float(0)
var year_time = array.new_int(0)

if (not na(cur_month_pnl[1]) and (new_month or barstate.islast))
    array.push(month_pnl , cur_month_pnl[1])
    array.push(month_time, time[1])

if (not na(cur_year_pnl[1]) and (new_year or barstate.islast))
    array.push(year_pnl , cur_year_pnl[1])
    array.push(year_time, time[1])

// Monthly P&L Table
var monthly_table = table(na)

if (barstate.islast)
    monthly_table := table.new(position.bottom_right, columns = 14, rows = array.size(year_pnl) + 1, border_width = 1)

    table.cell(monthly_table, 0,  0, "",     bgcolor = #cccccc)
    table.cell(monthly_table, 1,  0, "Jan",  bgcolor = #cccccc)
    table.cell(monthly_table, 2,  0, "Feb",  bgcolor = #cccccc)
    table.cell(monthly_table, 3,  0, "Mar",  bgcolor = #cccccc)
    table.cell(monthly_table, 4,  0, "Apr",  bgcolor = #cccccc)
    table.cell(monthly_table, 5,  0, "May",  bgcolor = #cccccc)
    table.cell(monthly_table, 6,  0, "Jun",  bgcolor = #cccccc)
    table.cell(monthly_table, 7,  0, "Jul",  bgcolor = #cccccc)
    table.cell(monthly_table, 8,  0, "Aug",  bgcolor = #cccccc)
    table.cell(monthly_table, 9,  0, "Sep",  bgcolor = #cccccc)
    table.cell(monthly_table, 10, 0, "Oct",  bgcolor = #cccccc)
    table.cell(monthly_table, 11, 0, "Nov",  bgcolor = #cccccc)
    table.cell(monthly_table, 12, 0, "Dec",  bgcolor = #cccccc)
    table.cell(monthly_table, 13, 0, "Year", bgcolor = #999999)


    for yi = 0 to array.size(year_pnl) - 1
        table.cell(monthly_table, 0,  yi + 1, str.tostring(year(array.get(year_time, yi))), bgcolor = #cccccc)

        y_color = array.get(year_pnl, yi) > 0 ? color.new(color.green, transp = 50) : color.new(color.red, transp = 50)
        table.cell(monthly_table, 13, yi + 1, str.tostring(math.round(array.get(year_pnl, yi) * 100, prec)), bgcolor = y_color)

    for mi = 0 to array.size(month_time) - 1
        m_row   = year(array.get(month_time, mi))  - year(array.get(year_time, 0)) + 1
        m_col   = month(array.get(month_time, mi))
        m_color = array.get(month_pnl, mi) > 0 ? color.new(color.green, transp = 70) : color.new(color.red, transp = 70)

        table.cell(monthly_table, m_col, m_row, str.tostring(math.round(array.get(month_pnl, mi) * 100, prec)), bgcolor = m_color)
Published by ChaoZhang on the FMZ strategy square · last modified 2023-12-08. Collected in the Quant Trading Vault. Unvalidated research: re-test with your own data and costs before trusting it.
Build this with AgenKit
A spec is not a trading system. Paste this into your coding agent and AgenKit runs a specialist team — architecture, test-first build, risk gates, review — with paper trading on by default.
/agenkit build a production-grade trading bot with a backtest engine, risk controls and paper trading by default from strategies/RSI-Trend-Following-Strategy-with-Trailing-Stop-Loss.md- npx agenkit install engineering-kit in your project
- Paste the command into your agent and approve each phase
- Get tests, backtest, risk controls and a paper-trading switch
Understand it first
Before you run this, read the lesson behind the idea and how to backtest it honestly. Specs like this one are the survivors of an unknown number of trials; deflate their results accordingly.
Related specs
- Bollinger Bands and RSI Trend Following StrategyPine Script · Trend following · 1h
- EMA Cross Trend Following Strategy with SMA Stop Loss and Re Entry MechanismPine Script · Trend following · 1h
- EMA and RSI Trend Trading StrategyPine Script · Trend following · 1d
- Multi Indicator Trend Divergence Quantitative Trading StrategyPine Script · Trend following · 1d
- Multi Indicator Trend Following Strategy with Dynamic Risk ManagementPine Script · Trend following · 2h
- Trend Tracking Strategy Based on Multi indicatorPine Script · Trend following · 1d