Strategy vault / Mean reversion
Scaled Normalized Vector Strategy with Karobein Mean Reversion
This strategy is based on the Karobein Mean Reversion indicator and price momentum. It uses price momentum auxiliary indicators for trend judgment and combines the Karobein Mean Reversion indicator for specific…
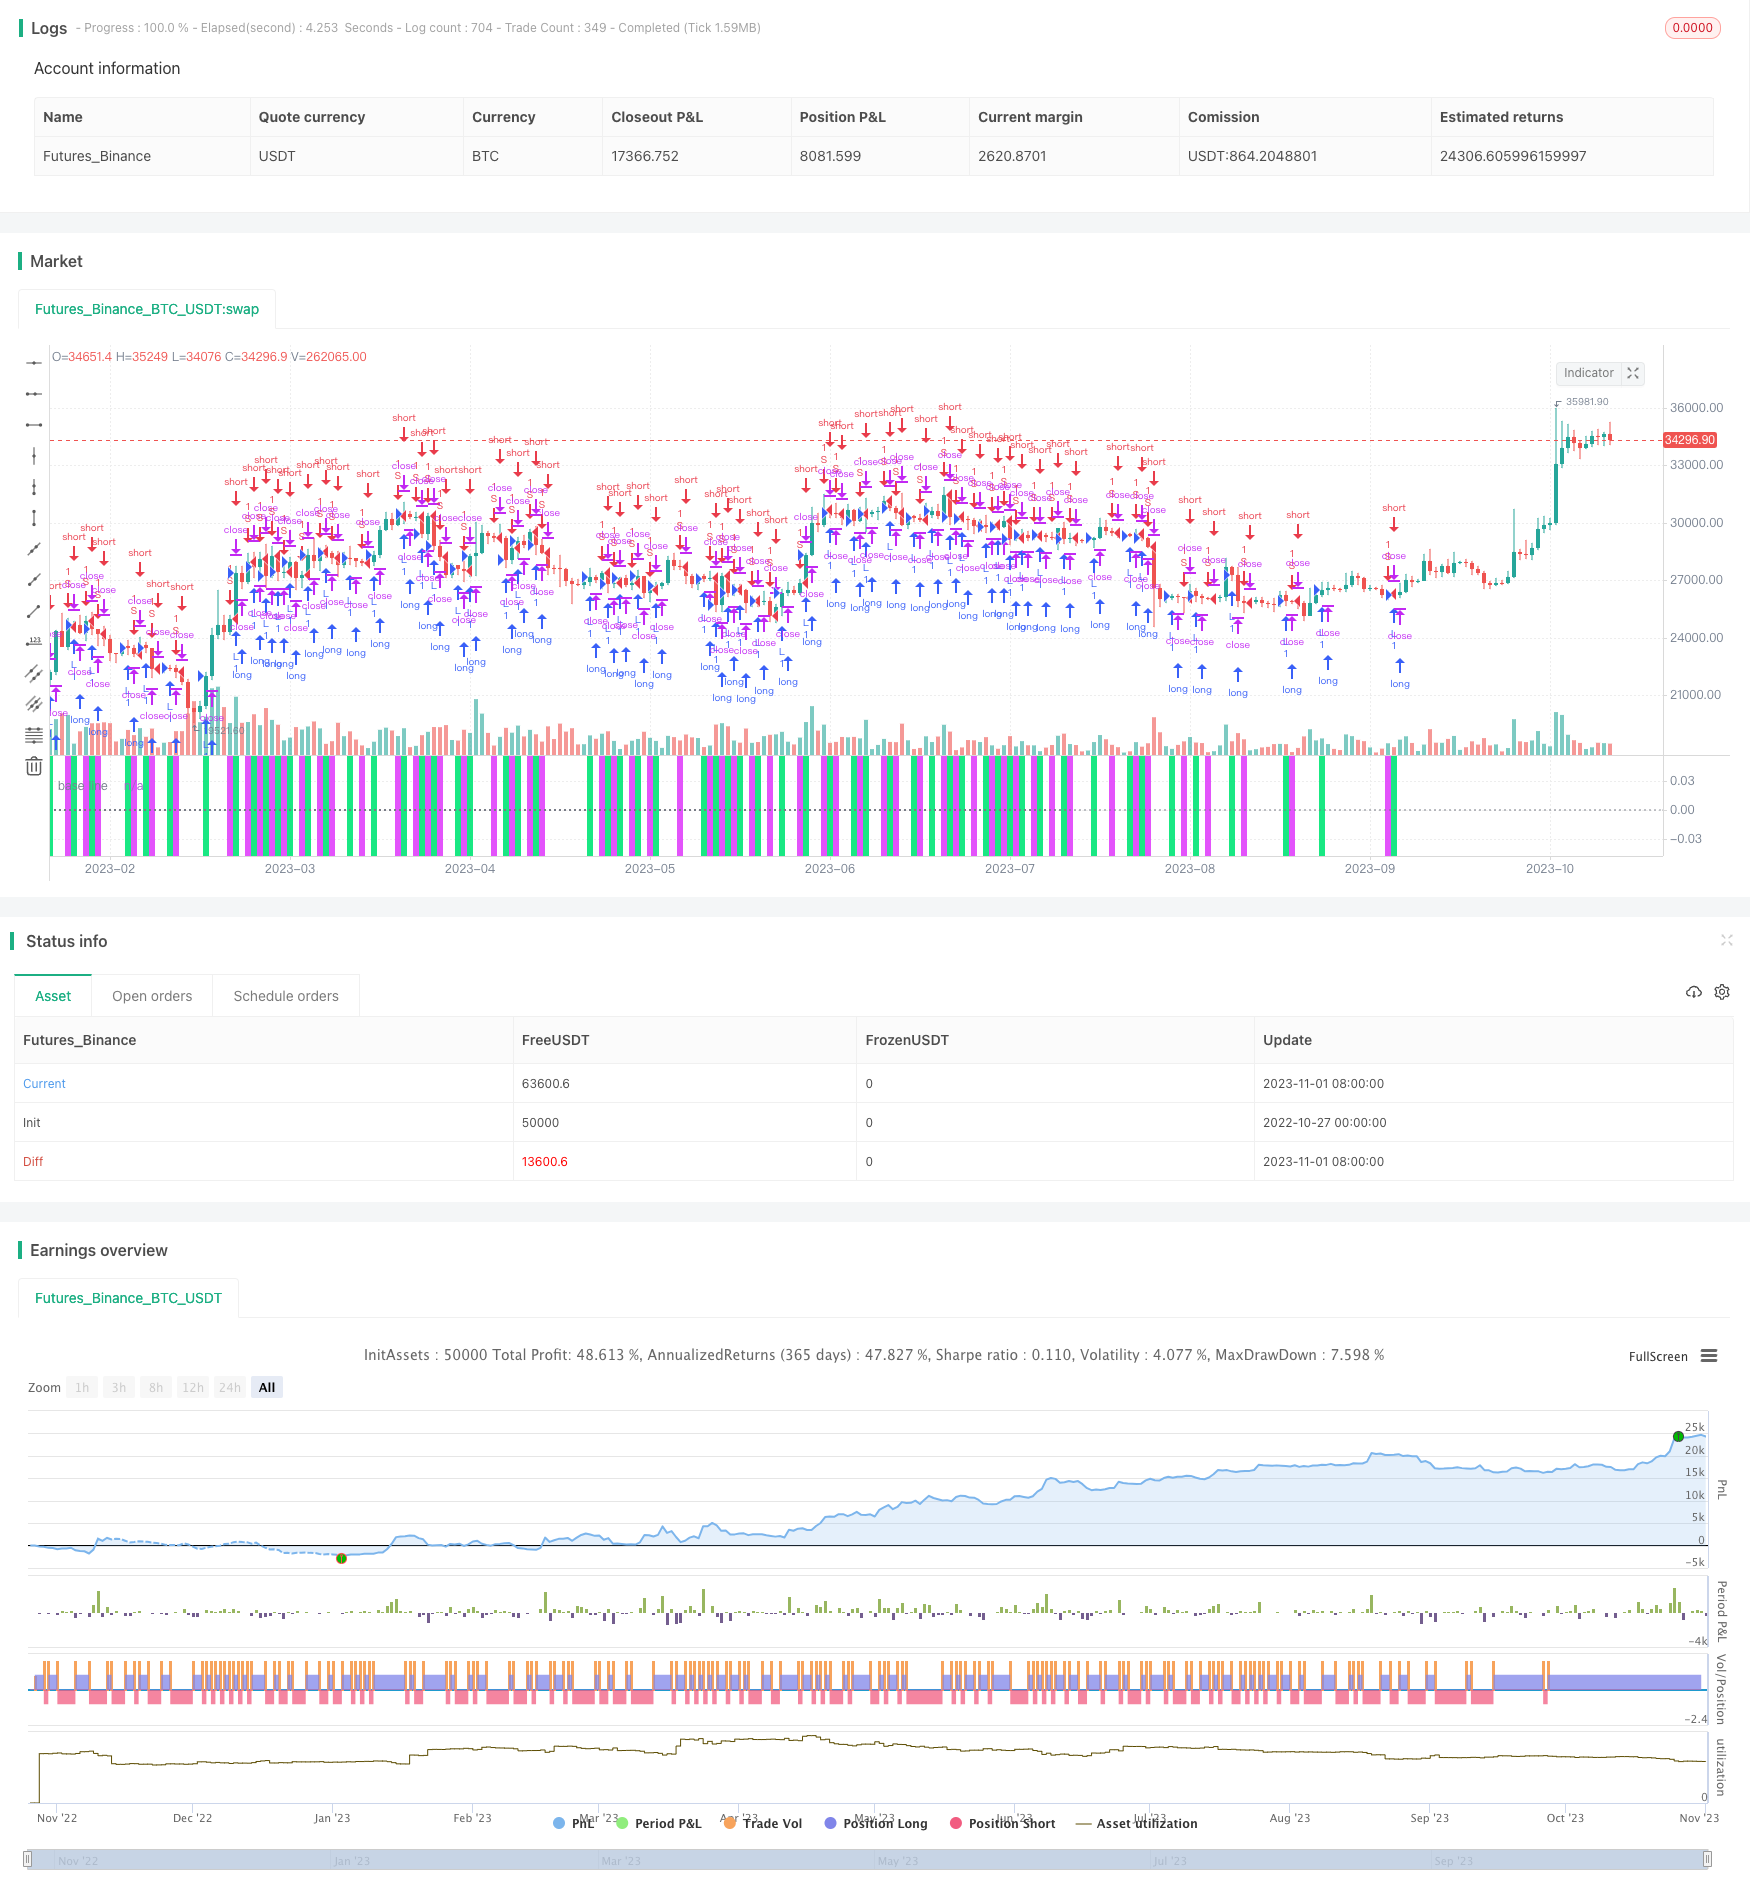
Overview
This strategy is based on the Karobein Mean Reversion indicator and price momentum. It uses price momentum auxiliary indicators for trend judgment and combines the Karobein Mean Reversion indicator for specific entry. This strategy is suitable for medium and long term trading.
Strategy Principle
Firstly, the strategy calculates the rate of change of prices at different periods to obtain the price momentum indicator. When the price momentum indicator crosses above the dynamic threshold line, a long signal is generated. When it crosses below, a short signal is generated.
Then it combines the Karobein Mean Reversion indicator to determine the specific entry timing. The Karobein Mean Reversion indicator is calculated based on the mean reversion nature of prices, which can reflect the acceleration and path of price fluctuations. This indicator has an intrinsic sinusoidal characteristic that helps determine the direction and timing of the trend.
When the price momentum indicator generates a signal, if the Karobein Mean Reversion indicator is in the corresponding directional area, an entry signal is generated.
Advantages
The strategy comprehensively considers price momentum and mean reversion factors, with strong trend judgment capability.
The Karobein Mean Reversion indicator can accurately locate price turning points and improve entry timing accuracy.
The holding period can be freely controlled by parameter adjustment, suitable for different time frames.
The dynamic threshold can be adjusted in real time for adaptive response to market changes.
Risks
As a trend following strategy, it is prone to being trapped in range-bound trends.
The Karobein Mean Reversion indicator has a certain lag, which may miss price turning points.
The holding period parameter should be monitored to avoid expanding losses from excessive holding periods.
The dynamic threshold should be set appropriately not too wide, otherwise entry opportunities may be missed.
Corresponding risk management methods:
Trend judgment indicators can be used to foresee ranging markets and exit positions in time.
Choose reasonable lags for the Karobein Mean Reversion indicator to reduce delays.
Test different holding period parameters and choose suitable ones.
Adjust the dynamic threshold range to avoid missing entries.
Enhancement Directions
Test different periods for price momentum calculation to optimize parameters.
Add volatility indicators to detect ranging markets and set stop loss.
Optimize parameters of the Karobein Mean Reversion indicator to make it more sensitive.
Add additional filters like volume to improve signal quality.
Use machine learning algorithms to dynamically optimize parameters.
Conclusion
This strategy comprehensively utilizes price momentum and mean reversion factors, with strong capabilities in trend judgment and signal generation. It can adapt to different market environments through parameter tuning. Further optimizations can be done regarding entry timing and stop loss to make the strategy more robust. This strategy deserves further research and application.
Parameters
| Name | Default | What it controls |
|---|---|---|
| v_input_1_close | 0 | Price Data: close | high | low | open | hl2 | hlc3 | hlcc4 | ohlc4 |
| v_input_2 | 34 | Timeframe |
| v_input_3 | 14 | Threshold |
| v_input_4 | 0 | Divisor: 1000000 | 10 | 100 | 1000 | 10000 | 100000 | 1 | 10000000 | 100000000 |
| v_input_5 | false | Volume |
| v_input_6 | true | Use Old System |
| v_input_7 | 8 | Karobein Osc Lookback |
Source Pine Script
/*backtest
start: 2022-10-27 00:00:00
end: 2023-11-02 00:00:00
period: 1d
basePeriod: 1h
exchanges: [{"eid":"Futures_Binance","currency":"BTC_USDT"}]
*/

//@version=4
// author: capissimo
strategy("Normalized Vector Strategy, ver.3 (sc)", precision=2, overlay=false)
// This is a scaled Normalized Vector Strategy with a Karobein Oscillator
// original: Drkhodakarami (https://www.tradingview.com/script/Fxv2xFWe-Normalized-Vector-Strategy-By-Drkhodakarami-Opensource/)

// Repainting: in general there two types of repainting:
// * when the last candle is constantly being redrawn
// * when the indicator draws a different configuration after it has been deactivated/reactivated, i.e. refreshed

// The former is a natural behaviour, which presents a constant source of frustration,
// when a signal directly depends on the current market situation and can be overcome
// with various indirect techniques like divergence.

// The latter suggests a flaw in the indicator design.
// Unfortunately, the Normalized Vector Strategy is repainting in the latter sense, although being
// really promising. Would be nice if our community suggests a solution to this problem ))

// This strat consistently performs with high accuracy, showing up to 96% scores
// Here are some of the best parameters:
// TF     Lookback   Performance (ca.)
// 1m     13         92%
// 3m     34         92%
// 5m     85         92%
// 15m    210        90%
// 30m    360        89%
// 1H     1440,720   94%, 87%

// The Karobein Oscillator has an intrinsic sinusoidal behaviour that helps in determining direction and timing.
// It does not repaint.
// original: alexgrover (https://www.tradingview.com/script/JiNi0f62-Karobein-Oscillator/)

scaleMinimax(X, p, min, max) =>
    hi = highest(X, p), lo = lowest(X, p)
    (max - min) * (X - lo)/(hi - lo) + min

price    = input(close,  "Price Data")
tf       = input(34,     "Timeframe", minval=1, maxval=1440)
thresh   = input(14.,    "Threshold", minval=.1, step=.1)
div      = input(1000000,"Divisor", options=[1,10,100,1000,10000,100000,1000000,10000000,100000000])
showVol  = input(false,  "Volume")
useold   = input(true,   "Use Old System")

lime  = color.new(color.lime, 10), fuchsia = color.new(color.fuchsia, 10),
black = color.new(color.black, 100), gray = color.new(color.gray, 50)

vol  = useold ? security(syminfo.tickerid, tostring(tf), volume, barmerge.gaps_off, barmerge.lookahead_on)
              : security(syminfo.tickerid, tostring(tf), volume)
obv  = cum(change(price) > 0 ? vol : change(price) < 0 ? -vol : 0*vol)
prix = showVol ? obv : price

getdiff(prc, tf) =>
    prev  = useold ? security(syminfo.tickerid, tostring(tf), prc[1], barmerge.gaps_off, barmerge.lookahead_on) :
                     security(syminfo.tickerid, tostring(tf), prc[1])
    curr  = useold ? security(syminfo.tickerid, tostring(tf), prc, barmerge.gaps_off, barmerge.lookahead_on) :
                     security(syminfo.tickerid, tostring(tf), prc)
    (curr/prev) - 1

p  = getdiff(prix, tf)
up = thresh/div, dn = -thresh/div
longCondition  = crossover(p, up)
shortCondition = crossunder(p, dn)

bg = longCondition ? lime : shortCondition ? fuchsia : black
cl = p > up ? color.green : p < dn ? color.red : color.silver

bgcolor(bg, editable=false)
plot(scaleMinimax(up, 2500, -1, 1), color=lime, editable=false, transp=0)
hline(0, linestyle=hline.style_dotted, title="base line", color=gray, editable=false)
plot(scaleMinimax(dn, 2500, -1, 1), color=fuchsia, editable=false, transp=0)
plot(scaleMinimax(p, 2500, -1, 1), color=cl, style=plot.style_histogram, transp=70, editable=false)
plot(scaleMinimax(p, 2500, -1, 1), color=cl, style=plot.style_linebr, title="prediction", transp=0, editable=false)

strategy.entry("L", true, 1, when=longCondition)
strategy.entry("S", false, 1, when=shortCondition)

alertcondition(longCondition, title='Long', message='Long Signal!')
alertcondition(shortCondition, title='Short', message='Short Signal!')

//*** Karobein Oscillator
per  = input(8, "Karobein Osc Lookback")

prix2  = ema(price, per)
a = ema(prix2 < prix2[1] ? prix2/prix2[1] : 0, per)
b = ema(prix2 > prix2[1] ? prix2/prix2[1] : 0, per)
c = (prix2/prix2[1])/(prix2/prix2[1] + b)
d = 2*((prix2/prix2[1])/(prix2/prix2[1] + c*a)) - 1

plot(scaleMinimax(d, 2500, -1, 1), color=color.orange, transp=0)
Published by ChaoZhang on the FMZ strategy square · last modified 2023-11-03. Collected in the Quant Trading Vault. Unvalidated research: re-test with your own data and costs before trusting it.
Build this with AgenKit
A spec is not a trading system. Paste this into your coding agent and AgenKit runs a specialist team — architecture, test-first build, risk gates, review — with paper trading on by default.
/agenkit build a production-grade trading bot with a backtest engine, risk controls and paper trading by default from strategies/Scaled-Normalized-Vector-Strategy-with-Karobein-Mean-Reversion.md- npx agenkit install engineering-kit in your project
- Paste the command into your agent and approve each phase
- Get tests, backtest, risk controls and a paper-trading switch
Understand it first
Before you run this, read the lesson behind the idea and how to backtest it honestly. Specs like this one are the survivors of an unknown number of trials; deflate their results accordingly.
Related specs
- BabyShark VWAP Trading Strategy Based on VWAP and OBV RSI IndicatorsPine Script · Mean reversion · 2h
- Multi Indicator EMA StrategyPine Script · Mean reversion · 4h
- Multi factor Quantitative Trading Strategy 440526Pine Script · Mean reversion · 4h
- 1 2 3 Pattern Quantitative Trading Strategy with EMAs MACD and 4th Candle ExtensionPine Script · Mean reversion · 1h
- ATR and EMA based Dynamic Take Profit and Stop Loss Adaptive StrategyPine Script · Mean reversion · 1h
- Advanced 15 Minute Chart Trading Signal StrategyPine Script · Mean reversion · 3h