Scalping Strategy based on RSI Indicator with Trailing Stop Loss
This strategy is named "Scalping Strategy based on RSI Indicator with Trailing Stop Loss". It utilizes the RSI indicator to determine overbought and oversold conditions, combines with fast and slow Moving Averages…
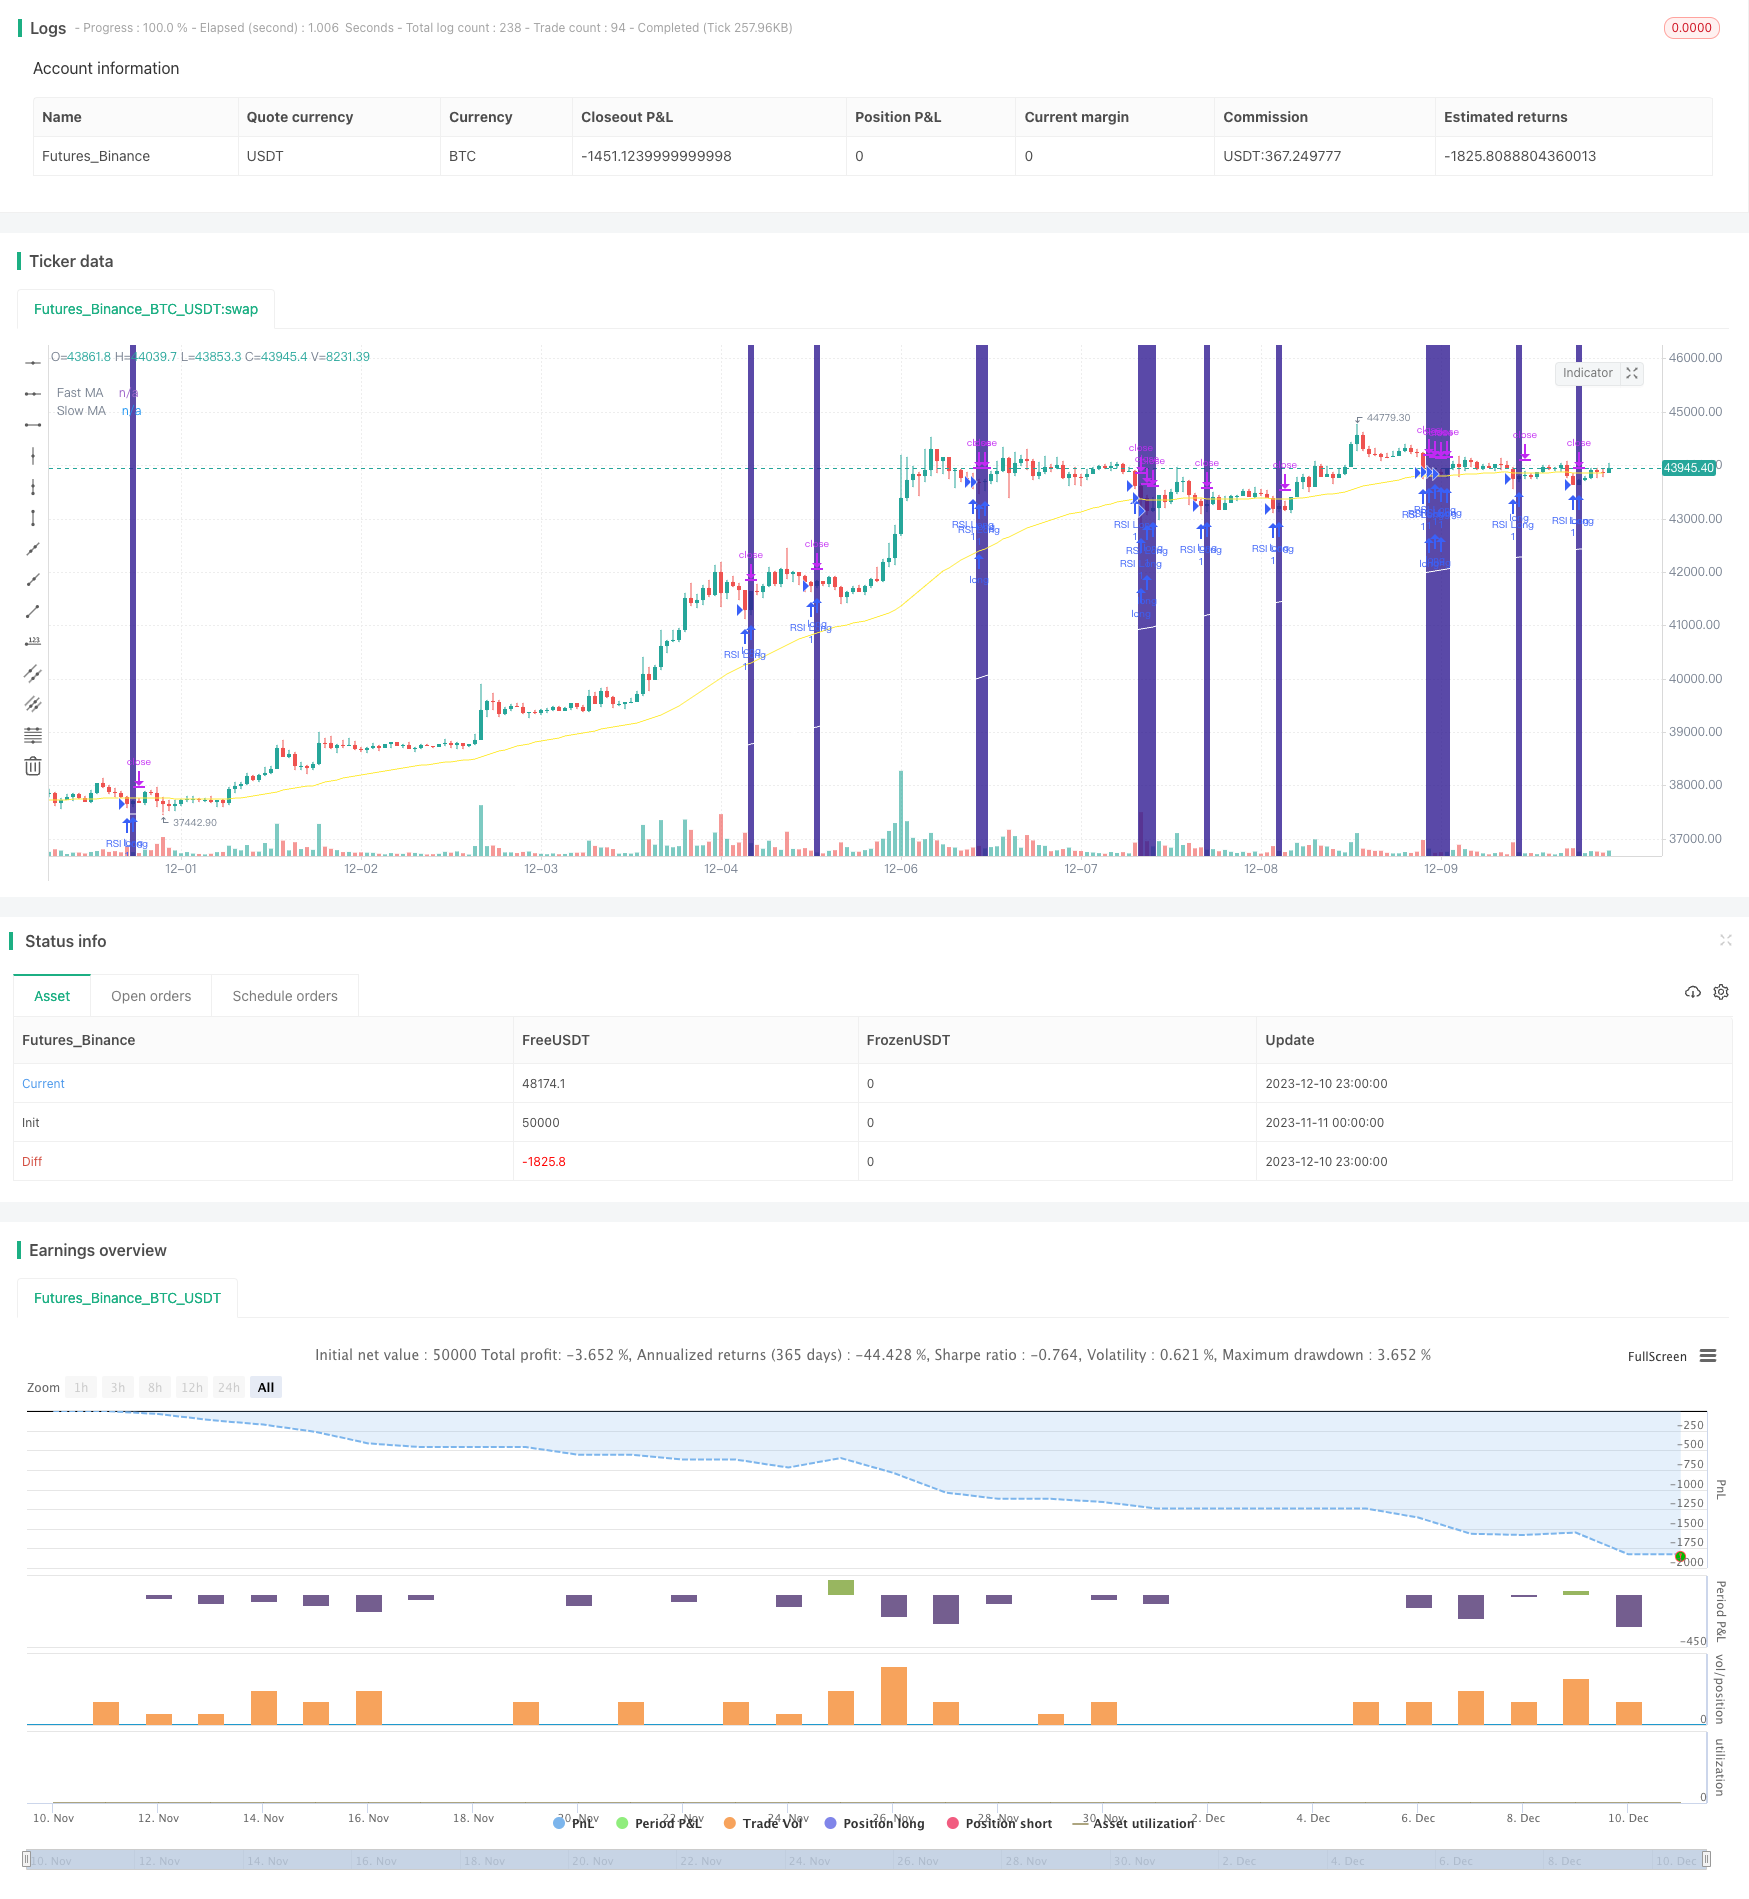
Overview
This strategy is named "Scalping Strategy based on RSI Indicator with Trailing Stop Loss". It utilizes the RSI indicator to determine overbought and oversold conditions, combines with fast and slow Moving Averages (MA) to determine the trend direction, and sets the entry conditions. It also uses percentage trailing stop loss mechanism to exit positions.
Strategy Logic
The entry signals of this strategy are mainly determined by the RSI indicator and MA crossovers. The RSI parameter is set to 2 periods to quickly capture overbought and oversold situations for reversal opportunities. The fast MA and slow MA are set to 50 and 200 periods respectively to identify the trend direction. Specifically, the entry logic is:
Long entry: Fast MA crosses above slow MA, price is above slow MA, and RSI is below oversold level (default 10%); Short entry: Fast MA crosses below slow MA, price is below slow MA, and RSI is above overbought level (default 90%).
In addition, there is an optional volatility filter in the strategy. It calculates the difference between the slopes of fast and slow MAs. Positions will only be opened when the difference exceeds a threshold. The purpose is to avoid opening positions when there is no clear direction during market fluctuation.
On the exit side, the strategy uses percentage trailing stop loss. Based on the input percentage, it calculates the stop loss price combined with the tick size, to dynamically adjust the stop loss.
Advantage Analysis
The main advantages of this strategy are:
- RSI set to 2 periods can quickly capture overbought and oversold situations for reversal opportunities.
- Fast and slow MAs can effectively identify trend direction and turning points.
- RSI and MA dual indicators combination avoids false breakouts.
- Volatility filter avoids opening positions when there is no clear direction during fluctuation.
- Percentage trailing stop loss can adjust stop loss level based on market volatility to effectively control risks.
Risk Analysis
There are also some risks in this strategy:
- RSI and MA indicators have some lagging effect, may miss some reversal opportunities.
- Percentage stop loss is likely to be triggered in low volume declines.
- Significant overnight and pre-market price swings are not handled effectively.
The optimization directions for the risks are:
- Adjust RSI parameter to 1 period to reduce lagging effect.
- Optimize MA periods based on symbol characteristics.
- Adjust percentage stop loss level to balance between stop loss and fluctuation tolerance.
Optimization Directions
The optimization directions for this strategy are:
- Add other indicators judgments, like volume, to avoid false breakout signals.
- Add machine learning model predictions to assist in decision making.
- Optimize pyramiding times and position sizing to further improve return.
- Set up filters for overnight and pre-market price swings. Determine whether to participate in next trading day based on fluctuation.
Conclusion
In general, this is a relatively stable trend following strategy. By combining dual RSI and MA indicators, it ensures certain stability while capturing clearer trend reversal opportunities. The volatility filter avoids some risks, and percentage stop loss also effectively controls single trade loss. This strategy can be used as a multi-symbol generic strategy, and can also be optimized on parameters and models for specific symbols to achieve better results.
Parameters
| Name | Default | What it controls |
|---|---|---|
| v_input_1 | def_start_date | Start date |
| v_input_2 | def_end_date | End date |
| v_input_3_close | 0 | Source: close | high | low | open | hl2 | hlc3 | hlcc4 | ohlc4 |
| v_input_4 | 2 | RSI Length |
| v_input_5 | 90 | Overbought threshold |
| v_input_6 | 10 | Oversold threshold |
| v_input_7 | 200 | Slow MA length |
| v_input_8 | 50 | Fast MA length |
| v_input_9 | 0 | MA choice: EMA | SMA |
| v_input_10 | 0.5 | Ticker size |
| v_input_11 | true | Trend Filter |
| v_input_12 | true | Trailing Stop % |
Source Pine Script
/*backtest
start: 2023-11-11 00:00:00
end: 2023-12-11 00:00:00
period: 1h
basePeriod: 15m
exchanges: [{"eid":"Futures_Binance","currency":"BTC_USDT"}]
*/

// Scalping strategy
// © Lukescream and Ninorigo
// (original version by Lukescream - lastest versions by Ninorigo) - v1.3
//

//@version=4
strategy(title="Scalping using RSI 2 indicator", shorttitle="RSI 2 Strategy", overlay=true, pyramiding=0, process_orders_on_close=false)

var bool ConditionEntryL = false
var bool ConditionEntryS = false


//***********
// Costants
//***********
def_start_date = timestamp("01 Jan 2021 07:30 +0000")
def_end_date   = timestamp("01 Dec 2024 07:30 +0000")

def_rsi_length = 2
def_overbought_value = 90
def_oversold_value   = 10

def_slow_ma_length = 200
def_fast_ma_length = 50
def_ma_choice      = "EMA"

def_tick   = 0.5
def_filter = true

def_trailing_stop = 1


//***********
// Change the optional parameters
//***********
start_time  = input(title="Start date", defval=def_start_date, type=input.time)
end_time    = input(title="End date", defval=def_end_date, type=input.time)
// RSI
src         = input(title="Source", defval=close, type=input.source)
rsi_length  = input(title="RSI Length", defval=def_rsi_length, minval=1, type=input.integer)
overbought_threshold = input(title="Overbought threshold", defval=def_overbought_value, type=input.float)
oversold_threshold   = input(title="Oversold threshold", defval=def_oversold_value, type=input.float)
// Moving average
slow_ma_length = input(title="Slow MA length", defval=def_slow_ma_length, type=input.integer)
fast_ma_length = input(title="Fast MA length", defval=def_fast_ma_length, type=input.integer)
ma_choice = input(title="MA choice", defval="EMA", options=["SMA", "EMA"])
// Input ticker
tick   = input(title="Ticker size", defval=def_tick, type=input.float)
filter = input(title="Trend Filter", defval=def_filter, type=input.bool)
// Trailing stop (%)
ts_rate = input(title="Trailing Stop %", defval=def_trailing_stop, type=input.float)


//***********
// RSI
//***********
// Calculate RSI
up   = rma(max(change(src), 0), rsi_length)
down = rma(-min(change(src), 0), rsi_length)
rsi = (down == 0 ? 100 : (up == 0 ? 0 : 100-100/(1+up/down)))


//***********
// Moving averages
//***********
slow_ma = (ma_choice == "SMA" ? sma(close, slow_ma_length) : ema(close, slow_ma_length))
fast_ma = (ma_choice == "SMA" ? sma(close, fast_ma_length) : ema(close, fast_ma_length))
// Show the moving averages
plot(slow_ma, color=color.white,  title="Slow MA")
plot(fast_ma, color=color.yellow, title="Fast MA")


//***********
// Strategy
//***********
if true
    // Determine the entry conditions (only market entry and market exit conditions)
    // Long position
    ConditionEntryL := (filter == true ? (fast_ma > slow_ma and close > slow_ma and rsi < oversold_threshold) : (fast_ma > slow_ma and rsi < oversold_threshold))
    // Short position
    ConditionEntryS := (filter == true ? (fast_ma < slow_ma and close < slow_ma and rsi > overbought_threshold) : (fast_ma < slow_ma and rsi > overbought_threshold))

    // Calculate the trailing stop
    ts_calc = close * (1/tick) * ts_rate * 0.01

    // Submit the entry orders and the exit orders
    // Long position
    if ConditionEntryL
        strategy.entry("RSI Long", strategy.long)
    // Exit from a long position
    strategy.exit("Exit Long", "RSI Long", trail_points=0, trail_offset=ts_calc)

    // Short position
    if ConditionEntryS
        strategy.entry("RSI Short", strategy.short)
    // Exit from a short position
    strategy.exit("Exit Short", "RSI Short", trail_points=0, trail_offset=ts_calc)

// Highlights long conditions
bgcolor (ConditionEntryL ? color.navy : na, transp=60, offset=1, editable=true, title="Long position band")
// Highlights short conditions
bgcolor (ConditionEntryS ? color.olive : na, transp=60, offset=1, editable=true, title="Short position band")
Published by ChaoZhang on the FMZ strategy square · last modified 2023-12-12. Collected in the Quant Trading Vault. Unvalidated research: re-test with your own data and costs before trusting it.
Build this with AgenKit
A spec is not a trading system. Paste this into your coding agent and AgenKit runs a specialist team — architecture, test-first build, risk gates, review — with paper trading on by default.
/agenkit build a production-grade trading bot with a backtest engine, risk controls and paper trading by default from strategies/Scalping-Strategy-based-on-RSI-Indicator-with-Trailing-Stop-Loss.md- npx agenkit install engineering-kit in your project
- Paste the command into your agent and approve each phase
- Get tests, backtest, risk controls and a paper-trading switch
Understand it first
Before you run this, read the lesson behind the idea and how to backtest it honestly. Specs like this one are the survivors of an unknown number of trials; deflate their results accordingly.
Related specs
- 20Bitcoin and Gold 5 Minute Scalping Strategy 20Pine Script · Scalping · 1h
- Scalping EMA ADX RSI with Buy SellPine Script · Scalping · 5m
- Super ScalperPine Script · Scalping · 1m
- Super Scalper 5 Min 15 MinPine Script · Scalping · 5m
- Gem Forest One Minute Scalping StrategyPine Script · Scalping · 1h
- Multi Timeframe Support Resistance Momentum Scalping Strategy with Volatility Adjusted Risk ManagementPine Script · Scalping · 1h