Scalping Trading Strategy Based on Double Moving Average
This is an oscillation trading strategy based on double moving averages. It uses the crossover of fast and slow moving averages as buy and sell signals. When the fast MA crosses above the slow MA, a buy signal is…
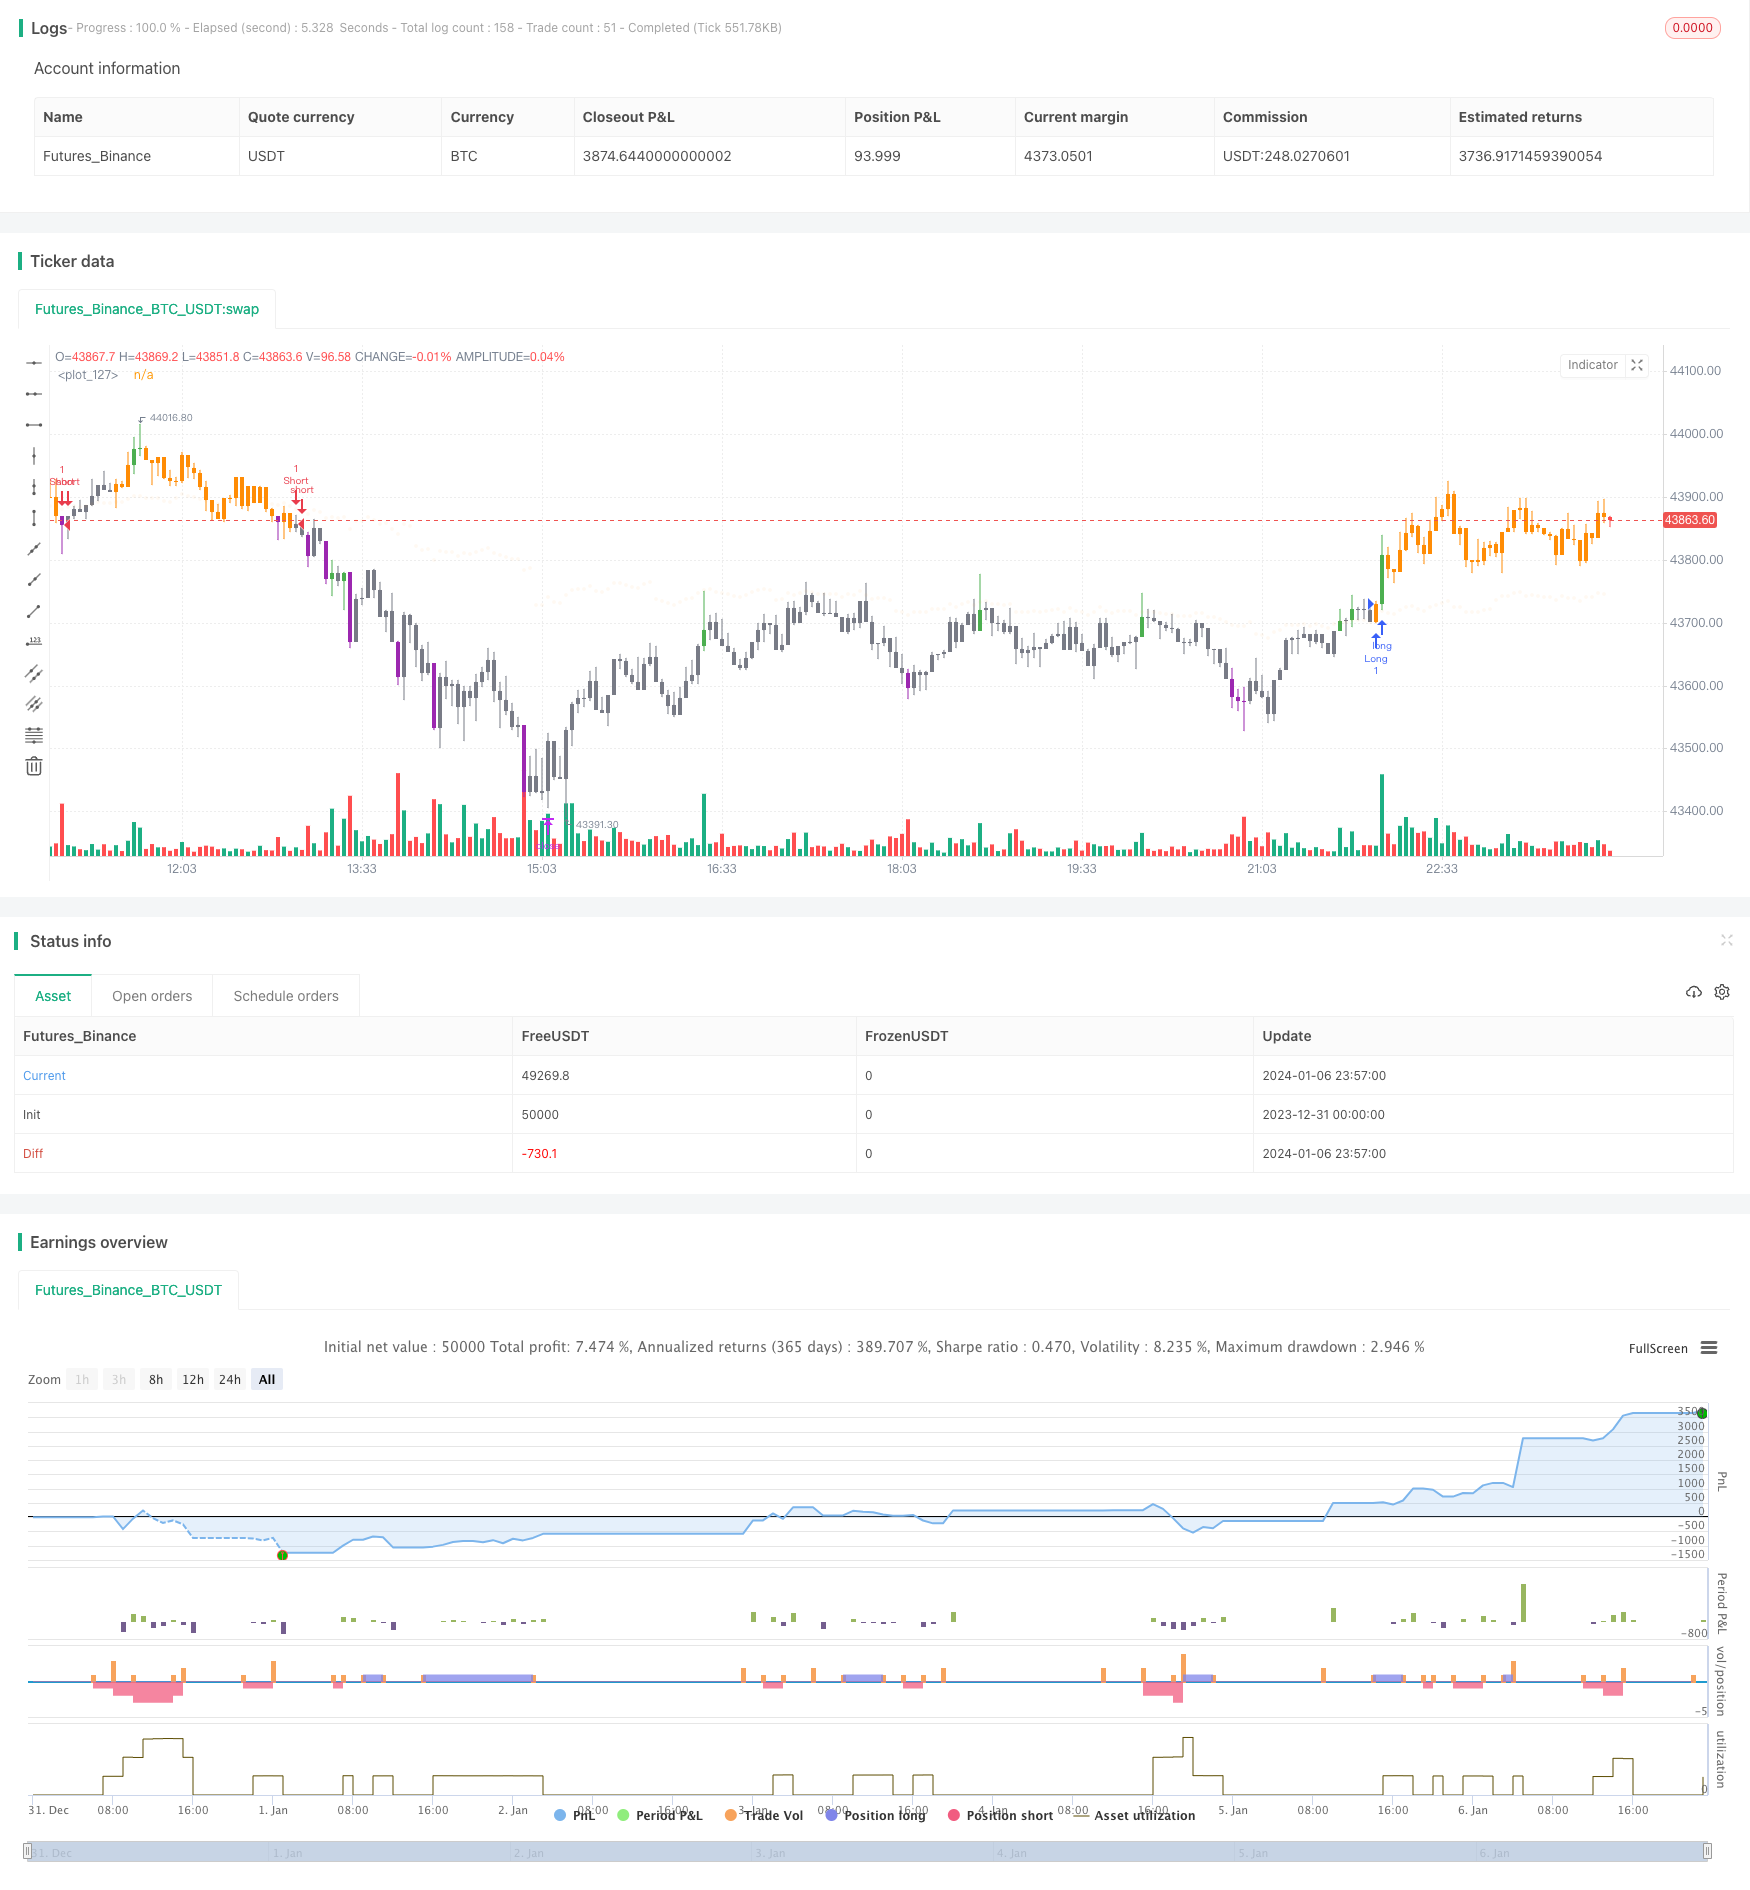
Overview
This is an oscillation trading strategy based on double moving averages. It uses the crossover of fast and slow moving averages as buy and sell signals. When the fast MA crosses above the slow MA, a buy signal is generated. When the fast MA crosses below the slow MA, a sell signal is generated. This strategy is suitable for range-bound markets and capturing short-term price fluctuations.
Strategy Logic
The strategy uses a 6-period RMA as the fast MA and a 4-period HMA as the slow MA. It judges price trends and generates trading signals based on the crossover between the fast and slow lines.
When the fast line crosses above the slow line, it indicates a short-term trend change from decline to rise, which is a timing of chip transfer. Hence a buy signal is generated. Conversely, when the fast line crosses below the slow line, a sell signal is generated.
In addition, long-term trend judgments are made to avoid trading against the trend. Actual buy/sell signals are only generated when the long-term trend aligns with the signal.
Advantages
The advantages of this strategy include:
The double MA crossover effectively identifies short-term reversal points.
The fast and slow MA lengths are reasonably combined to produce accurate signals.
Long/short-term trend filtering removes most false signals.
Take profit and stop loss logic actively manages risks.
It is easy to understand and implement, suitable for beginners.
Risks and Solutions
There are also some risks:
Prone to multiple small profits but one huge loss. Fine tune TP/SL levels.
Frequent trading under range-bound markets. Relax trading conditions.
Overfitting parameters. Robustness test needed.
Underperforms under trending markets. Add trend module or combine with trend strategies.
Optimization Directions
Some directions to optimize the strategy:
Upgrade MAs with adaptive Kalman filters etc.
Add ML model to improve signal accuracy.
Add capital management module to automate risk control.
Combine with high-frequency factors for stronger signals.
Cross-market arbitrage across products.
Conclusion
In conclusion, this double MA strategy is a typical and practical quant strategy. It has good adaptivity for beginners to learn from, meanwhile has great potential to optimize further with more quant techniques for better results.
Parameters
| Name | Default | What it controls |
|---|---|---|
| v_input_1 | true | (?⚙ Settings)Bar Color |
| v_input_2 | true | Show Alerts |
| v_input_timeframe_1 | 0 | ? Timeframe: 60 | 5 | 15 | 30 | 1 | 120 | 240 | 360 | 720 | D | W |
| v_input_3 | true | Show Take Profit/Stop Loss |
| v_input_string_1 | 0 | (?⚙ D-Panel Settings️)⚙ D-Panel Location: Bottom Center | Top Right | Bottom Right |
| v_input_string_2 | 0 | ⚙ D-Painel Size: Big | Small | Tiny |
| v_input_float_1 | 4500 | (?⚙ Risk Management)Take Profit: |
| v_input_float_2 | 2500 | Stop Loss: |
| v_input_int_1 | 20 | (?⚙️ Scanner Market Makers Settings)Period Volume |
| v_input_float_3 | 1.85 | Proportion to the mean: (1.25 = 125% of the mean) |
Source Pine Script
/*backtest
start: 2023-12-31 00:00:00
end: 2024-01-07 00:00:00
period: 3m
basePeriod: 1m
exchanges: [{"eid":"Futures_Binance","currency":"BTC_USDT"}]
*/

// This source code is subject to the terms of the Mozilla Public License 2.0 at https://mozilla.org/MPL/2.0/
// © dc_analytics
// https://datacryptoanalytics.com/


//@version=5
strategy("Scalping Trading", overlay=true)

//  INPUTS  //
bar_color       = input(true, title='Bar Color', group='⚙ Settings',tooltip='Color chart bars.', inline = "1")
mostrar         = input(true, 'Show Alerts', group='⚙ Settings', inline = "1")
tempo           = input.timeframe('60', group='⚙ Settings', title='? Timeframe', options=['1', '5', '15', '30', '60', '120', '240', '360', '720', 'D', 'W'])

i_position      = input.string("Bottom Center", title = "⚙ D-Panel Location",
 options = ["Top Right", "Bottom Center", "Bottom Right"], group='⚙ D-Panel Settings️',
 tooltip='Choose the location of the information table on the chart.(D-Panel) ')

position        = i_position == "Top Right" ? position.top_right : i_position == "Bottom Center" ? position.bottom_center : position.bottom_right

i_tam           = input.string('Big', title = '⚙ D-Painel Size',
 options = ["Tiny", "Small", "Big"], group='⚙ D-Panel Settings️',tooltip='Choose the size of the information panel (D-Panel).')

tamanho         = i_tam == "Tiny" ? size.tiny : i_tam == "Small" ? size.small : size.normal

show_tp_sl      = input(true, title='Show Take Profit/Stop Loss', group='⚙ Settings',tooltip='Show Take Profit/Stop Loss.')
TP              = input.float(defval=4500, title='Take Profit:',group='⚙ Risk Management',tooltip='Choose amount of profit')
SL              = input.float(defval=2500, title='Stop Loss:', group='⚙ Risk Management',tooltip='Choose amount of loss')
//  END INPUTS  //


//  DECLARATIONS  //
t_up    = '?'
t_down  = '?'

c_buy   = 'Long ⇡'
c_sell  = 'Short ⇣'

// _DECLARATION TREND
t_sma       = ta.hma(close, 200)
tend_sma    = ta.sma(close, 12)

tendencia   = request.security(syminfo.tickerid, timeframe.period, t_sma, barmerge.gaps_off, barmerge.lookahead_off)
tend_tabela = request.security(syminfo.tickerid, timeframe.period, tend_sma, barmerge.gaps_off, barmerge.lookahead_off)
// _END DECLARATION TREND

circle = plot.style_circles
//  END DECLARATIONS  //


//  COLORS  //
color gray   = color.gray
color red    = color.new(#ff8c05, 0)
color orange = color.new(#ff8c05, 0)
color silver = color.silver
color up_vol = color.new(color.green, 0)
color dn_vol = color.new(color.purple, 0)

color orange_tranp  = color.new(#ff8c05, 95)
// END COLORS //

//  SCANNER MARKET MAKERS  //
periodo  = input.int(20, 'Period Volume', group='⚙️ Scanner Market Makers Settings')
fator    = input.float(1.85, 'Proportion to the mean: (1.25 = 125% of the mean)', minval=0, group='⚙️ Scanner Market Makers Settings')
vol_up   = close > open
vol_down = open > close
vol      = volume
pesado   = volume > ta.ema(volume, periodo) * fator

palette  = pesado and vol_up ? gray : pesado and vol_down ? orange : vol_up ? silver : gray
//  END SCANNER MARKET MAKERS  //


//  LOGIC ONE  //
s = ta.rma(close, 6)
v = ta.hma(close, 4)

//  TREND
t_baixa     = tendencia > tendencia[1]
t_alta      = tendencia < tendencia[1]

te_d        = tend_tabela > tend_tabela[1]
trend       = te_d ? t_up : t_down
//  END TREND

a = request.security(syminfo.tickerid, tempo, s)
b = request.security(syminfo.tickerid, tempo, ohlc4)

c_dn   = a > b and a[1] < b[1]
c_up   = b > a and b[1] < a[1]

compra = mostrar and c_up ? a : na
venda  = mostrar and c_dn ? a : na

s_sell = venda and t_alta
s_buy  = compra and t_baixa
c_vela = b > a and te_d ? gray : orange

s_up = false
s_dw = false

b_sinal = not s_up and s_buy
s_sinal = not s_dw and s_sell

if b_sinal
    s_dw := false
    s_up := true
    s_up

if s_sinal
    s_dw := true
    s_up := false
    s_up

// END LOGIC ONE //


//  DATA TABLE  //
c = b > a ? orange : gray
c_sinal = b > a ? c_buy : c_sell
//  END DATA TABLE  //


//  PLOT/BARCOLOR  //
c_barcolor = pesado and vol_up ? up_vol : pesado and vol_down ? dn_vol : vol_up ? c : c

barcolor(bar_color ? c_barcolor : na)
plot(a, color=orange_tranp, style=circle)
//  END PLOT/BARCOLOR  //


//  TABLE  //
var dash = table.new(position=position, columns=2, rows=3, border_width=1)
if barstate.islast
    table.cell(table_id=dash, column=1, row=2, text='Scalping DCA', bgcolor=orange)
    table.cell(table_id=dash, column=1, row=0, text='Trade: ' + c_sinal)
    table.cell(table_id=dash, column=1, row=1, text='Trend: ' + trend)
//  END TABLE  //


//  SETTINGS STRATEGY  //
exitPrice = strategy.closedtrades.exit_price(strategy.closedtrades - 1)

// OPEN ORDER
if (b_sinal)
    strategy.order("Long", strategy.long , comment = "Entry: " + str.tostring(close, "#.####"))
//    strategy.exit("EXIT", trail_points = 1000, trail_offset = 0, comment_trailing = "Close with Profit: " + str.tostring(close, "#.####"))
//    strategy.entry("long", strategy.long)

if (s_sinal)
    strategy.order("Short", strategy.short , comment = "Entry: " + str.tostring(close, "#.####"))
//    strategy.exit("EXIT", trail_points = 1000, trail_offset = 0, comment_trailing = "Close with Profit: " + str.tostring(close, "#.####"))
//    strategy.entry("short", strategy.short)

//  TP/SL ORDERS
if strategy.position_size > 0
    strategy.exit('Long_Close', 'Long',profit = TP , loss=SL, qty_percent=100, comment_profit = "Profit Long: " + str.tostring(exitPrice, "#.####"), comment_loss = "Stop Long: " + str.tostring(exitPrice, "#.####"))
//if  strategy.position_size > 0
//    strategy.exit("Long", "Long", stop = longSL, limit = longTP, comment_profit = "Profit Long: " + str.tostring(exitPrice, "#.####"), comment_loss = "Stop Long: " + str.tostring(exitPrice, "#.####"))

if strategy.position_size < 0
    strategy.exit('Short_Close', 'Short',profit = TP, loss=SL, qty_percent=100, comment_profit = "Profit Short: " + str.tostring(exitPrice, "#.####"), comment_loss = "Stop Short: " + str.tostring(exitPrice, "#.####"))
//if strategy.position_size < 0
//    strategy.exit("Short", "Short", stop = shortSL, limit = shortTP, comment_profit = "Profit Short: "+ str.tostring(exitPrice, "#.####"), comment_loss = "Stop Short: " + str.tostring(exitPrice, "#.####"))

//  END SETTINGS STRATEGY  //

// LOGS
// if strategy.opentrades > 10
//     log.warning("{0} positions opened in the same direction in a row. Try adjusting `bracketTickSizeInput`", strategy.opentrades)

// last10Perc = strategy.initial_capital / 10 > strategy.equity
// if (last10Perc and not last10Perc[1])
// log.error("The strategy has lost 90% of the initial capital!")Published by ChaoZhang on the FMZ strategy square · last modified 2024-01-08. Collected in the Quant Trading Vault. Unvalidated research: re-test with your own data and costs before trusting it.
Build this with AgenKit
A spec is not a trading system. Paste this into your coding agent and AgenKit runs a specialist team — architecture, test-first build, risk gates, review — with paper trading on by default.
/agenkit build a production-grade trading bot with a backtest engine, risk controls and paper trading by default from strategies/Scalping-Trading-Strategy-Based-on-Double-Moving-Average.md- npx agenkit install engineering-kit in your project
- Paste the command into your agent and approve each phase
- Get tests, backtest, risk controls and a paper-trading switch
Understand it first
Before you run this, read the lesson behind the idea and how to backtest it honestly. Specs like this one are the survivors of an unknown number of trials; deflate their results accordingly.
Related specs
- 20Bitcoin and Gold 5 Minute Scalping Strategy 20Pine Script · Scalping · 1h
- Scalping EMA ADX RSI with Buy SellPine Script · Scalping · 5m
- Super ScalperPine Script · Scalping · 1m
- Advanced Multi Trend Confirmation EMA Supply Demand Zone Dynamic Scalping StrategyPine Script · Scalping · 1d
- Bollinger Awesome Alert R1Pine Script · Scalping · 1h
- MACD Willy StrategyPine Script · Scalping · 1h