Strategy vault / Mean reversion
scillator Profile Reversal Strategy Based on Multi Timeframe MACD Zero crossing
The 3 10.0 Oscillator Profile Reversal strategy identifies potential price reversals by calculating MACD indicators across different timeframes. It adopts a trend-following stop loss approach to pursue higher capital…
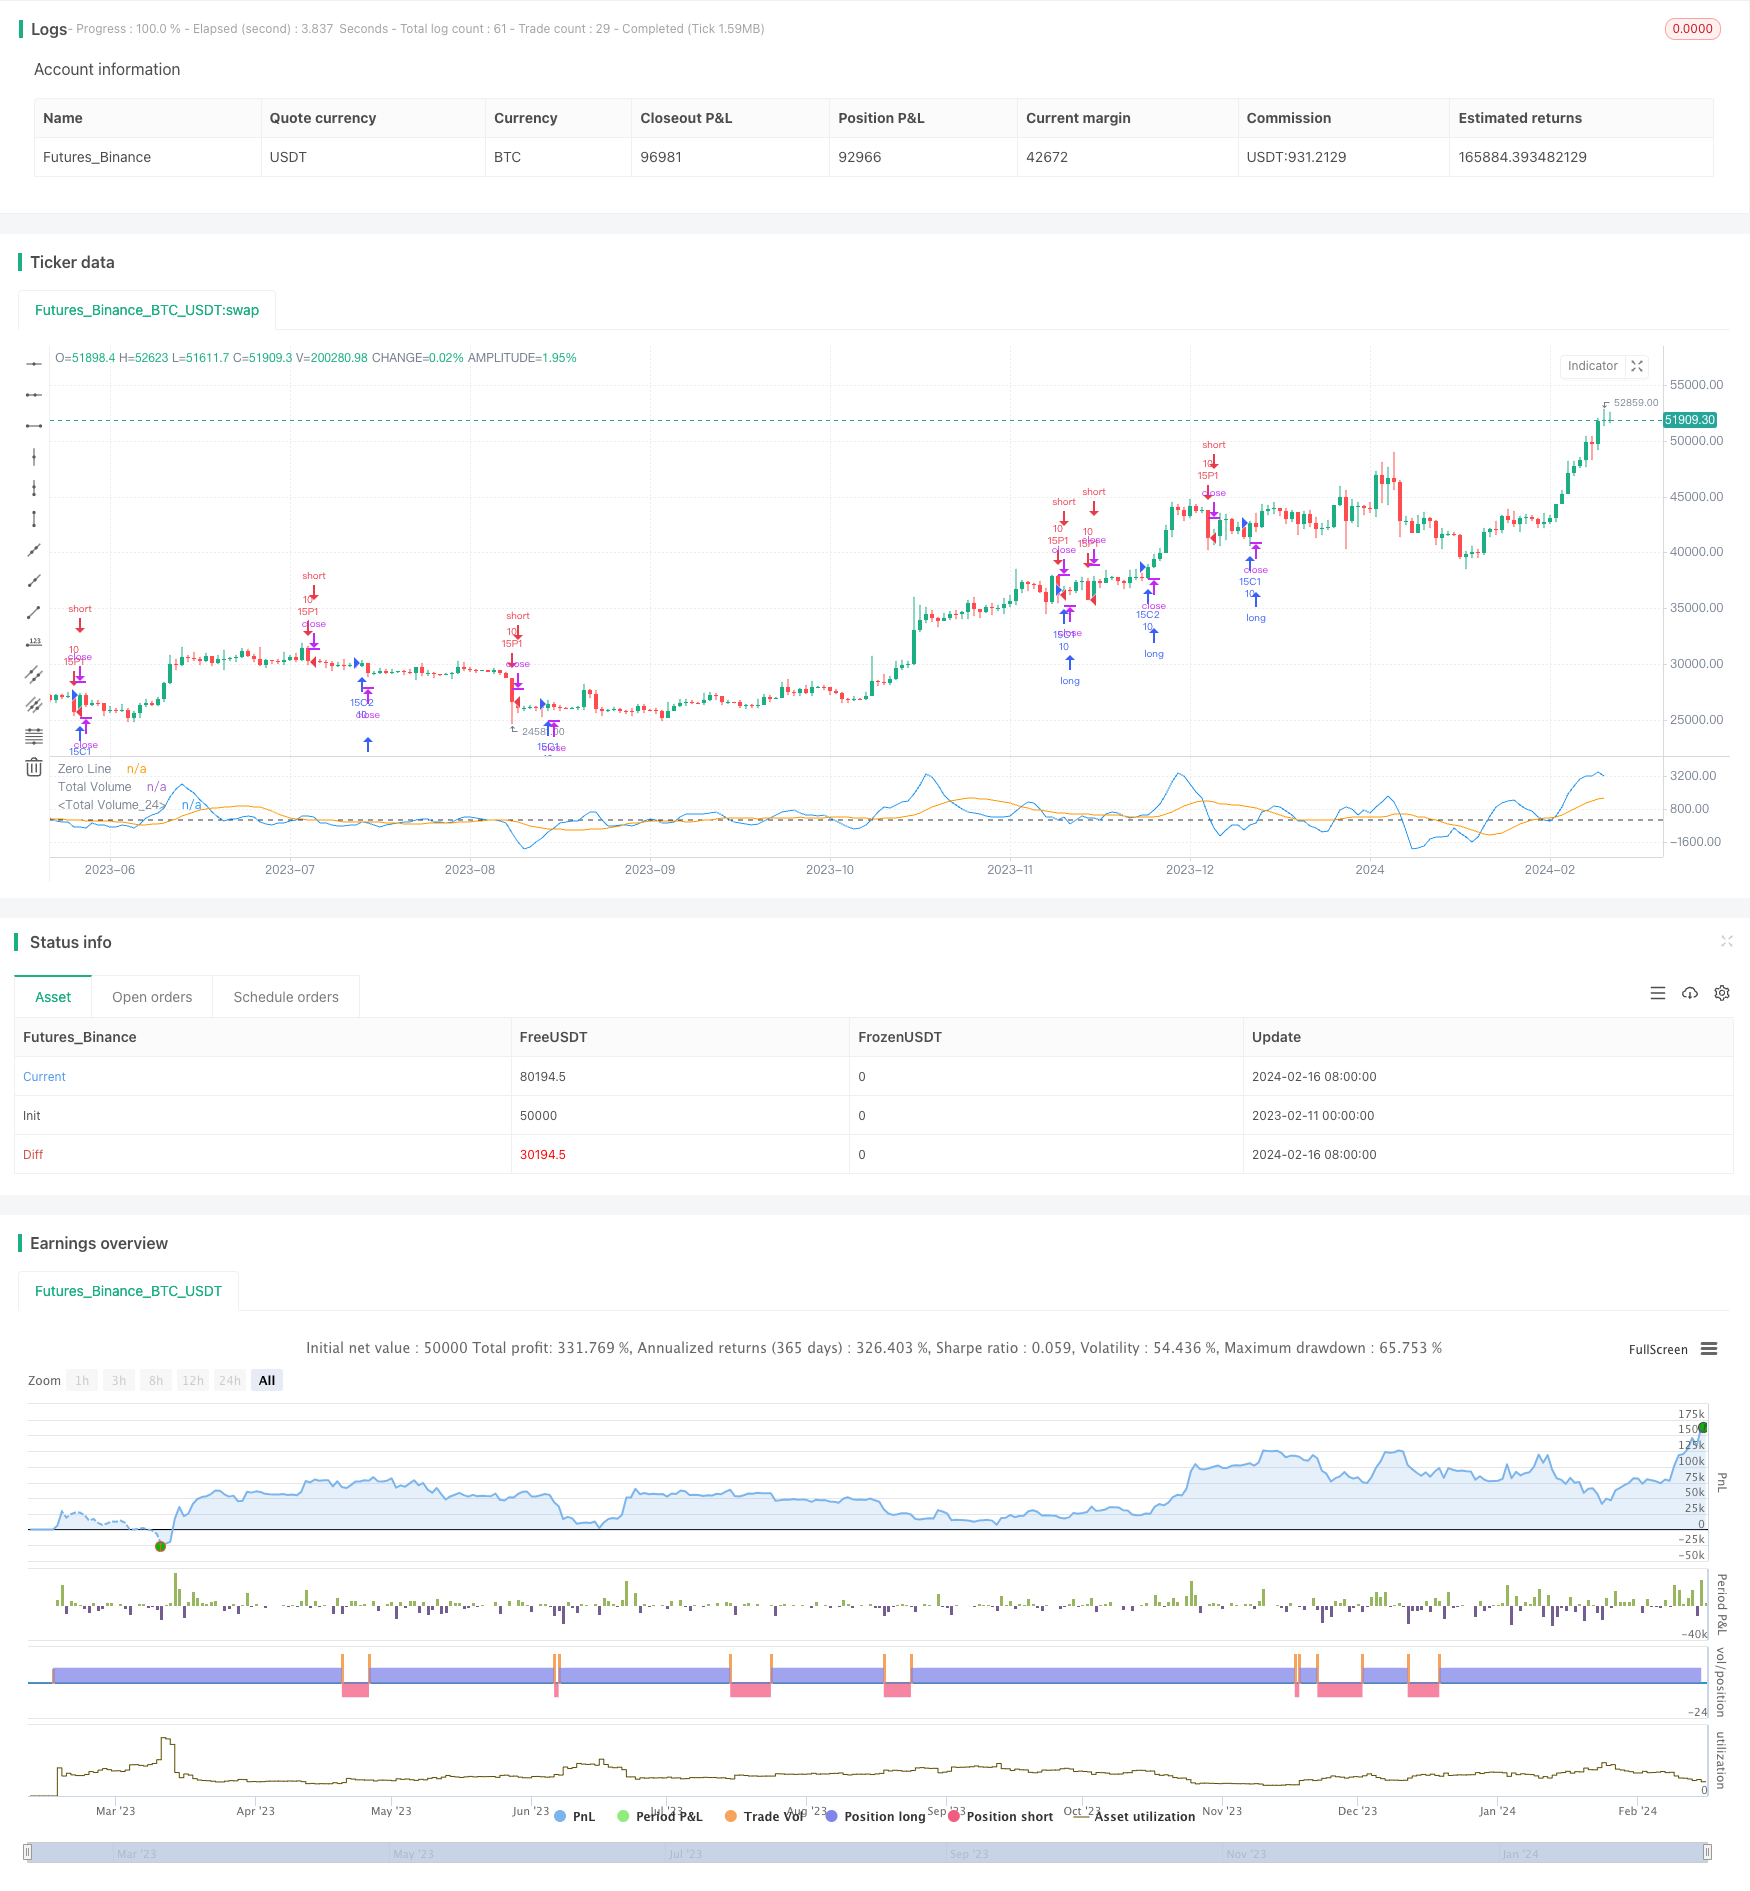
Overview
The 3 10.0 Oscillator Profile Reversal strategy identifies potential price reversals by calculating MACD indicators across different timeframes. It adopts a trend-following stop loss approach to pursue higher capital efficiency.
Strategy Logic
The strategy calculates SMA moving averages of 3 and 10 periods to construct fast and slow lines and the MACD indicator and signal line. When the fast line and signal line cross the zero line upward or downward, it indicates the price has reached a critical point and a reversal may occur. In addition, it also incorporates volume pressure judgment, RSI index etc. to identify reliability of reversal signals. It goes long or short when reversal signals meet certain reliability requirements.
Specifically, the strategy judges price reversals through:
- MACD zero-crossing indicates price reaches critical point
- Volume pressure judges bullish or bearish sentiment
- RSI index with MACD slope change determines strength of reversal signals
- Fast line and signal line crossing in reverse direction forms reversal signal
When reversal signal reliability is high, the strategy adopts trend-following stop loss to pursue higher profit.
Advantage Analysis
The strategy has the following advantages:
- Multiple indicators make reversal signals more reliable
- MACD zero-crossing accurately locates reversal points
- RSI and volume assist judgment to improve reliability
- Trend-following stop loss improves capital efficiency
Risk Analysis
There are also some risks:
- High probability of MACD false signals and being trapped
- High chance of stop loss being hit during alternating trends
- Improper parameter setting may increase trading frequency and cost
Risks can be reduced through:
- Allow wider stop loss to avoid being trapped
- Optimize parameters to lower trading frequency
- Only consider entry near key support/resistance levels
Optimization Directions
The strategy can be further optimized through:
- Add machine learning algorithms to assist reversal signal reliability
- Add sentiment indices to determine bull/bear mentality
- Combine key support/resistance levels to improve entry precision
- Optimize stop loss for higher capital efficiency
- Test optimal parameter combinations to lower trading frequency
Conclusion
The multi timeframe MACD zero-crossing reversal strategy comprehensively considers price, volume and volatility indicators to determine entry timing through multi-indicator evaluation. It sets timely stop loss upon sufficient profitability. It can achieve good returns during reversal markets. Further improvements on machine learning and key level integration may lower risks and trading frequencies while improving profitability.
Parameters
| Name | Default | What it controls |
|---|---|---|
| v_input_1 | 0.26 | Signal Bias |
| v_input_2 | 0.8 | MACD Bias |
| v_input_3 | 3 | Short LookBack |
| v_input_4 | 10 | Long LookBack |
| v_input_5 | 0.8 | Take Profit |
| v_input_6 | 0.75 | Stop Loss |
Source Pine Script
/*backtest
start: 2023-02-11 00:00:00
end: 2024-02-17 00:00:00
period: 1d
basePeriod: 1h
exchanges: [{"eid":"Futures_Binance","currency":"BTC_USDT"}]
*/

//@version=5
strategy("3 10.0 Oscillator Profile Flagging", shorttitle="3 10.0 Oscillator Profile Flagging", overlay=false)

signalBiasValue = input(title="Signal Bias", defval=0.26)
macdBiasValue = input(title="MACD Bias", defval=0.8)
shortLookBack = input( title="Short LookBack", defval=3)
longLookBack = input( title="Long LookBack", defval=10.0)
takeProfit = input( title="Take Profit", defval=0.8)
stopLoss = input( title="Stop Loss", defval=0.75)

fast_ma = ta.sma(close, 3)
slow_ma = ta.sma(close, 10)
macd = fast_ma - slow_ma
signal = ta.sma(macd, 16)
hline(0, "Zero Line", color = color.black)

buyVolume = volume*((close-low)/(high-low))
sellVolume = volume*((high-close)/(high-low))
buyVolSlope = buyVolume - buyVolume[1]
sellVolSlope = sellVolume - sellVolume[1]
signalSlope = ( signal - signal[1] )
macdSlope = ( macd - macd[1] )
plot(macd, color=color.blue, title="Total Volume")
plot(signal, color=color.orange, title="Total Volume")
intrabarRange = high - low
rsi = ta.rsi(close, 14)
rsiSlope = rsi - rsi[1]

getRSISlopeChange(lookBack) =>
    j = 0
    for i = 0 to lookBack
        if ( rsi[i] - rsi[ i + 1 ] ) > -5
            j += 1
    j

getBuyerVolBias(lookBack) =>
    j = 0
    for i = 1 to lookBack
        if buyVolume[i] > sellVolume[i]
            j += 1
    j

getSellerVolBias(lookBack) =>
    j = 0
    for i = 1 to lookBack
        if sellVolume[i] > buyVolume[i]
            j += 1
    j

getVolBias(lookBack) =>
    float b = 0.0
    float s = 0.0
    for i = 1 to lookBack
        b += buyVolume[i]
        s += sellVolume[i]
    b > s

getSignalBuyerBias(lookBack) =>
    j = 0
    for i = 1 to lookBack
        if signal[i] > signalBiasValue
            j += 1
    j

getSignalSellerBias(lookBack) =>
    j = 0
    for i = 1 to lookBack
        if signal[i] < ( 0.0 - signalBiasValue )
            j += 1
    j

getSignalNoBias(lookBack) =>
    j = 0
    for i = 1 to lookBack
        if signal[i] < signalBiasValue and signal[i] > ( 0.0 - signalBiasValue )
            j += 1
    j

getPriceRising(lookBack) =>
    j = 0
    for i = 1 to lookBack
        if close[i] > close[i + 1]
            j += 1
    j


getPriceFalling(lookBack) =>
    j = 0
    for i = 1 to lookBack
        if close[i] < close[i + 1]
            j += 1
    j

getRangeNarrowing(lookBack) =>
    j = 0
    for i = 1 to lookBack
        if intrabarRange[i] < intrabarRange[i + 1]
            j+= 1
    j

getRangeBroadening(lookBack) =>
    j = 0
    for i = 1 to lookBack
        if intrabarRange[i] > intrabarRange[i + 1]
            j+= 1
    j

bool isNegativeSignalReversal = signalSlope < 0.0 and signalSlope[1] > 0.0
bool isNegativeMacdReversal = macdSlope < 0.0 and macdSlope[1] > 0.0

bool isPositiveSignalReversal = signalSlope > 0.0 and signalSlope[1] < 0.0
bool isPositiveMacdReversal = macdSlope > 0.0 and macdSlope[1] < 0.0

bool hasBearInversion = signalSlope > 0.0 and macdSlope < 0.0
bool hasBullInversion = signalSlope < 0.0 and macdSlope > 0.0

bool hasSignalBias = math.abs(signal) >= signalBiasValue
bool hasNoSignalBias = signal < signalBiasValue and signal > ( 0.0 - signalBiasValue )

bool hasSignalBuyerBias = hasSignalBias and signal > 0.0
bool hasSignalSellerBias = hasSignalBias and signal < 0.0

bool hasPositiveMACDBias = macd > macdBiasValue
bool hasNegativeMACDBias = macd < ( 0.0 - macdBiasValue )

bool hasBullAntiPattern = ta.crossunder(macd, signal)
bool hasBearAntiPattern = ta.crossover(macd, signal)

bool hasSignificantBuyerVolBias = buyVolume > ( sellVolume * 1.5 )
bool hasSignificantSellerVolBias = sellVolume > ( buyVolume * 1.5 )

// 393.60 Profit 52.26% 15m
if ( hasBullInversion and rsiSlope > 1.5 and volume > 300000.0 )
    strategy.entry("15C1", strategy.long, qty=10.0)
strategy.exit("TPS", "15C1", limit=strategy.position_avg_price + takeProfit, stop=strategy.position_avg_price - stopLoss)

// 356.10 Profit 51,45% 15m
if ( getVolBias(shortLookBack) == false and rsiSlope > 3.0 and signalSlope > 0)
    strategy.entry("15C2", strategy.long, qty=10.0)
strategy.exit("TPS", "15C2", limit=strategy.position_avg_price + takeProfit, stop=strategy.position_avg_price - stopLoss)

// 124 Profit 52% 15m
if ( rsiSlope < -11.25 and macdSlope < 0.0 and signalSlope < 0.0)
    strategy.entry("15P1", strategy.short, qty=10.0)
strategy.exit("TPS", "15P1", limit=strategy.position_avg_price - takeProfit, stop=strategy.position_avg_price + stopLoss)

// 455.40 Profit 49% 15m
if ( math.abs(math.abs(macd) - math.abs(signal)) < .1 and buyVolume > sellVolume and hasBullInversion)
    strategy.entry("15P2", strategy.short, qty=10.0)
strategy.exit("TPS", "15P2", limit=strategy.position_avg_price - takeProfit, stop=strategy.position_avg_price + stopLoss)Published by ChaoZhang on the FMZ strategy square · last modified 2024-02-18. Collected in the Quant Trading Vault. Unvalidated research: re-test with your own data and costs before trusting it.
Build this with AgenKit
A spec is not a trading system. Paste this into your coding agent and AgenKit runs a specialist team — architecture, test-first build, risk gates, review — with paper trading on by default.
/agenkit build a production-grade trading bot with a backtest engine, risk controls and paper trading by default from strategies/scillator-Profile-Reversal-Strategy-Based-on-Multi-Timeframe-MACD-Zero-crossing.md- npx agenkit install engineering-kit in your project
- Paste the command into your agent and approve each phase
- Get tests, backtest, risk controls and a paper-trading switch
Understand it first
Before you run this, read the lesson behind the idea and how to backtest it honestly. Specs like this one are the survivors of an unknown number of trials; deflate their results accordingly.
Related specs
- Trend Reversal Momentum Indicators Crossover Tracking StrategyPine Script · Mean reversion · 1h
- Multi Timeframe Gold Reversal Tracking StrategyPine Script · Mean reversion · 2h
- MACD RSI and EMA StrategyPine Script · Mean reversion · 1d
- RSI Indicator Long Short Separation Trading StrategyPine Script · Mean reversion · 3h
- Orion Trading StrategyPine Script · Mean reversion · 3m
- Quant Bitcoin Trading Strategy Combining MACD RSI and FIBPine Script · Mean reversion · 10m