Strategy vault / Mean reversion
Short term Trading Strategy Based on EMA
This strategy is designed with the crossover principles of EMA lines to make appropriate short-term trades and gain decent profits when prices fall back to some extent.
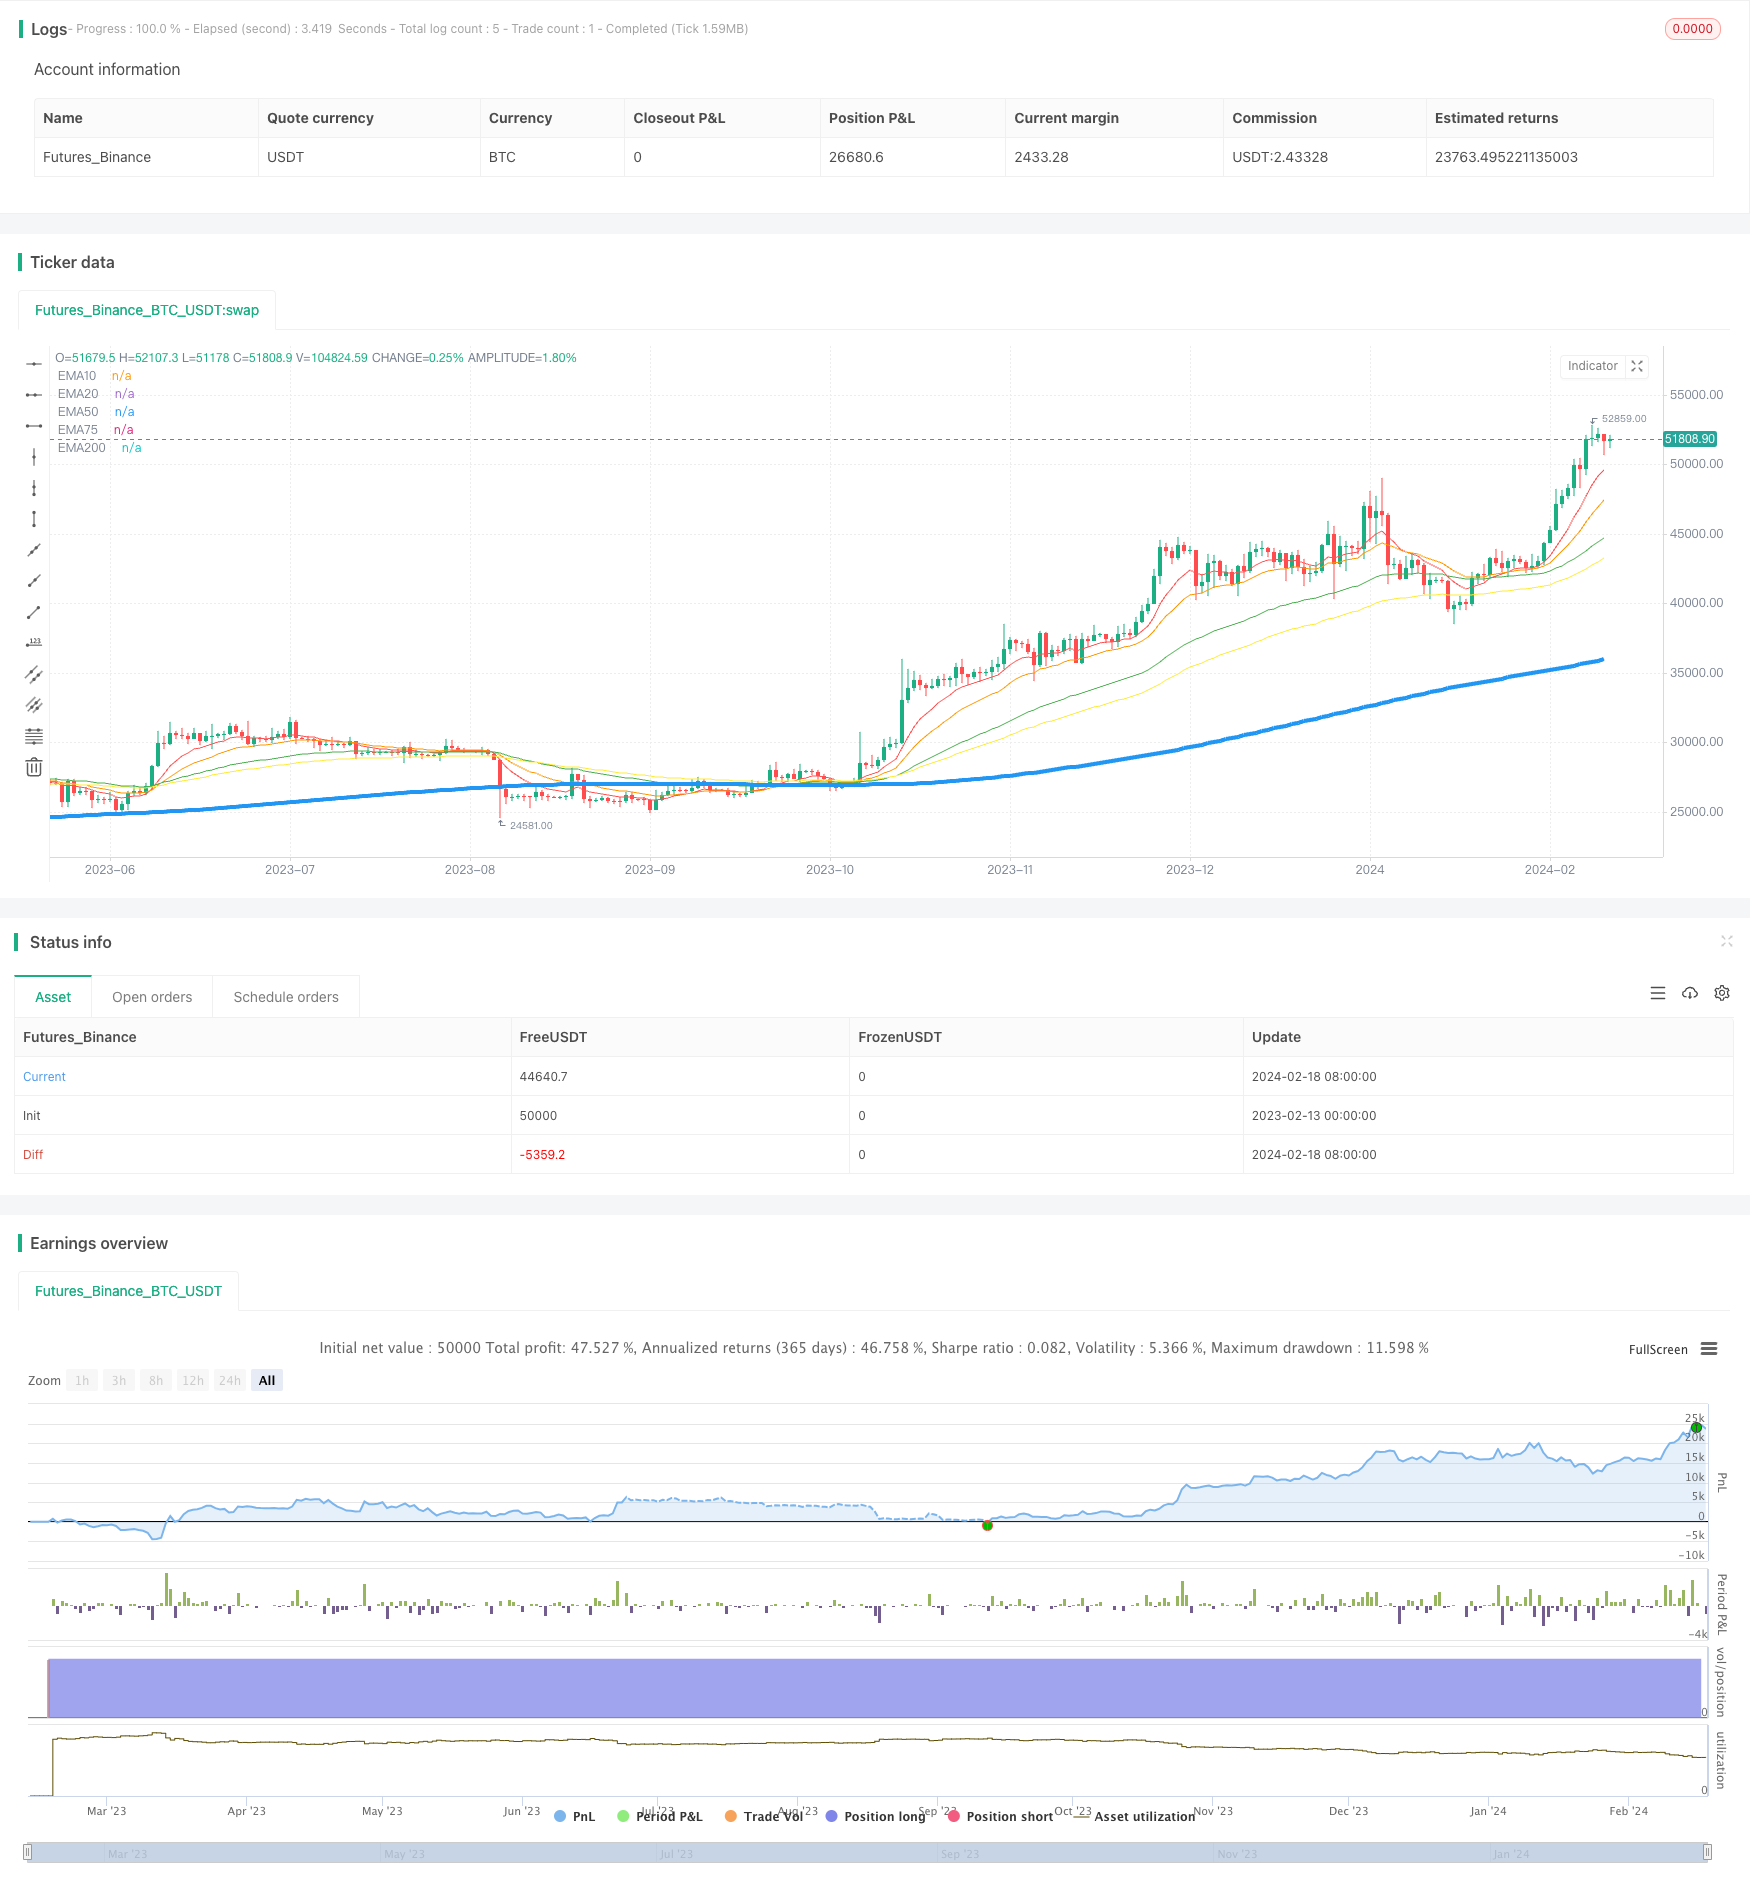
Overview
This strategy is designed with the crossover principles of EMA lines to make appropriate short-term trades and gain decent profits when prices fall back to some extent.
Strategy Logic
The strategy adopts 5 EMA lines with different parameters, specifically the 10-day, 20-day, 50-day, 75-day and 200-day lines. The logic for generating trading signals is:
When the price crosses above the 75-day line and falls below the 50-day line, it is considered a signal for a proper short-term pullback to take a short position.
After going short, if the 10-day line crosses below the 20-day line, continue holding the short position. When the 10-day line crosses back above the 20-day line, close the position to complete this round of short-term trade.
Through this logic design, major fluctuations of prices in the short run can be caught to gain from price spreads during pullbacks.
Advantages
The biggest advantage of this strategy lies in its simple and clear signals that are easy to implement. Just by the crossover situation of several moving averages, trading decisions can be made smoothly, without complex models and loads of historical data, lowering the difficulty of implementation.
In addition, the combo use of multiple EMA lines helps filter out market noise effectively and spot the timing of mid-to-short term trend reversals precisely to make sensible trading decisions.
Risks
The major risk of this strategy comes from violent price swings in the short term. Uncontrolled sharp rises or falls may result in stop loss or take profit lines being broken, causing huge losses. Also, improper parameters may lead to overfrequent trading signals that undermine strategy profitability.
To control risks, parameters of moving averages should be adjusted appropriately to maintain signal frequency at a proper level. Reasonable stop loss and take profit ranges should also be set to avoid oversized losses per trade. Manual intervention is needed as well facing special market conditions, suspending strategy trading.
Optimization
The main optimization space lies in parameter tuning. More combinations can be tested to find the optimal parameter portfolio. For instance, more moving averages can be introduced like 60-day and 120-day lines to form a richer signal source.
Optimization can also be done around aspects like stop loss and take profit. Properly loosening the stop loss range may decrease the probability of wrong stops. Tightening take profit range could increase profitability. These parameter adjustments need to be based on backtest results for optima.
Conclusion
To conclude, this strategy is fairly simple overall. Designed with basic EMA crossover signals, it shapes into a feasible short-term trading tactic. Its advantage lies in clear signals that are easy to carry out, which can effectively seize trading opportunities from mid-to-short term trend reversals. Further improvements can be achieved through parameter tuning and optimizing stop loss, take profit settings.
Source Pine Script
/*backtest
start: 2023-02-13 00:00:00
end: 2024-02-19 00:00:00
period: 1d
basePeriod: 1h
exchanges: [{"eid":"Futures_Binance","currency":"BTC_USDT"}]
*/

// © theswissguy

//@version=5
strategy("Jan 2024 Daily (Short)", initial_capital = 10000, overlay=true, commission_value = 1)

// use closing prices as data source throughout calcs.
ema_source = close
price = close

// set up the EMA curves.
ema10 = ta.ema(ema_source, 10)
ema20 = ta.ema(ema_source, 20)
ema50 = ta.ema(ema_source, 50)
ema75 = ta.ema(ema_source, 75)
ema200 = ta.ema(ta.ema(ema_source, 200), 35)

plot(ema10, color=color.red, title="EMA10")
plot(ema20, color=color.orange, title="EMA20")
plot(ema50, color=color.green, title="EMA50")
plot(ema75, color=color.yellow, title="EMA75")
plot(ema200, color=color.blue, title="EMA200", linewidth = 4)

// if EMA50 <= price <= EMA75 AND EMA10 < EMA20 - sell
dailySellIndicator = ta.crossover(price, ema75) and ta.crossunder(price, ema50) and ta.crossunder(ema10, ema20)
dailyBuyIndicator = ta.crossover(ema10, ema20)

if(dailySellIndicator)
    strategy.entry("daily", strategy.short)
else if(dailyBuyIndicator)
    strategy.entry("daily", strategy.long)
Published by ChaoZhang on the FMZ strategy square · last modified 2024-02-20. Collected in the Quant Trading Vault. Unvalidated research: re-test with your own data and costs before trusting it.
Build this with AgenKit
A spec is not a trading system. Paste this into your coding agent and AgenKit runs a specialist team — architecture, test-first build, risk gates, review — with paper trading on by default.
/agenkit build a production-grade trading bot with a backtest engine, risk controls and paper trading by default from strategies/Short-term-Trading-Strategy-Based-on-EMA.md- npx agenkit install engineering-kit in your project
- Paste the command into your agent and approve each phase
- Get tests, backtest, risk controls and a paper-trading switch
Understand it first
Before you run this, read the lesson behind the idea and how to backtest it honestly. Specs like this one are the survivors of an unknown number of trials; deflate their results accordingly.
Related specs
- 1 2 3 Pattern Quantitative Trading Strategy with EMAs MACD and 4th Candle ExtensionPine Script · Mean reversion · 1h
- ATR and EMA based Dynamic Take Profit and Stop Loss Adaptive StrategyPine Script · Mean reversion · 1h
- Advanced 15 Minute Chart Trading Signal StrategyPine Script · Mean reversion · 3h
- Advanced Momentum EMA Trend Following with RSI Overbought Oversold Trading StrategyPine Script · Mean reversion · 1d
- Advanced Quantitative Trading Strategy Combining RSI Divergence and Moving AveragesPine Script · Mean reversion · 1h
- Advanced Quantitative Trend Following and Cloud Reversal Composite Trading StrategyPine Script · Mean reversion · 1d