Short Term Trading Strategy Based on RSI and SMA
This strategy is named "Short-Term RSI and SMA Percentage Change". It utilizes common technical indicators like RSI and moving average to determine entry and exit of trades. RSI is a momentum oscillator that has a…
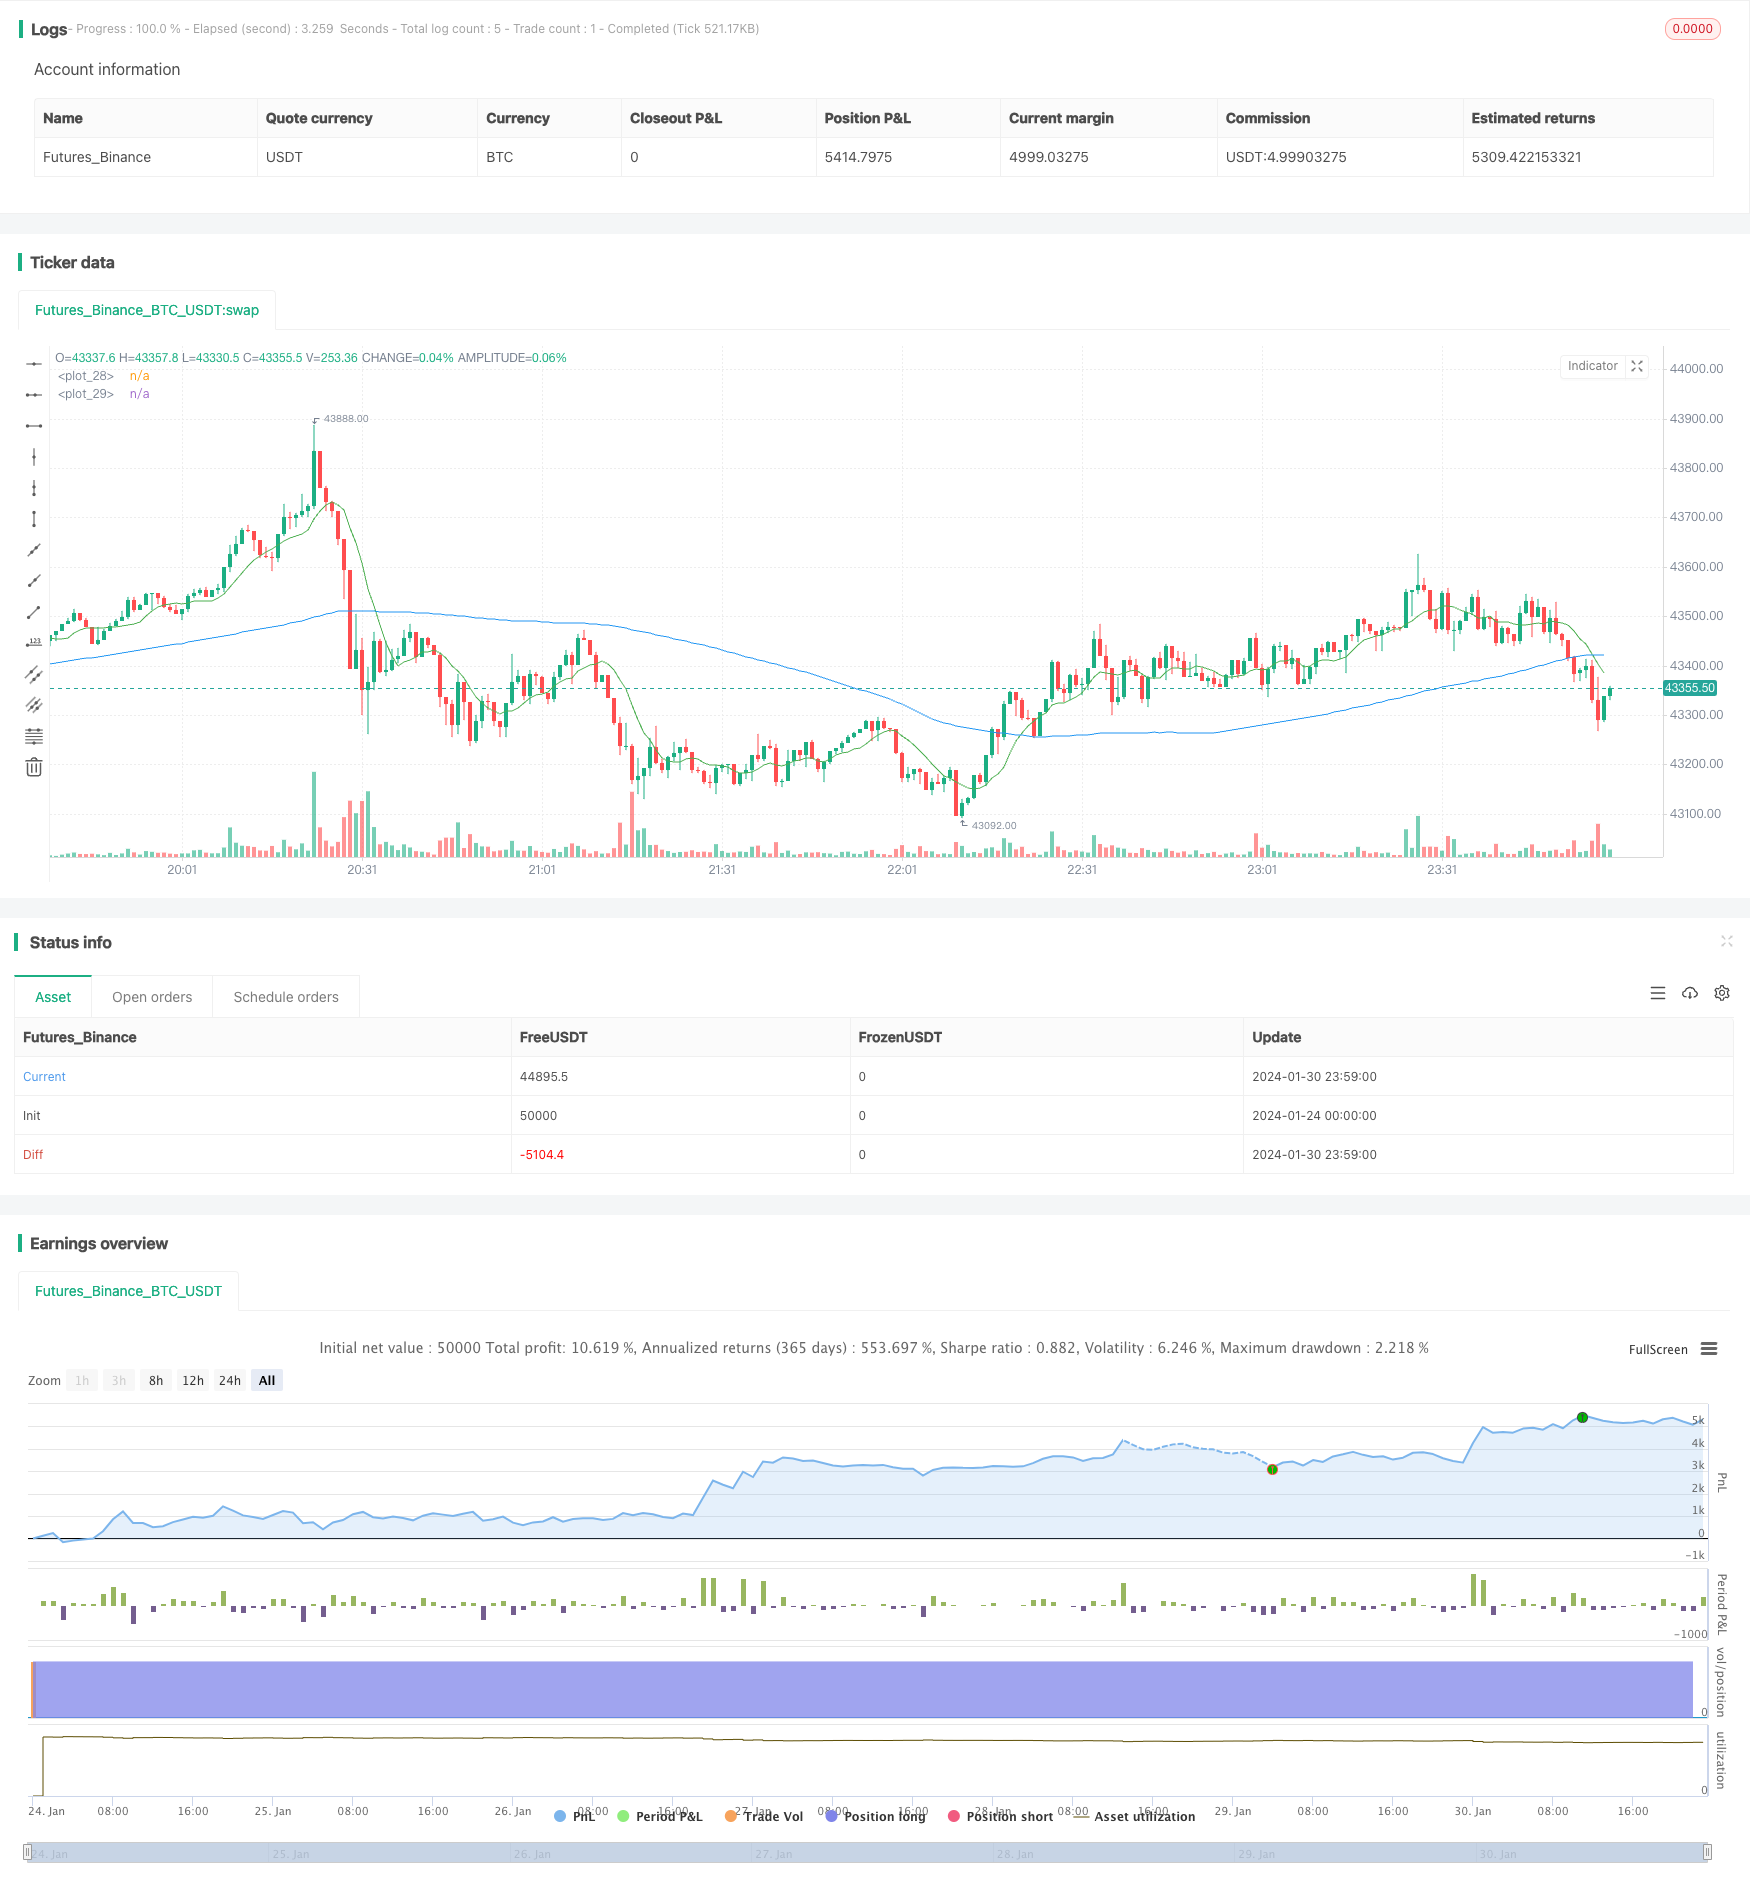
Overview
This strategy is named "Short-Term RSI and SMA Percentage Change". It utilizes common technical indicators like RSI and moving average to determine entry and exit of trades. RSI is a momentum oscillator that has a value between 0 and 100, where a value above 70 is considered overbought and below 30 oversold. SMA is a simple moving average that can reflect short-term and long-term price trends. This strategy builds entry and exit signals based on these two indicators, and backtest shows it can achieve good performance.
Strategy Logic
When RSI is above 50, it is considered a bullish signal. This indicates the market is in equilibrium to bullish zone. When 9-day SMA is above 100-day SMA, it means the short-term trend is better than the long-term trend, and we can enter a long position. In addition, if the short-term 9-day SMA has a relative change of more than 6% to price, it indicates acceleration of short-term trend, which is also an entry signal.
If already in a long position, this strategy will use parabolic SAR trailing stop to lock in profits. It will exit positions when price pulls back according to the percentage of trailing stop loss set.
Advantage Analysis
This strategy combines trend indicators and oscillators, so that it can enter the market when a clear trend appears, while avoiding periods when the market is reversing, greatly reducing trading risk. The stop loss strategy can also lock in profits and prevent profits from evaporating completely when trend reverses.
Backtest shows this strategy can profit in fairly obvious short-term trends with good results. It suits investors who pursue high frequency trading.
Risk Analysis
This strategy relies on indicators like RSI and SMA, which have certain laggingness. When sudden events cause rapid market reversal, this strategy may fail to exit in time, leading to large losses.
In addition, high frequency trading bears higher trading costs. If trading frequency is too high, accumulated trading fees can also impact profits.
Optimization Directions
This strategy can consider incorporating more indicators to determine entry and exit signals, such as adding volume indicators to avoid false breakouts. Stop loss strategy can also be adjusted to more flexible ways, taking into account market fluctuations.
In addition, optimization can be done on trading products, cycle parameters to find the best parameter combination. Cross-cycle trading can also be considered, using higher cycles to determine trend direction, and lower cycles to decide entry.
Conclusion
This strategy "Short-term RSI and SMA Percentage Change" comprehensively employs common technical indicators like RSI and SMA to construct short-term trading strategy. It can seize fairly obvious short-term trends to profit, while also having stops to lock in profits. This strategy suits investors who like high frequency trading, but the risk of rapid market reversal also needs attention. With further optimization, this strategy can achieve better results.
Parameters
| Name | Default | What it controls |
|---|---|---|
| v_input_1 | true | Show Date Range |
| v_input_2 | 14 | length |
| v_input_float_1 | 5 | Trail Long Loss (%) |
| v_input_float_2 | 5 | Trail Short Loss (%) |
Source Pine Script
/*backtest
start: 2024-01-24 00:00:00
end: 2024-01-31 00:00:00
period: 1m
basePeriod: 1m
exchanges: [{"eid":"Futures_Binance","currency":"BTC_USDT"}]
*/

// This source code is subject to the terms of the Mozilla Public License 2.0 at https://mozilla.org/MPL/2.0/
// © Coinrule

//@version=5
strategy("Short Term RSI and SMA Percentage Change",
         overlay=true,
         initial_capital=1000,
         process_orders_on_close=true,
         default_qty_type=strategy.percent_of_equity,
         default_qty_value=100,
         commission_type=strategy.commission.percent,
         commission_value=0.1)

showDate = input(defval=true, title='Show Date Range')
timePeriod = time >= timestamp(syminfo.timezone, 2022, 5, 1, 0, 0)
notInTrade = strategy.position_size <= 0

//==================================Buy Conditions============================================

//RSI
length = input(14)
rsi = ta.rsi(close, length)
buyCondition1 = rsi > 50

//MA
SMA9 = ta.sma(close, 9)
SMA100 = ta.sma(close, 100)
plot(SMA9, color = color.green)
plot(SMA100, color = color.blue)
buyCondition2 = (SMA9 > SMA100)

//Calculating MA Percentage Change
buyMA = (close/SMA9)
buyCondition3 = buyMA >= 0.06

if (buyCondition1 and buyCondition2 and buyCondition3 and timePeriod) //and buyCondition
    strategy.entry("Long", strategy.long)

//==================================Sell Conditions============================================

// Configure trail stop level with input options
longTrailPerc = input.float(title='Trail Long Loss (%)', minval=0.0, step=0.1, defval=5) * 0.01
shortTrailPerc = input.float(title='Trail Short Loss (%)', minval=0.0, step=0.1, defval=5) * 0.01

// Determine trail stop loss prices
longStopPrice = 0.0
shortStopPrice = 0.0

longStopPrice := if strategy.position_size > 0
    stopValue = close * (1 - longTrailPerc)
    math.max(stopValue, longStopPrice[1])
else
    0

shortStopPrice := if strategy.position_size < 0
    stopValue = close * (1 + shortTrailPerc)
    math.min(stopValue, shortStopPrice[1])
else
    999999

strategy.exit('Exit', stop = longStopPrice, limit = shortStopPrice)
Published by ChaoZhang on the FMZ strategy square · last modified 2024-02-01. Collected in the Quant Trading Vault. Unvalidated research: re-test with your own data and costs before trusting it.
Build this with AgenKit
A spec is not a trading system. Paste this into your coding agent and AgenKit runs a specialist team — architecture, test-first build, risk gates, review — with paper trading on by default.
/agenkit build a production-grade trading bot with a backtest engine, risk controls and paper trading by default from strategies/Short-Term-Trading-Strategy-Based-on-RSI-and-SMA.md- npx agenkit install engineering-kit in your project
- Paste the command into your agent and approve each phase
- Get tests, backtest, risk controls and a paper-trading switch
Understand it first
Before you run this, read the lesson behind the idea and how to backtest it honestly. Specs like this one are the survivors of an unknown number of trials; deflate their results accordingly.
Related specs
- Momentum Strategy Based on Double Bottom Breakout ModelPine Script · Breakout · 1m
- Quantitative Trading Strategy Based on Ichimoku with Multiple SignalsPine Script · Breakout · 1h
- Dual R Indicators StrategyPine Script · Breakout · 1h
- MACD Bollinger Turtle Trading StrategyPine Script · Breakout · 1d
- Multifactor Dynamic Money Management StrategyPine Script · Breakout · 10m
- Parabolic Stop and Reserve Multi Indicator Trading StrategyPine Script · Breakout · 45m