Strategy vault / Trend following
Short term Trend Tracking Strategy Based on Gann Me Analysis Indicator
This strategy constructs multiple EMA indicators with different cycles and calculates their difference to form the Gann Me indicator for judging price trends and generating trading signals. It is suitable for…
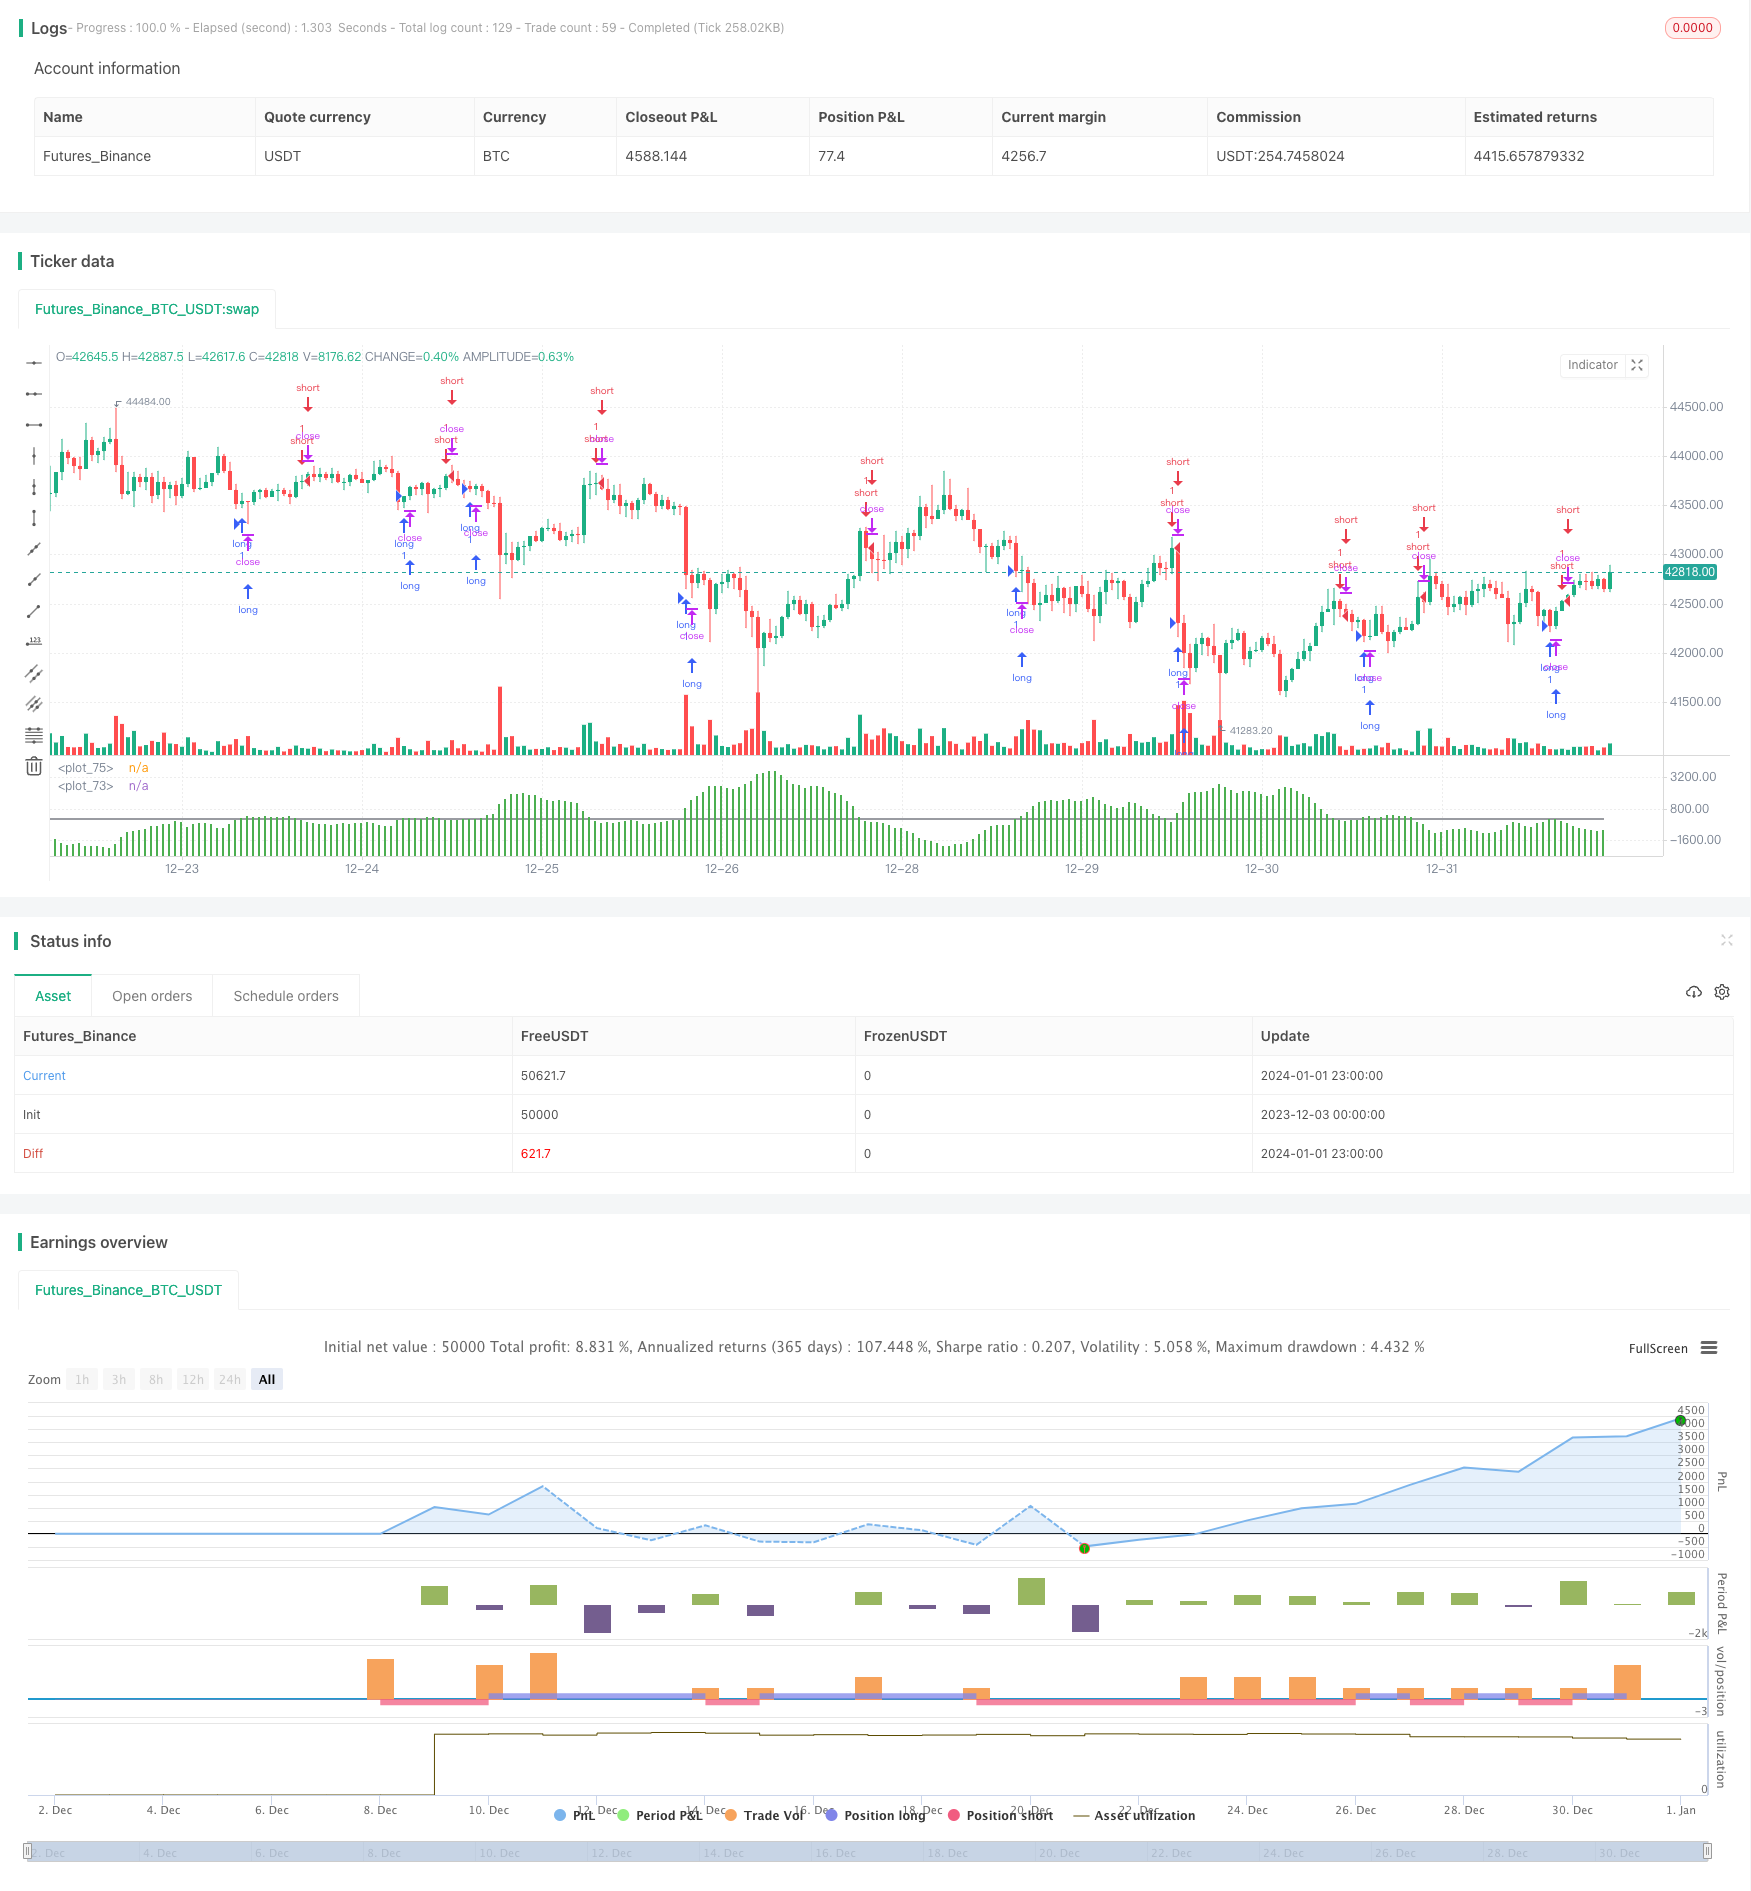
Overview
This strategy constructs multiple EMA indicators with different cycles and calculates their difference to form the Gann Me indicator for judging price trends and generating trading signals. It is suitable for short-term trend tracking and can effectively capture price change trends.
Principles
The strategy first constructs 6 short-cycle EMA indicators and 6 long-cycle EMA indicators. The short-cycle EMA includes 3-day, 5-day, 8-day, 10-day, 12-day and 15-day lines. The long-cycle EMA includes 30-day, 35-day, 40-day, 45-day, 50-day and 60-day lines.
Then calculate the sum of short-cycle EMAs (g) and the sum of long-cycle EMAs (mae). The difference between long and short cycle EMAs (gmae = mae - g) forms the Gann Me difference indicator. This difference indicator can judge price trends.
When the difference crosses above the 0 axis, it means that the short-term moving average rises faster than the long-term one, which is a bullish signal to go long. When the difference crosses below the 0 axis, it means that the short-term moving average falls faster than the long-term one, which is a bearish signal to go short.
Advantages
- Using dual EMA lines strategy can effectively track short-term trends
- Building multiple EMAs avoids false breakthroughs and improves signal accuracy
- Difference indicator intuitively judges long and short term trends
- Simple parameter settings, easy for live trading
Risks
- Short-term operations have certain stop-loss risks
- Multi-EMA parameter settings need testing and optimization
- Only suitable for short-term operations, not suitable for long-term holds
Optimization
- Test and optimize EMA parameters to improve trading efficiency
- Increase stop loss strategy to control single loss
- Combine with other indicators to filter entry signals
- Optimize capital management, adjust position management
Summary
This strategy captures short-term price trend changes by constructing the Gann Me difference indicator. It belongs to a short-term tracking strategy. The advantages are sensitive reaction and suitability for high-frequency trading. The disadvantages are sensitivity to market variables and higher stop loss risks. Overall, the strategy performs well and is worth testing and applying in real trading.
Parameters
| Name | Default | What it controls |
|---|---|---|
| v_input_1 | 3 | Length |
| v_input_2_close | 0 | Source: close | high | low | open | hl2 | hlc3 | hlcc4 | ohlc4 |
| v_input_3 | 5 | Length |
| v_input_4_close | 0 | Source: close | high | low | open | hl2 | hlc3 | hlcc4 | ohlc4 |
| v_input_5 | 8 | Length |
| v_input_6_close | 0 | Source: close | high | low | open | hl2 | hlc3 | hlcc4 | ohlc4 |
| v_input_7 | 10 | Length |
| v_input_8_close | 0 | Source: close | high | low | open | hl2 | hlc3 | hlcc4 | ohlc4 |
| v_input_9 | 12 | Length |
| v_input_10_close | 0 | Source: close | high | low | open | hl2 | hlc3 | hlcc4 | ohlc4 |
| v_input_11 | 15 | Length |
| v_input_12_close | 0 | Source: close | high | low | open | hl2 | hlc3 | hlcc4 | ohlc4 |
| v_input_13 | 30 | Length |
| v_input_14_close | 0 | Source: close | high | low | open | hl2 | hlc3 | hlcc4 | ohlc4 |
| v_input_15 | 35 | Length |
| v_input_16_close | 0 | Source: close | high | low | open | hl2 | hlc3 | hlcc4 | ohlc4 |
| v_input_17 | 40 | Length |
| v_input_18_close | 0 | Source: close | high | low | open | hl2 | hlc3 | hlcc4 | ohlc4 |
| v_input_19 | 45 | Length |
| v_input_20_close | 0 | Source: close | high | low | open | hl2 | hlc3 | hlcc4 | ohlc4 |
| v_input_21 | 50 | Length |
| v_input_22_close | 0 | Source: close | high | low | open | hl2 | hlc3 | hlcc4 | ohlc4 |
| v_input_23 | 60 | Length |
| v_input_24_close | 0 | Source: close | high | low | open | hl2 | hlc3 | hlcc4 | ohlc4 |
Source Pine Script
/*backtest
start: 2023-12-03 00:00:00
end: 2024-01-02 00:00:00
period: 1h
basePeriod: 15m
exchanges: [{"eid":"Futures_Binance","currency":"BTC_USDT"}]
*/

//@version=2
strategy(title="GMAE Original (By Kevin Manrrique)", overlay=false)
/// This indicator was built and scripted by Kevin Manrrique. Please leave this copyright to the script at all times, if rebuilt please add your name onto the script.
/// If you have any questions, please message me directly. Thank you.
/// Sincerely,
///
/// Kevin Manrrique

            ///ONE///
len = input(3, minval=1, title="Length")
src = input(close, title="Source")
out = ema(src, len)
//plot(out, title="EMA", color=blue)

len2 = input(5, minval=1, title="Length")
src2 = input(close, title="Source")
out2 = ema(src2, len2)
//plot(out2, title="EMA", color=blue)

len3 = input(8, minval=1, title="Length")
src3 = input(close, title="Source")
out3 = ema(src3, len3)
//plot(out3, title="EMA", color=blue)

len4 = input(10, minval=1, title="Length")
src4 = input(close, title="Source")
out4 = ema(src4, len4)
//plot(out4, title="EMA", color=blue)

len5 = input(12, minval=1, title="Length")
src5 = input(close, title="Source")
out5 = ema(src5, len5)
//plot(out5, title="EMA", color=blue)

len6 = input(15, minval=1, title="Length")
src6 = input(close, title="Source")
out6 = ema(src6, len6)
//plot(out6, title="EMA", color=blue)
        ///TWO///
len7 = input(30, minval=1, title="Length")
src7 = input(close, title="Source")
out7 = ema(src7, len7)
//plot(out7, title="EMA", color=red)

len8 = input(35, minval=1, title="Length")
src8 = input(close, title="Source")
out8 = ema(src8, len8)
//plot(out8, title="EMA", color=red)

len9 = input(40, minval=1, title="Length")
src9 = input(close, title="Source")
out9 = ema(src9, len9)
//plot(out9, title="EMA", color=red)

len10 = input(45, minval=1, title="Length")
src10 = input(close, title="Source")
out10 = ema(src10, len10)
//plot(out10, title="EMA", color=red)

len11 = input(50, minval=1, title="Length")
src11 = input(close, title="Source")
out11 = ema(src11, len11)
//plot(out11, title="EMA", color=red)

len12 = input(60, minval=1, title="Length")
src12 = input(close, title="Source")
out12 = ema(src12, len12)
//plot(out12, title="EMA", color=red)

g=out+out2+out3+out4+out5+out6
mae=out7+out8+out9+out10+out11+out12
gmae=mae-g
plot(gmae, style=columns, color=green)
baseline=0
plot(baseline, style=line, color=black)

longCondition = crossover(gmae, baseline)
if (longCondition)
    strategy.entry("long", strategy.long)

shortCondition = crossunder(gmae, baseline)
if (shortCondition)
strategy.entry("short", strategy.short)Published by ChaoZhang on the FMZ strategy square · last modified 2024-01-03. Collected in the Quant Trading Vault. Unvalidated research: re-test with your own data and costs before trusting it.
Build this with AgenKit
A spec is not a trading system. Paste this into your coding agent and AgenKit runs a specialist team — architecture, test-first build, risk gates, review — with paper trading on by default.
/agenkit build a production-grade trading bot with a backtest engine, risk controls and paper trading by default from strategies/Short-term-Trend-Tracking-Strategy-Based-on-Gann-Me-Analysis-Indicator.md- npx agenkit install engineering-kit in your project
- Paste the command into your agent and approve each phase
- Get tests, backtest, risk controls and a paper-trading switch
Understand it first
Before you run this, read the lesson behind the idea and how to backtest it honestly. Specs like this one are the survivors of an unknown number of trials; deflate their results accordingly.
Related specs
- 200 EMA VWAP MFI Trend Following StrategyPine Script · Trend following · 1d
- 4 EMA Trend StrategyPine Script · Trend following · 1d
- ADX MA and EMA Long Only Trend Tracking StrategyPine Script · Trend following · 1d
- ATR Dynamic Trend Following and EMA Crossover Trading StrategyPine Script · Trend following · 1d
- ATR and Moving Average Crossover Hybrid StrategyPine Script · Trend following · 1h
- ATR and T3 Moving Average StrategyPine Script · Trend following · 5m