Strategy vault / Trend following
Simple Moving Average Crossover Strategy
This is a combination trading strategy based on simple moving averages (SMA). It uses a crossover of the 9-day and 21-day SMA lines as buy and sell signals. When the short-term SMA crosses above the long-term SMA…
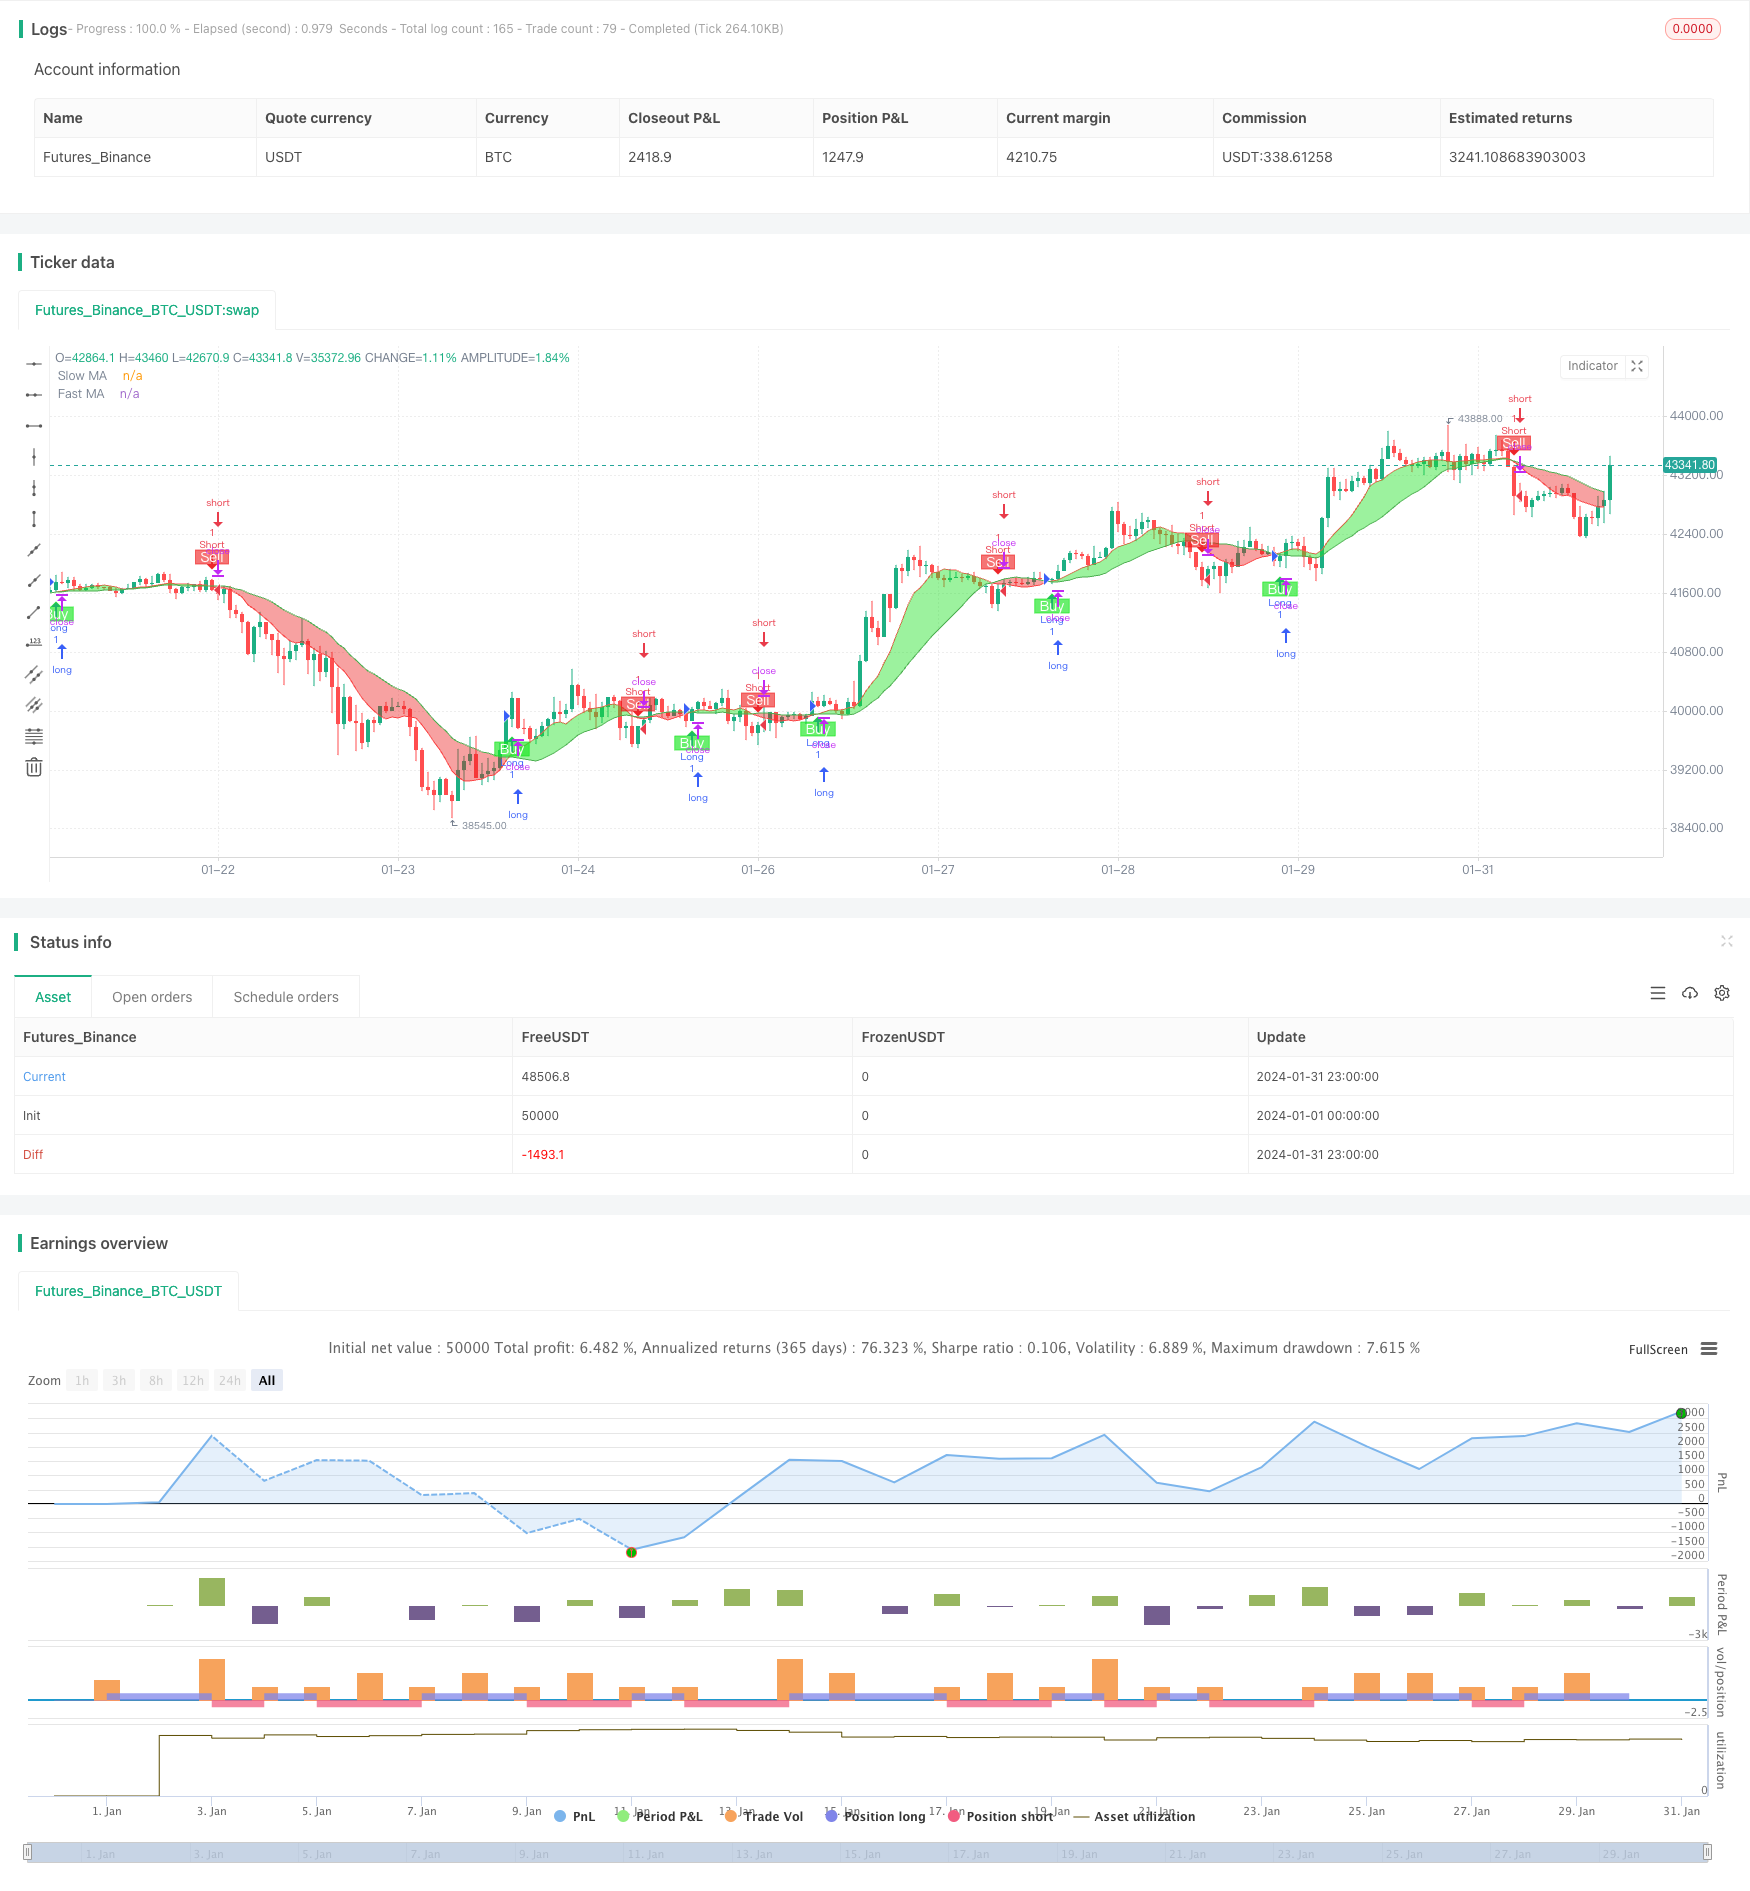
Overview
This is a combination trading strategy based on simple moving averages (SMA). It uses a crossover of the 9-day and 21-day SMA lines as buy and sell signals. When the short-term SMA crosses above the long-term SMA from below, a buy signal is generated. When the short-term SMA crosses below the long-term SMA from above, a sell signal is generated.
Strategy Logic
The core logic of this strategy is to use two SMA lines with different parameters - a 9-day SMA representing the short-term trend and a 21-day SMA representing the long-term trend. When the short-term trend line crosses above the long-term trend line from below, it indicates the market is changing from downtrend to uptrend, generating a buy signal. When the short-term line crosses below the long-term line from above, it signals a change from uptrend to downtrend, generating a sell signal.
The key signals this strategy relies on are the "golden cross" and "death cross" of the two SMA lines. A golden cross occurs when the short SMA crosses above the long SMA, signaling a possible change from downtrend to uptrend. A death cross occurs when the short SMA crosses below the long SMA, suggesting a downturn from uptrend may start. By utilizing these two signals, the strategy identifies relationships between short-term and long-term trends to make trading decisions.
Advantages
- Simple to understand and implement
- Few parameters needing extensive testing/optimization
- Reasonable trading frequency avoiding overly aggressive trades
- Fairly accurate at identifying trend reversal points
- Offers measurability and stability to a certain extent
Risks
- Prone to generating false signals and whipsaws
- Buying/selling point selection relies heavily on experience instead of a systematic approach
- Performance highly parameter dependent. 9-day/21-day SMA may not be optimal
- Ineffective at filtering noise trades in choppy/sideways markets
- Sizable losing trades in high volatility environments
Possible Enhancements:
- Add filters to avoid acting on false signals
- Incorporate other indicators to gauge signal reliability
- Test and optimize parameters for different products
- Implement stop loss/take profit to control risks
Conclusion
Overall this is a fairly traditional and simple dual moving average crossover system. It is easy to understand and implement with relatively simple parameter selection. It can effectively track changes between short-term and long-term trends. However, issues like false signals, empirically chosen parameters, mediocre performance in high volatility environments need to be addressed. Appropriate optimizations, enhancements, and combinations should be considered along with solid risk control practices.
Source Pine Script
/*backtest
start: 2024-01-01 00:00:00
end: 2024-01-31 23:59:59
period: 1h
basePeriod: 15m
exchanges: [{"eid":"Futures_Binance","currency":"BTC_USDT"}]
*/

//@version=5
strategy("Bitboy Strategy", overlay=true)

// Define MAs
SlowMA = ta.sma(close, 9)
FastMA = ta.sma(close, 21)

// Plot MAs
plot1 = plot(SlowMA, color=color.new(color.red, 0), title="Slow MA")
plot2 = plot(FastMA, color=color.new(color.green, 0), title="Fast MA")

// Plot MA Ribbon
fill(plot1, plot2, color=FastMA > SlowMA ? color.rgb(233, 21, 21, 50) : color.new(#1de223, 45))

// Define buy/sell conditions
longCondition = ta.crossover(SlowMA, FastMA)
shortCondition = ta.crossunder(SlowMA, FastMA)

// Strategy commands for buy/sell
if longCondition
    strategy.entry("Long", strategy.long)

if shortCondition
    strategy.entry("Short", strategy.short)

// Plot buy/sell signals (for visualization)
plotshape(longCondition, location=location.belowbar, color=color.rgb(18, 230, 25, 37), style=shape.labelup, text="Buy", textcolor=color.white)
plotshape(shortCondition, location=location.abovebar, color=color.rgb(239, 23, 23, 40), style=shape.labeldown, text="Sell", textcolor=color.white)
Published by ChaoZhang on the FMZ strategy square · last modified 2024-02-21. Collected in the Quant Trading Vault. Unvalidated research: re-test with your own data and costs before trusting it.
Build this with AgenKit
A spec is not a trading system. Paste this into your coding agent and AgenKit runs a specialist team — architecture, test-first build, risk gates, review — with paper trading on by default.
/agenkit build a production-grade trading bot with a backtest engine, risk controls and paper trading by default from strategies/Simple-Moving-Average-Crossover-Strategy.md- npx agenkit install engineering-kit in your project
- Paste the command into your agent and approve each phase
- Get tests, backtest, risk controls and a paper-trading switch
Understand it first
Before you run this, read the lesson behind the idea and how to backtest it honestly. Specs like this one are the survivors of an unknown number of trials; deflate their results accordingly.
Related specs
- ADX MA and EMA Long Only Trend Tracking StrategyPine Script · Trend following · 1d
- ATR and Moving Average Crossover Hybrid StrategyPine Script · Trend following · 1h
- Adaptive FVG Detection and MA Trend Trading Strategy with Dynamic ResistancePine Script · Trend following · 1d
- Adaptive Risk Management Strategy Based on Dynamic ATR and Moving Average CrossoverPine Script · Trend following · 2h
- Adaptive Trading Strategy Based on Stochastic RSI Dual Line CrossoverPine Script · Trend following · 4h
- Adaptive Volatility Based Trend Following Short Strategy with Time Delay and Stop Loss ProtectionPine Script · Trend following · 2m