Strategy vault / Mean reversion
Slow RSI OB OS Strategy
The Slow RSI OB/OS strategy opens up new trading opportunities by extending the lookback period of RSI to reduce the fluctuation of the RSI curve. The strategy is also applicable to other technical indicators like MACD.
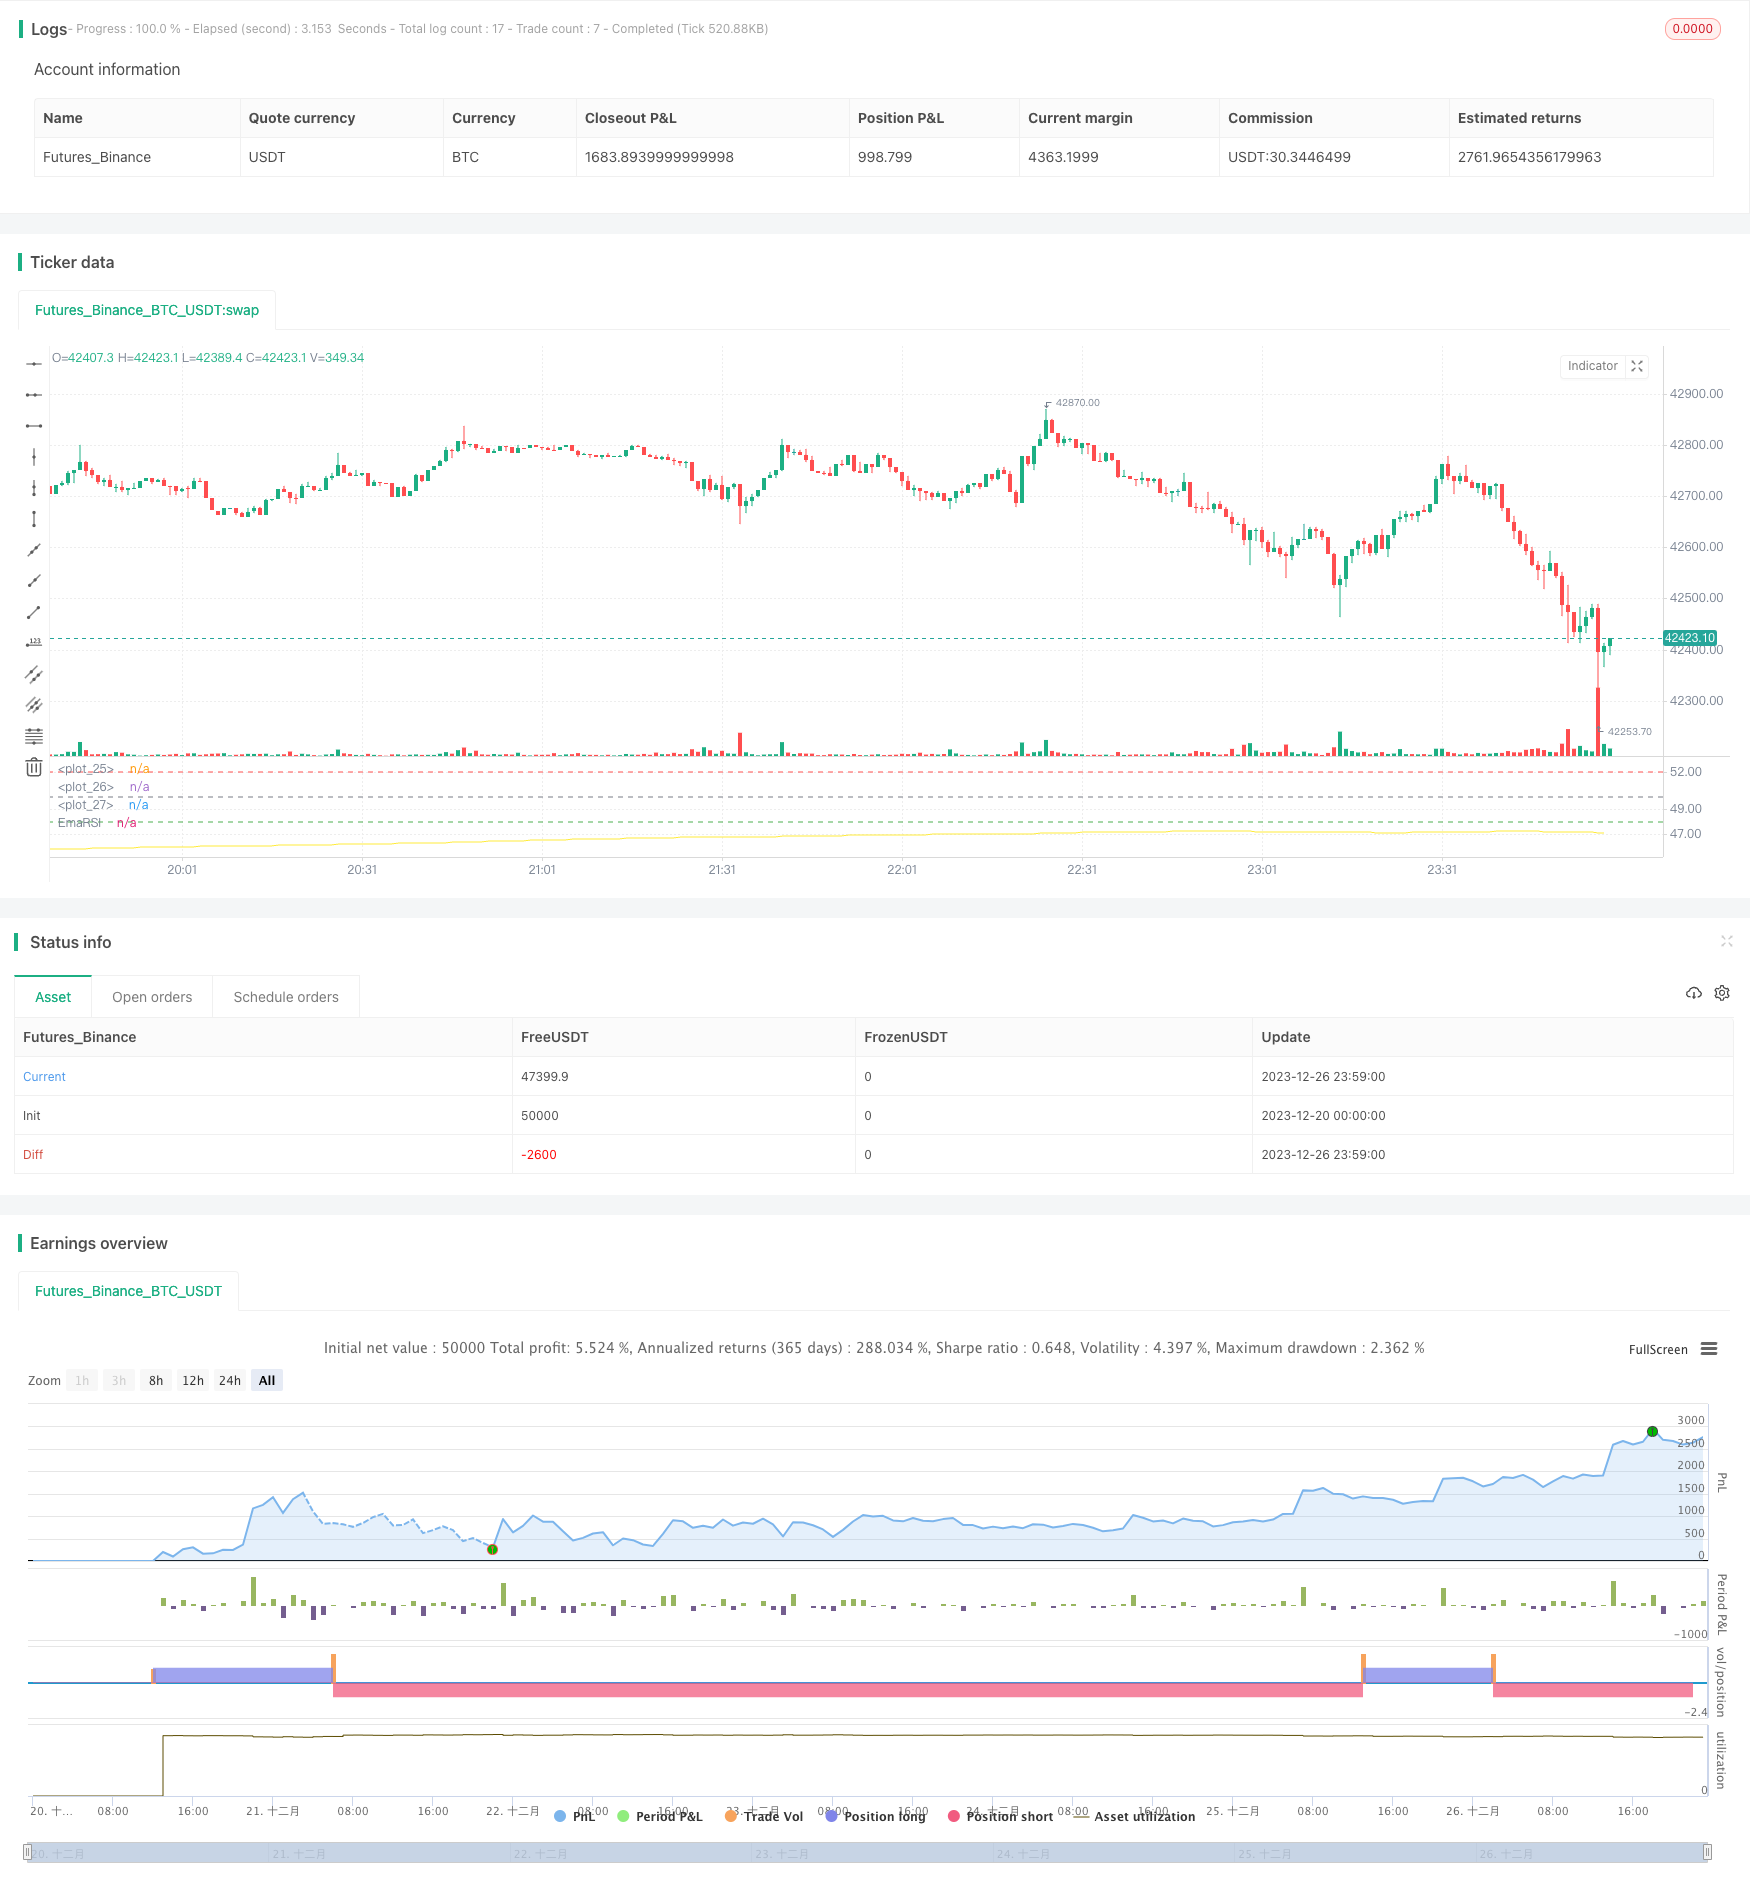
Overview
The Slow RSI OB/OS strategy opens up new trading opportunities by extending the lookback period of RSI to reduce the fluctuation of the RSI curve. The strategy is also applicable to other technical indicators like MACD.
Strategy Logic
The core idea of this strategy is to extend the lookback period of RSI to 500 bars by default and then smooth the RSI curve with a 250-bar SMA. This can significantly reduce the fluctuation of RSI and slow down its reaction speed, thus generating new trading signals.
The prolonged lookback period weakens the fluctuation of RSI, so the criteria for overbought and oversold levels also need to be adjusted. The strategy sets customizable overbought line at 52 and oversold line at 48. A long signal is triggered when the smoothed RSI crosses above the oversold line from below. A short signal is triggered when it crosses below the overbought line from above.
Advantages
- Highly innovative by exploring new trading ideas through extended periods
- Greatly reduce false signals and improve stability
- Customizable OB/OS thresholds adaptive to different markets
- Allow pyramiding to improve profitability
Risks
- Missing short-term opportunities due to lengthy periods
- Requires patience waiting for trading signals
- Improper OB/OS threshold settings may increase losses
- Risks of being trapped
Solutions:
- Shorten the periods properly to increase trading frequency
- Take partial positions to diversify risks
- Optimize parameters to adapt to changing market conditions
- Set stop loss to avoid huge losses
Optimization Directions
- Optimize RSI parameters to find the best period combination
- Test different SMA smoothing periods
- Optimize OB/OS parameters to fit different markets
- Add stop loss strategies to control single loss
Conclusion
The Slow RSI OB/OS strategy successfully explored new trading ideas by extending periods and using SMA to suppress fluctuations. With proper parameter tuning and risk control, the strategy has the potential to achieve steady and profitable excess returns. In conclusion, the strategy is highly innovative and valuable to use.
Parameters
| Name | Default | What it controls |
|---|---|---|
| v_input_1_ohlc4 | 0 | Price Source: ohlc4 | high | low | open | hl2 | hlc3 | hlcc4 | close |
| v_input_2 | 500 | RSI Length |
| v_input_3 | 250 | RSI SMA |
| v_input_4 | 52 | OB |
| v_input_5 | 48 | OS |
Source Pine Script
/*backtest
start: 2023-12-20 00:00:00
end: 2023-12-27 00:00:00
period: 1m
basePeriod: 1m
exchanges: [{"eid":"Futures_Binance","currency":"BTC_USDT"}]
*/


// Wilder was a very influential man when it comes to TA. However, I'm one to always try to think outside the box.
// While Wilder recommended that the RSI be used only with a 14 bar lookback period, I on the other hand think there is a lot to learn from RSI if one simply slows down the lookback period
// Same applies for MACD.
// Every market has its dynmaics. So don't narrow your mind by thinking my source code input levels are the only levels that work.
// Since the long lookback period weakens the plot volatility, again, one must think outside the box when trying to guage overbought and oversold levels.

// Good luck and don't bash me if some off-the-wall FA spurned divergence causes you to lose money.
// And NO this doesn't repaint and I won't answer those who ask.
//@version=4

strategy("SLOW RSI OB/OS Strategy", overlay=false)
price = input(ohlc4, title="Price Source")
len = input(500, minval=1, step=5,  title="RSI Length")
smoother = input(250, minval=1, step=5, title="RSI SMA")
up = rma(max(change(price), 0), len)
down = rma(-min(change(price), 0), len)
rsi = down == 0 ? 100 : up == 0 ? 0 : 100 - (100 / (1 + up / down))
EmaRSI = ema(rsi,smoother)
plot(EmaRSI, title="EmaRSI", style=line, linewidth=1, color=yellow)


OB = input(52, step=0.1)
OS = input(48, step=0.1)
hline(OB, linewidth=1, color=red)
hline(OS,linewidth=1, color=green)
hline(50,linewidth=1, color=gray)


long = change(EmaRSI) > 0 and EmaRSI <= 50 and crossover(EmaRSI, OS)
short = change(EmaRSI) < 0 and EmaRSI >= 50 and crossunder(EmaRSI, OB)


strategy.entry("Long", strategy.long, when=long) //_signal or long) //or closeshort_signal)
strategy.entry("Short", strategy.short, when=short) //_signal or short) // or closelong_signal)

// If you want to try to play with exits you can activate these!

//closelong = crossunder(EmaRSI, 0) //or crossunder(EmaRSI, OS)
//closeshort = crossover(EmaRSI, 0) //or crossover(EmaRSI, OB)

//strategy.close("Long", when=closelong)
//strategy.close("Short", when=closeshort)
Published by ChaoZhang on the FMZ strategy square · last modified 2023-12-28. Collected in the Quant Trading Vault. Unvalidated research: re-test with your own data and costs before trusting it.
Build this with AgenKit
A spec is not a trading system. Paste this into your coding agent and AgenKit runs a specialist team — architecture, test-first build, risk gates, review — with paper trading on by default.
/agenkit build a production-grade trading bot with a backtest engine, risk controls and paper trading by default from strategies/Slow-RSI-OB-OS-Strategy.md- npx agenkit install engineering-kit in your project
- Paste the command into your agent and approve each phase
- Get tests, backtest, risk controls and a paper-trading switch
Understand it first
Before you run this, read the lesson behind the idea and how to backtest it honestly. Specs like this one are the survivors of an unknown number of trials; deflate their results accordingly.
Related specs
- Advanced 15 Minute Chart Trading Signal StrategyPine Script · Mean reversion · 3h
- BONK Multi Factor Trading StrategyPine Script · Mean reversion · 1d
- Customizable Non Repainting HTF MACD MFI Scalable Bot StrategyPine Script · Mean reversion · 1d
- Dynamic Adaptive Multi Timeframe Trend Following and Range Reversal Hybrid StrategyPine Script · Mean reversion · 2d
- MACD Cross Period Trading StrategyPine Script · Mean reversion · 1d
- MACD Long Reversal StrategyPine Script · Mean reversion · 1d