Strategy vault / Trend following
SMA and RSI Long Only Strategy
This strategy is adapted from the articles by Enrico Malverti. It mainly uses Simple Moving Average (SMA) and Relative Strength Index (RSI) to identify long entry and exit signals. The strategy only goes long but not…
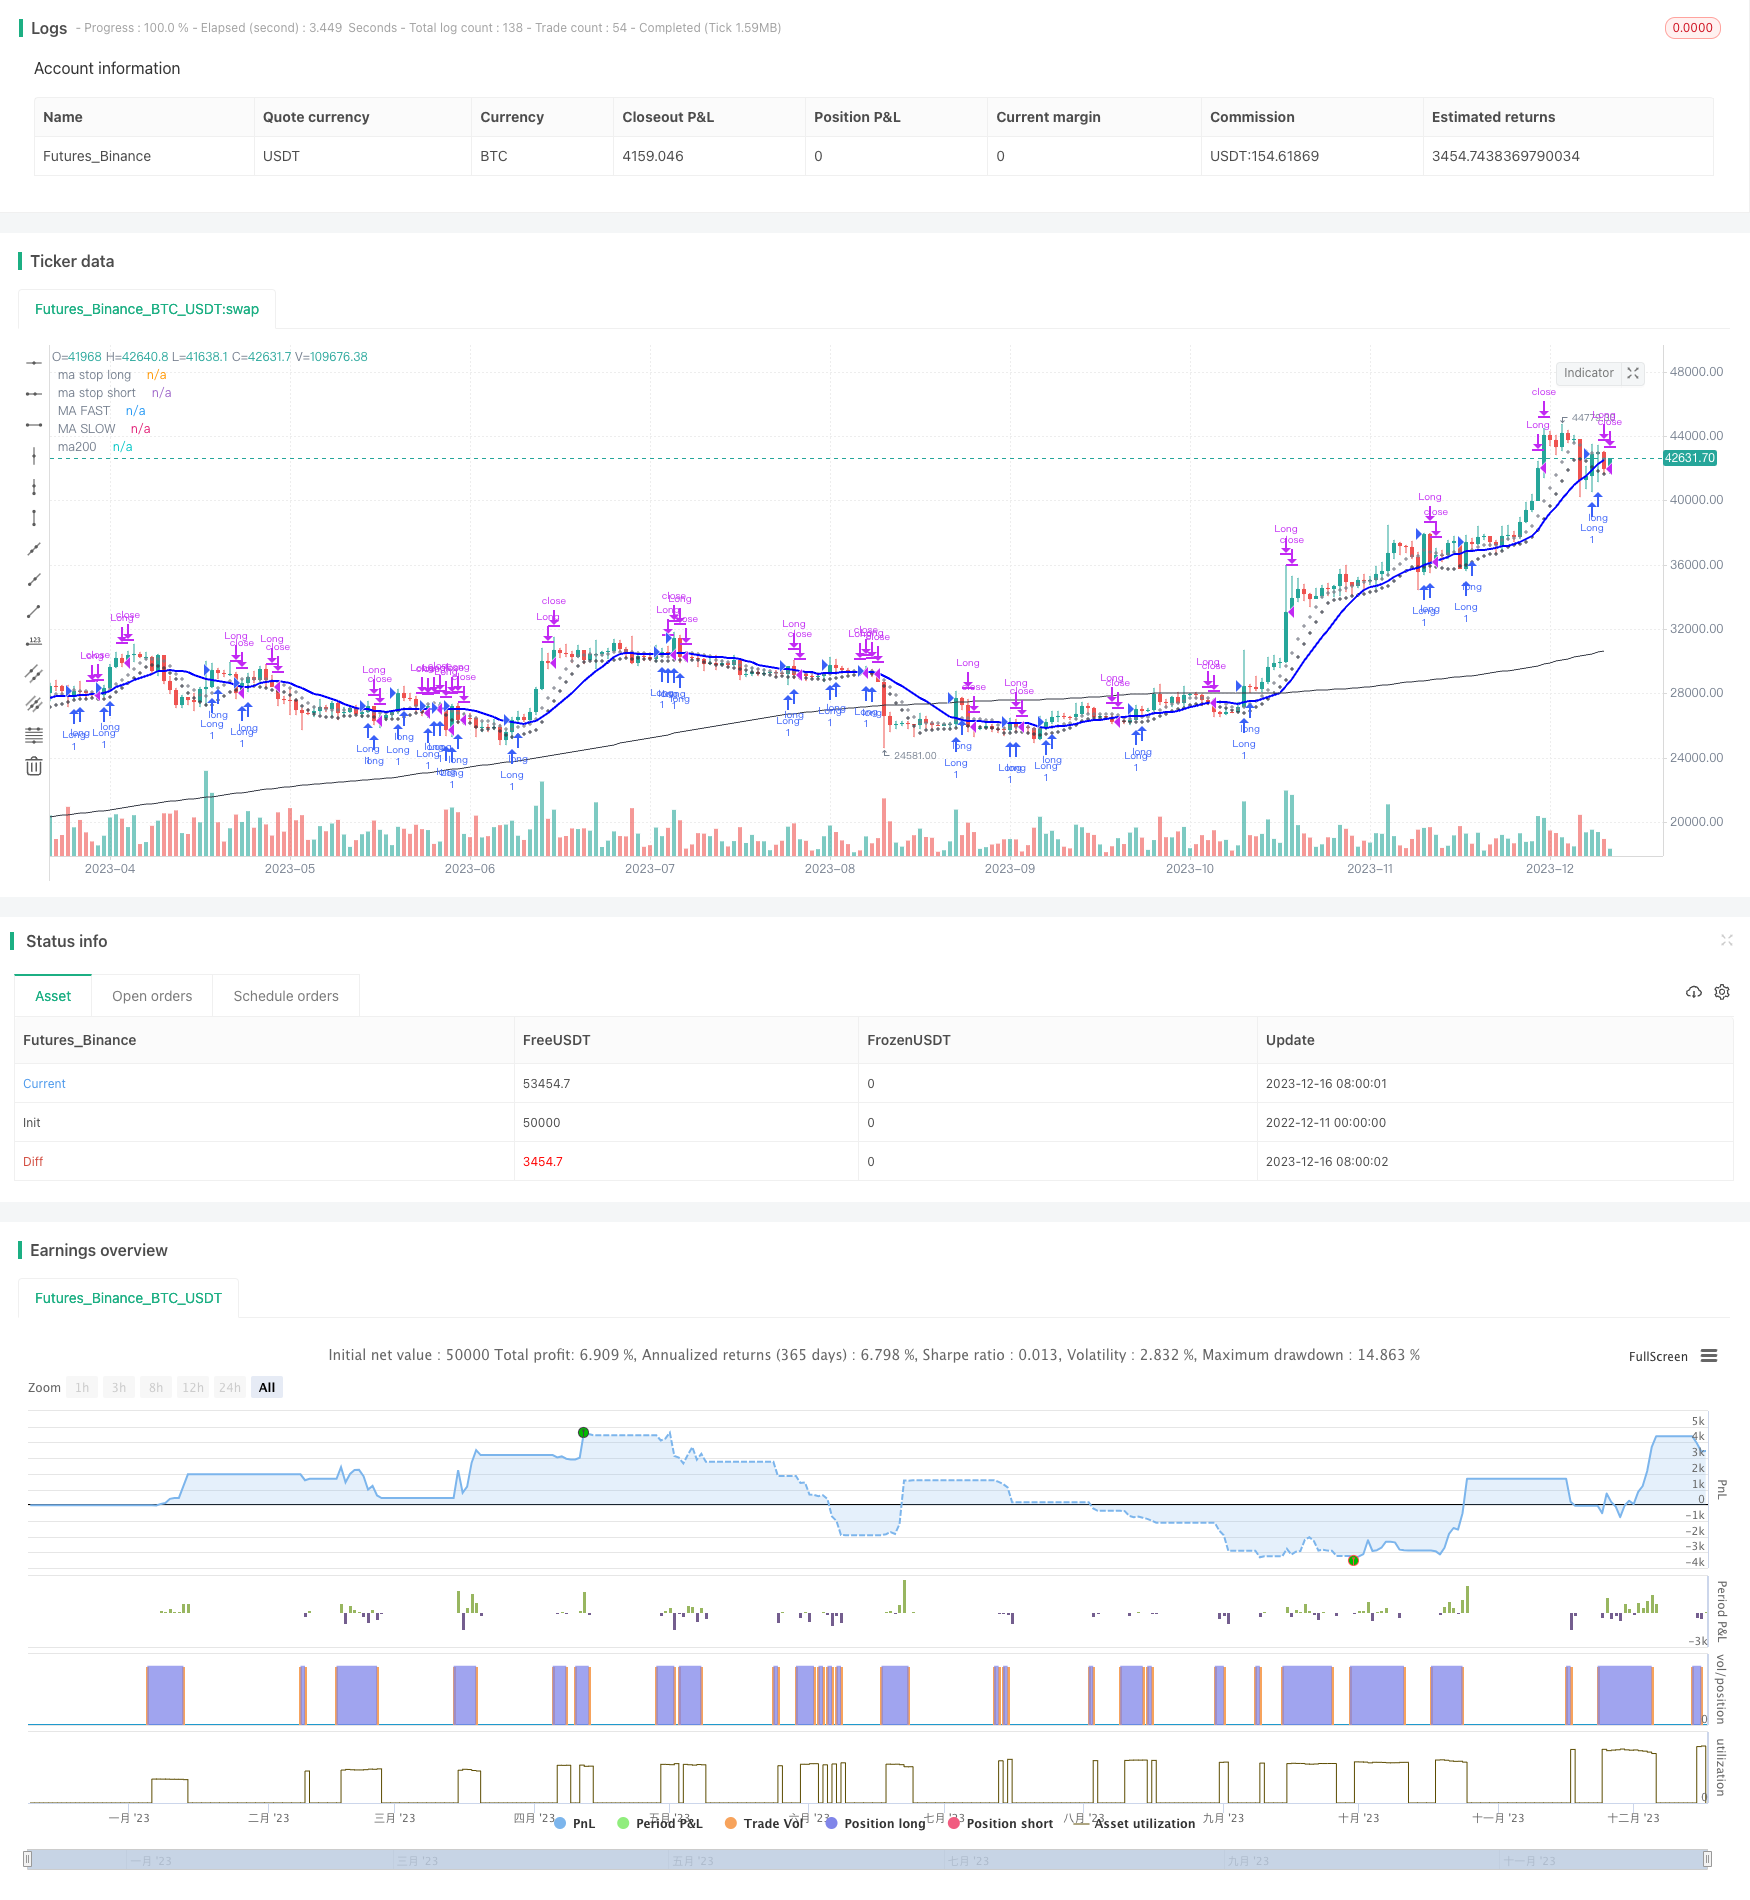
Overview
This strategy is adapted from the articles by Enrico Malverti. It mainly uses Simple Moving Average (SMA) and Relative Strength Index (RSI) to identify long entry and exit signals. The strategy only goes long but not short.
Strategy Logic
The entry signal is triggered when closing price crosses over the longer period SMA line.
Exit signals include:
- Close long when RSI crosses below 70 or goes above 75;
- Stop loss when closing price crosses below the shorter period SMA line;
- Take profit when closing price crosses below the shorter period SMA line.
The stop loss SMA line and take profit SMA line are also plotted.
Advantage Analysis
The advantages of this strategy:
- Uses simple and easy-to-understand indicator combination;
- Only goes long to avoid short selling risk;
- Has clear entry, stop loss and take profit rules, controllable risk;
- Easy to optimize by adjusting SMA periods etc.
Risk Analysis
There are some risks:
- Psychological bias of losing confidence after losses;
- SMA line shift may cause risks;
- RSI divergence signals may be unreliable.
Solutions:
- Build fixed trading mechanism following rules;
- Optimize SMA periods;
- Add other filters for RSI signals.
Optimization Directions
The strategy can be further optimized:
- Test different parameters for SMA;
- Add other indicators as filters;
- Add trend identification to distinguish trend and consolidation;
- Parameter adaption and optimization.
Conclusion
The overall idea is simple and clear. With basic indicators and controllability, it suits medium-long term trading. But parameter tuning and indicator filtering require lots of tests and optimization to make the strategy more solid and reliable. Simple ideas need huge efforts on optimization and combination to form real usable trading systems.
Parameters
| Name | Default | What it controls |
|---|---|---|
| v_input_1 | 14 | Ma periodo veloce |
| v_input_2 | 14 | Ma periodo lungo |
| v_input_3 | 7 | Ma periodi stop |
| v_input_4 | 14 | RSI period |
Source Pine Script
/*backtest
start: 2022-12-11 00:00:00
end: 2023-12-17 00:00:00
period: 1d
basePeriod: 1h
exchanges: [{"eid":"Futures_Binance","currency":"BTC_USDT"}]
*/

//@version= 4
// form the original idea of Enrico Malverti www.enricomalverti.com , trading system 2015
// https://sauciusfinance.altervista.org
strategy(title="MAs & RSI strategy long only", overlay = true, max_bars_back=500)

///********FROM EMAS TO SIMPLE MA *****
// NON AGGIUNTO SCHAFF INDICATOR, che serve per discriminare quali titoli scegliere dallo screener (segnale già aperto o il primo o, a parità,
//quello più alto) ==> Tolte le bande di Bollinger (che filtrano "poco")

// INPUTS
emapf = input(14, title ="Ma periodo veloce",  minval=1, step = 1)
emapl = input(14, title ="Ma periodo lungo",  minval=1, step = 1)
emaps = input(7, title ="Ma periodi stop",  minval=1, step = 1)
rsi_period = input(14, title="RSI period", minval = 1, step = 1)
// CALCULATIONS
maf = sma(close, emapf)
mal = sma(close, emapl)
// rsi
myrsi = rsi(close, rsi_period)
//ema stop long ed ema stop short
//Ema7 messo da "massimo" a "chiusura" come target per posizioni short. Il limite è, in questo caso, sempre ema20 (più restringente - asimmetria)
// in questo t.s., lo short viene soltanto indicato come "rappresentazione grafica", non agito
mass = sma(close, emaps)
masl = sma(low, emaps)
ma200=sma(close,200)
/// Entry
strategy.entry("Long", true, when = crossover(close,mal))

rsi1 = crossunder(myrsi,70)
rsi2 = myrsi > 75
// previously, 80
st_loss_long = crossunder(close,masl)// **chiusura sotto EMA7**
target_long= crossunder(close,maf) //* Chiusura sotto EMA14*
// exits. *RSI**Long: Target if over bandamax, loss if under bandamin. Viceversa, for short
strategy.close("Long", when = rsi1, comment="crossunder RSI")
strategy.close("Long", when = rsi2, comment ="RSI MAX")
strategy.close("Long", when = st_loss_long, comment = "Stop loss")
strategy.close("Long", when = target_long, comment = "target_long" )

plot(masl, title="ma stop long", color=#363A45, linewidth= 1, style=plot.style_cross)
plot(maf, title="MA FAST", color=#FF0000,  linewidth= 1)
plot(mal, title="MA SLOW", color=#0000FF,  linewidth= 2)
plot(mass, title="ma stop short", color=#787B86,linewidth= 1, style=plot.style_cross)
plot(ma200, title="ma200", color=color.black,  linewidth= 1)
Published by ChaoZhang on the FMZ strategy square · last modified 2023-12-18. Collected in the Quant Trading Vault. Unvalidated research: re-test with your own data and costs before trusting it.
Build this with AgenKit
A spec is not a trading system. Paste this into your coding agent and AgenKit runs a specialist team — architecture, test-first build, risk gates, review — with paper trading on by default.
/agenkit build a production-grade trading bot with a backtest engine, risk controls and paper trading by default from strategies/SMA-and-RSI-Long-Only-Strategy.md- npx agenkit install engineering-kit in your project
- Paste the command into your agent and approve each phase
- Get tests, backtest, risk controls and a paper-trading switch
Understand it first
Before you run this, read the lesson behind the idea and how to backtest it honestly. Specs like this one are the survivors of an unknown number of trials; deflate their results accordingly.
Related specs
- Bollinger Bands and RSI Trend Following StrategyPine Script · Trend following · 1h
- EMA Cross Trend Following Strategy with SMA Stop Loss and Re Entry MechanismPine Script · Trend following · 1h
- EMA and RSI Trend Trading StrategyPine Script · Trend following · 1d
- Multi Indicator Trend Divergence Quantitative Trading StrategyPine Script · Trend following · 1d
- Multi Indicator Trend Following Strategy with Dynamic Risk ManagementPine Script · Trend following · 2h
- Trend Tracking Strategy Based on Multi indicatorPine Script · Trend following · 1d