Strategy vault / Trend following
SMA Crossover Compounding Strategy
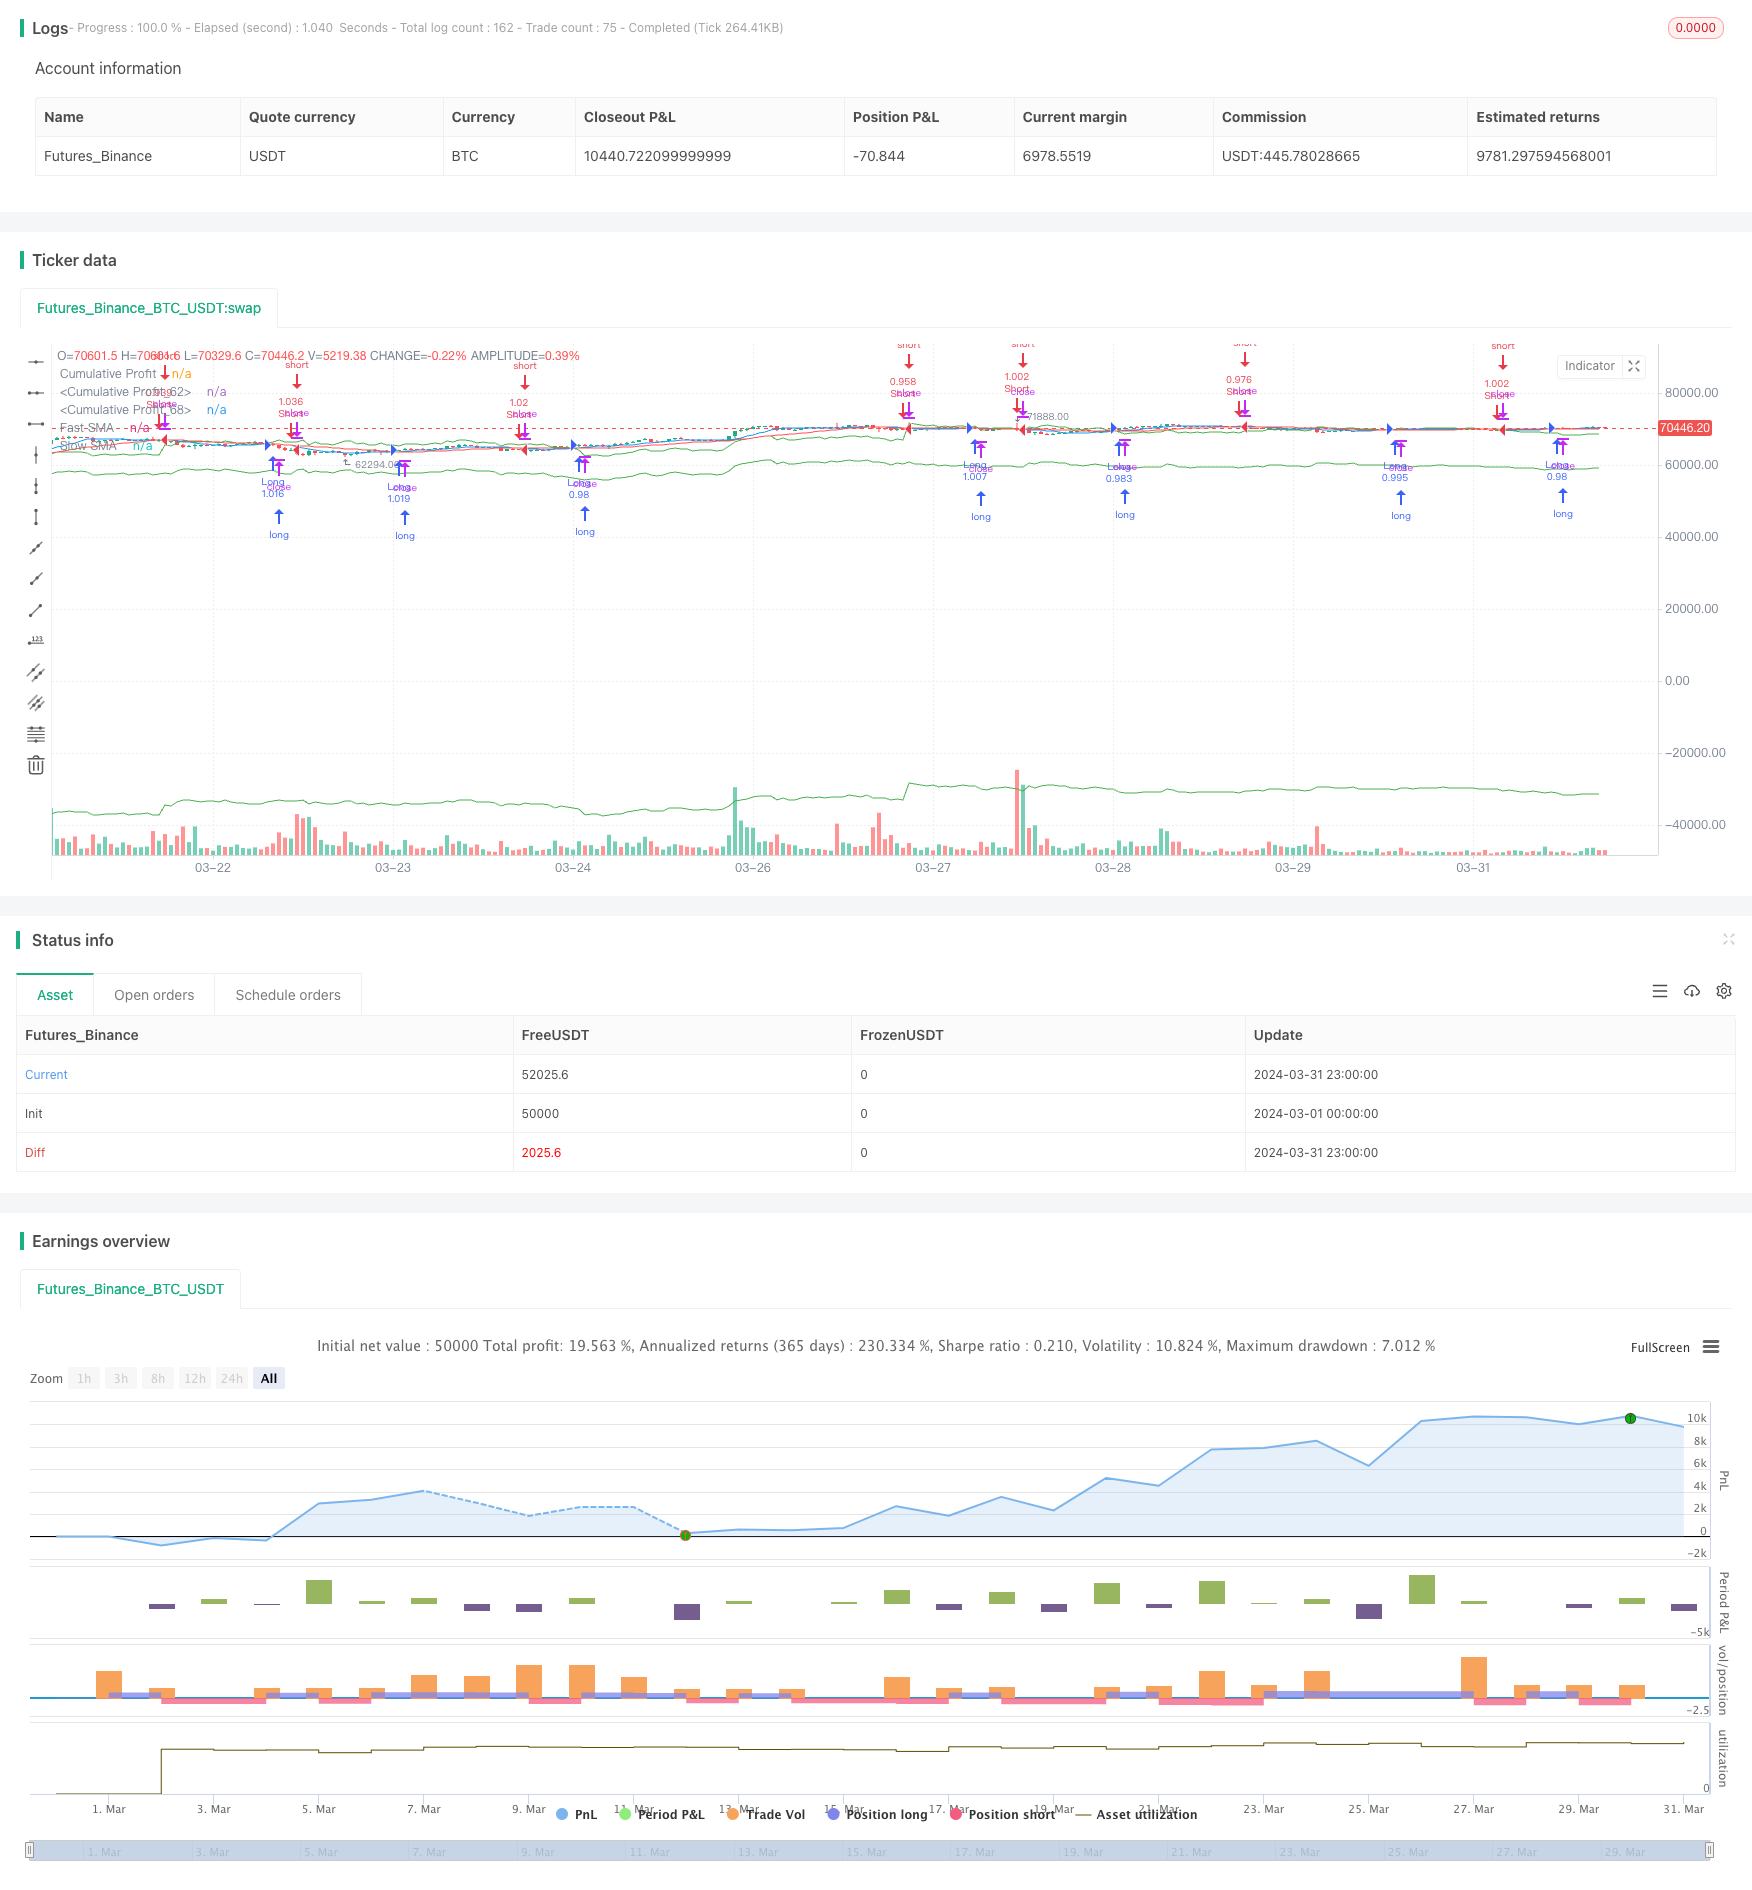
This strategy is a long/short strategy based on the crossover of Simple Moving Averages (SMAs). It uses two SMAs with different periods to generate trading signals. When the fast SMA crosses above the slow SMA from…
Overview
This strategy is a long/short strategy based on the crossover of Simple Moving Averages (SMAs). It uses two SMAs with different periods to generate trading signals. When the fast SMA crosses above the slow SMA from below, it generates a long signal; when the fast SMA crosses below the slow SMA from above, it generates a short signal. The strategy incorporates the concept of compounding, dynamically adjusting position size based on the current account balance and cumulative profit. This allows the account balance to grow over time, enhancing the strategy's profitability.
Strategy Principle
The core principle of this strategy is to utilize SMA crossovers to generate trading signals. SMA is a trend-following indicator that determines the overall direction of the price by averaging the closing prices over a specified period. By using two SMAs with different periods, the strategy can capture changes in market trends. When the fast SMA crosses above the slow SMA, it indicates that an uptrend may be forming, prompting the strategy to enter a long position. Conversely, when the fast SMA crosses below the slow SMA, it suggests that a downtrend may be developing, leading the strategy to enter a short position.
The strategy employs the concept of compounding to manage position sizing. It calculates the position size based on the current account balance and cumulative profit. This means that as the account balance grows, the strategy proportionally increases the position size, maximizing the profit potential. By dynamically adjusting the position size, the strategy can fully capitalize on the advantages of account growth.
Strategy Advantages
Simplicity: The strategy is based on SMA crossovers, making it a simple and straightforward trend-following strategy. It does not require complex market timing or subjective judgments, making it easy to implement and manage.
Trend-following: By utilizing SMA crossovers, the strategy effectively captures market trends. It can engage in long trades during uptrends and short trades during downtrends, maximizing profit potential.
Dynamic Position Sizing: The strategy employs the concept of compounding to manage position sizes. By dynamically adjusting the position size based on the account balance and cumulative profit, the strategy can fully leverage the benefits of account growth, enhancing profitability.
Adaptability: The strategy can be applied to various markets and asset classes, such as stocks, forex, commodities, etc. Its simplicity and adaptability make it a versatile trading strategy.
Strategy Risks
Market Risk: The strategy relies on the persistence of market trends. It may suffer losses during market volatility or trend reversals. Unexpected events, economic data releases, and other factors can cause sudden changes in market direction, adversely affecting the strategy.
Parameter Risk: The strategy's performance depends on the choice of SMA periods. Different period combinations may yield different results. Improper parameter selection can lead to suboptimal strategy performance or missed trading opportunities.
Overtrading: During volatile market conditions, frequent SMA crossovers may result in overtrading, increasing transaction costs and slippage, which can impact the overall performance of the strategy.
Compounding Risk: While compounding can enhance the strategy's profitability, it also amplifies the risk of losses. In the event of consecutive losses, the account balance can rapidly diminish, limiting the strategy's recovery potential.
Strategy Optimization Directions
Parameter Optimization: Optimize the periods of the SMAs to find the optimal parameter combination that improves the strategy's performance. Utilize historical data for backtesting and employ optimization algorithms such as grid search or genetic algorithms to identify the best parameters.
Risk Management: Introduce risk management measures, such as stop-loss and take-profit, to limit losses per trade and protect profits. Dynamically adjust stop-loss and take-profit levels based on market volatility to adapt to different market conditions.
Trend Confirmation: In addition to SMA crossovers, incorporate other trend confirmation indicators, such as MACD or ADX, to filter out false signals and improve signal quality. Only execute trades when multiple indicators simultaneously confirm the trend, enhancing the reliability of the strategy.
Position Sizing Optimization: Optimize the compounding strategy's position sizing rules by introducing risk control measures to limit risk exposure per trade. Consider using the Kelly Criterion or fixed risk percentage to determine the position size for each trade, balancing risk and reward.
Conclusion
This strategy is a trend-following strategy based on SMA crossovers, incorporating the concept of compounding to manage position sizes. Its strengths lie in its simplicity, trend-following ability, dynamic position sizing, and adaptability. However, it also faces challenges such as market risk, parameter risk, overtrading, and compounding risk. To improve the strategy, consider parameter optimization, introducing risk management measures, trend confirmation, and optimizing position sizing rules. With continuous optimization and refinement, the strategy has the potential to achieve consistent performance across various market conditions.
Parameters
| Name | Default | What it controls |
|---|---|---|
| v_input_int_1 | 9 | Fast SMA Length |
| v_input_int_2 | 21 | Slow SMA Length |
Source Pine Script
/*backtest
start: 2024-03-01 00:00:00
end: 2024-03-31 23:59:59
period: 1h
basePeriod: 15m
exchanges: [{"eid":"Futures_Binance","currency":"BTC_USDT"}]
*/

//@version=5
strategy("Umesh SMA Crossover Strategy", overlay=true)

// Input parameters
fast_length = input.int(9, title="Fast SMA Length")
slow_length = input.int(21, title="Slow SMA Length")

// Calculate SMAs
fast_sma = ta.sma(close, fast_length)
slow_sma = ta.sma(close, slow_length)

// Plot SMAs
plot(fast_sma, color=color.blue, title="Fast SMA")
plot(slow_sma, color=color.red, title="Slow SMA")

// Strategy logic
longCondition = ta.crossover(fast_sma, slow_sma)
shortCondition = ta.crossunder(fast_sma, slow_sma)

// Initialize cumulative profit with netprofit
var float cumulative_profit = na
if (na(cumulative_profit))
    cumulative_profit := strategy.netprofit

// // Initialize starting balance
// var float starting_balance = na
// if (na(starting_balance))
//     starting_balance := strategy.equity

// Initialize starting balance
var float starting_balance = na
if (na(starting_balance))
    starting_balance := 100000.0 // Initial balance

// Calculate profit or gains
if (strategy.opentrades != 0)
    cumulative_profit := strategy.netprofit + (strategy.equity - starting_balance)

// Calculate position size based on current balance and cumulative profit
//position_size = 100000
position_size = starting_balance + cumulative_profit

// Entry conditions
if (longCondition)
    strategy.entry("Long", strategy.long, qty = position_size / close)
if (shortCondition)
    strategy.entry("Short", strategy.short, qty = position_size / close)

// // Entry conditions
// if (longCondition)
//     strategy.entry("Long", strategy.long, qty = 100000 / close)
// if (shortCondition)
//     strategy.entry("Short", strategy.short, qty = 100000 / close)


// Plot strategy.equity
plot(strategy.equity, color=color.green, title="Cumulative Profit")

// Print cumulative profit value on chart
label.new(x = bar_index, y = strategy.equity, text = str.tostring(strategy.equity), style=label.style_label_down, color=color.new(color.green, 0), size=size.small)
// Plot cumulative profit
plot(cumulative_profit, color=color.green, title="Cumulative Profit")

// Print cumulative profit value on chart
label.new(x = bar_index, y = cumulative_profit, text = str.tostring(cumulative_profit), style=label.style_label_down, color=color.new(color.green, 0), size=size.small)

// Plot cumulative profit
plot(position_size, color=color.green, title="Cumulative Profit")

// Print cumulative profit value on chart
label.new(x = bar_index, y = position_size, text = str.tostring(position_size), style=label.style_label_down, color=color.new(color.green, 0), size=size.small)
Published by ChaoZhang on the FMZ strategy square · last modified 2024-04-01. Collected in the Quant Trading Vault. Unvalidated research: re-test with your own data and costs before trusting it.
Build this with AgenKit
A spec is not a trading system. Paste this into your coding agent and AgenKit runs a specialist team — architecture, test-first build, risk gates, review — with paper trading on by default.
/agenkit build a production-grade trading bot with a backtest engine, risk controls and paper trading by default from strategies/SMA-Crossover-Compounding-Strategy.md- npx agenkit install engineering-kit in your project
- Paste the command into your agent and approve each phase
- Get tests, backtest, risk controls and a paper-trading switch
Understand it first
Before you run this, read the lesson behind the idea and how to backtest it honestly. Specs like this one are the survivors of an unknown number of trials; deflate their results accordingly.
Related specs
- ADX MA and EMA Long Only Trend Tracking StrategyPine Script · Trend following · 1d
- ATR and Moving Average Crossover Hybrid StrategyPine Script · Trend following · 1h
- Adaptive FVG Detection and MA Trend Trading Strategy with Dynamic ResistancePine Script · Trend following · 1d
- Adaptive Risk Management Strategy Based on Dynamic ATR and Moving Average CrossoverPine Script · Trend following · 2h
- Adaptive Trading Strategy Based on Stochastic RSI Dual Line CrossoverPine Script · Trend following · 4h
- Adaptive Volatility Based Trend Following Short Strategy with Time Delay and Stop Loss ProtectionPine Script · Trend following · 2m