Strategy vault / Trend following
SMA Crossover Strategy
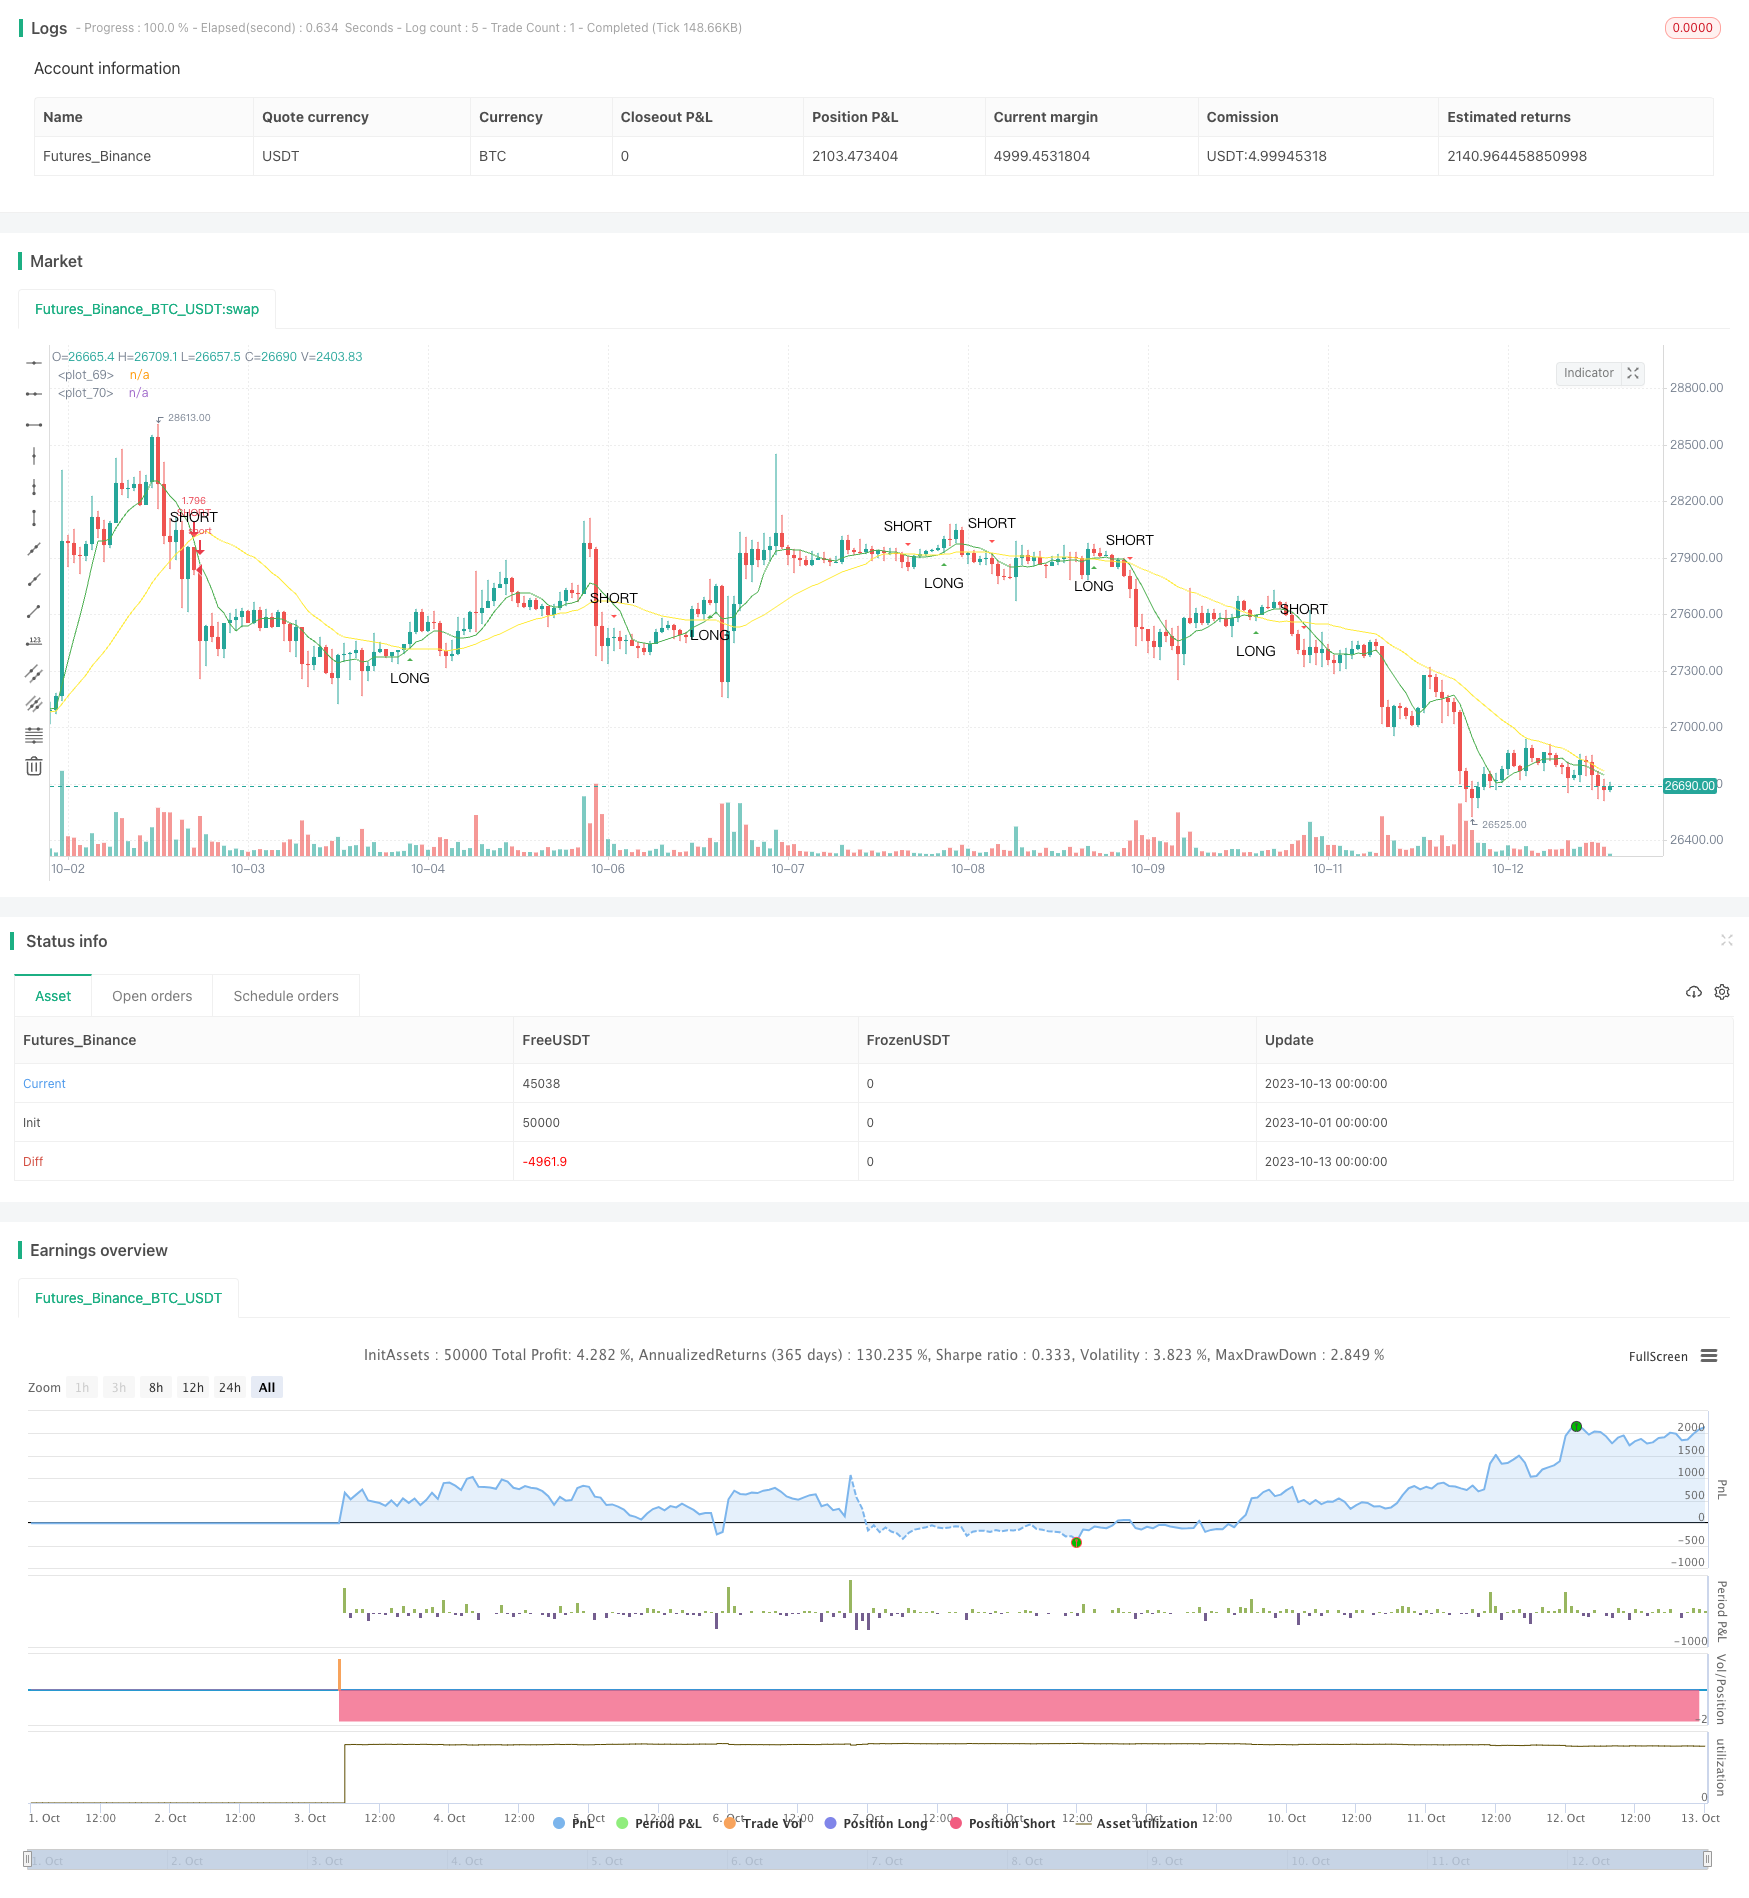
This strategy generates trading signals based on the crossover between fast and slow moving averages. It produces buy signals when the fast moving average crosses above the slow moving average from below. It produces…
Overview
This strategy generates trading signals based on the crossover between fast and slow moving averages. It produces buy signals when the fast moving average crosses above the slow moving average from below. It produces sell signals when the fast moving average crosses below the slow moving average from above.
Principles
This strategy uses the sma function to calculate the fast and slow moving averages. The fast_SMA is the fast moving average with period length fast_SMA_input. The slow_SMA is the slow moving average with period length slow_SMA_input.
The strategy uses the cross and crossunder functions to determine the crossover between the fast and slow moving averages. When the fast moving average crosses above the slow moving average, the LONG variable is true and a buy signal is generated. When the fast moving average crosses below the slow moving average, the SHORT variable is true and a sell signal is generated.
Advantages
This strategy has the following advantages:
- Simple principle, easy to understand and implement.
- Customizable moving average periods, adaptable to different market environments.
- Filters out some market noise and generates relatively reliable trading signals.
- Captures both the start and turning points of trends.
Risks
This strategy also has the following risks:
- Can generate excessive trading signals if the settings are improper, leading to overtrading.
- May produce many false signals in sideways markets.
- Cannot determine the duration of a trend, may reverse prematurely.
Risk management:
- Set appropriate moving average parameters to balance filtering effect and sensitivity.
- Add trend indicator filters to avoid false signals.
- Set stop loss points to control loss per trade.
Optimization
This strategy can be optimized from the following aspects:
- Add filtering conditions on volume or volatility when the breakout happens to avoid false breakouts.
- Incorporate trend indicators to identify trend direction and strength.
- Add machine learning models to auto-optimize the moving average parameters.
- Combine with support/resistance and Bollinger Bands to define trading ranges and improve entry accuracy.
Summary
This strategy effectively generates trading signals by leveraging the advantages of moving averages. Although there are some risks, they can be improved by parameter optimization, adding filters etc. The moving average crossover strategy is worth further research and application.
Parameters
| Name | Default | What it controls |
|---|---|---|
| v_input_1 | 2018 | Start Year |
| v_input_2 | true | Start Month |
| v_input_3 | true | Start Day |
| v_input_4 | 2019 | End Year |
| v_input_5 | true | End Month |
| v_input_6 | true | End Day |
| v_input_7 | 7 | SMA Fast |
| v_input_8 | 25 | SMA Slow |
Source Pine Script
/*backtest
start: 2023-10-01 00:00:00
end: 2023-10-13 00:00:59
period: 1h
basePeriod: 15m
exchanges: [{"eid":"Futures_Binance","currency":"BTC_USDT"}]
*/

//@author Jacques Grobler
//
//                  SIMPLE CROSS OVER BOT
//                  =====================
//
// This is a simple example of how to set up a strategy to go long or short
// If you make any modifications or have any suggestions, let me know
// When using this script, every section marked back testing should be
// uncommented in order to use for back testing, same goes for using the script portion

///////////////////////////////////////////////////////////////////////////////////////
//// INTRO
//// -----
// BACKTESTING
//@version=4
strategy(title="SimpleCrossOver_Bot_V1_Backtester", overlay=true, default_qty_type=strategy.percent_of_equity, default_qty_value=100, pyramiding=0, commission_type=strategy.commission.percent, commission_value=0.1)

// SIGNALS
//study(title="SimpleCrossOver_Bot_V1_Signals", overlay = true)

///////////////////////////////////////////////////////////////////////////////////////
//// INPUTS
//// ------
// BACKTESTING
dateSart_Year = input(2018, title="Start Year", minval=2000)
dateSart_Month = input(1, title="Start Month", minval=1, maxval=12)
dateSart_Day = input(1, title="Start Day", minval=1, maxval=31)
dateEnd_Year = input(2019, title="End Year", minval=2000)
dateEnd_Month = input(1, title="End Month", minval=1, maxval=12)
dateEnd_Day = input(1, title="End Day", minval=1, maxval=31)

// BACKTESTING AND SIGNALS
fast_SMA_input = input(7, title="SMA Fast")
slow_SMA_input = input(25, title="SMA Slow")

///////////////////////////////////////////////////////////////////////////////////////
//// INDICATORS
//// ----------
fast_SMA = sma(close, fast_SMA_input)
slow_SMA = sma(close, slow_SMA_input)

///////////////////////////////////////////////////////////////////////////////////////
//// STRATEGY
//// --------
LONG = cross(fast_SMA, slow_SMA) and fast_SMA > slow_SMA
stratLONG() => crossover(fast_SMA, slow_SMA)
SHORT = cross(fast_SMA, slow_SMA) and fast_SMA < slow_SMA
stratSHORT() => crossunder(fast_SMA, slow_SMA)

///////////////////////////////////////////////////////////////////////////////////////
//// TRIGGERS
//// --------
// BACKTESTING
testPeriodStart = timestamp(dateSart_Year, dateSart_Month, dateSart_Day, 0, 0)
testPeriodStop = timestamp(dateEnd_Year, dateEnd_Month, dateEnd_Day, 0, 0)
timecondition = true

strategy.entry(id="LONG", long = true, when=timecondition and stratLONG())
strategy.entry(id="SHORT", long = false, when=timecondition and stratSHORT())

// SIGNALS
//alertcondition(LONG, title="LONG")
//alertcondition(SHORT, title="SHORT")

///////////////////////////////////////////////////////////////////////////////////////
//// PLOTS
//// -----
// BACKTESTING AND SIGNALS
plot(fast_SMA, color=green, linewidth=1)
plot(slow_SMA, color=yellow, linewidth=1)
plotshape(LONG, title="LONG", style=shape.triangleup, text="LONG", location=location.belowbar, size=size.small, color=green)
plotshape(SHORT, title="SHORT", style=shape.triangledown, text="SHORT", location=location.abovebar, size=size.small, color=red)Published by ChaoZhang on the FMZ strategy square · last modified 2023-11-08. Collected in the Quant Trading Vault. Unvalidated research: re-test with your own data and costs before trusting it.
Build this with AgenKit
A spec is not a trading system. Paste this into your coding agent and AgenKit runs a specialist team — architecture, test-first build, risk gates, review — with paper trading on by default.
/agenkit build a production-grade trading bot with a backtest engine, risk controls and paper trading by default from strategies/SMA-Crossover-Strategy.md- npx agenkit install engineering-kit in your project
- Paste the command into your agent and approve each phase
- Get tests, backtest, risk controls and a paper-trading switch
Understand it first
Before you run this, read the lesson behind the idea and how to backtest it honestly. Specs like this one are the survivors of an unknown number of trials; deflate their results accordingly.
Related specs
- Bollinger Bands Precise Crossover Quantitative StrategyPine Script · Trend following · 1h
- Going with the Trend Moving Average Crossover StrategyPine Script · Trend following · 1d
- Advanced Trend Trading Strategy Based on Bollinger Bands and Candlestick PatternsPine Script · Trend following · 12h
- Bollinger Bands and Fibonacci Trading StrategyPine Script · Trend following · 45m
- Multi Band Statistical Trend Analysis StrategyPine Script · Trend following · 1h
- Bollinger Band Crossover with Slippage and Price Impact Combined StrategyPine Script · Trend following · 1d