Strategy vault / Trend following
SMA System Trend Following Strategy
The strategy is named "SMA System Trend Following Strategy". The main idea is to construct trading signals based on the SMA lines with different parameter lengths and enter the market at breakpoint, with stop loss…
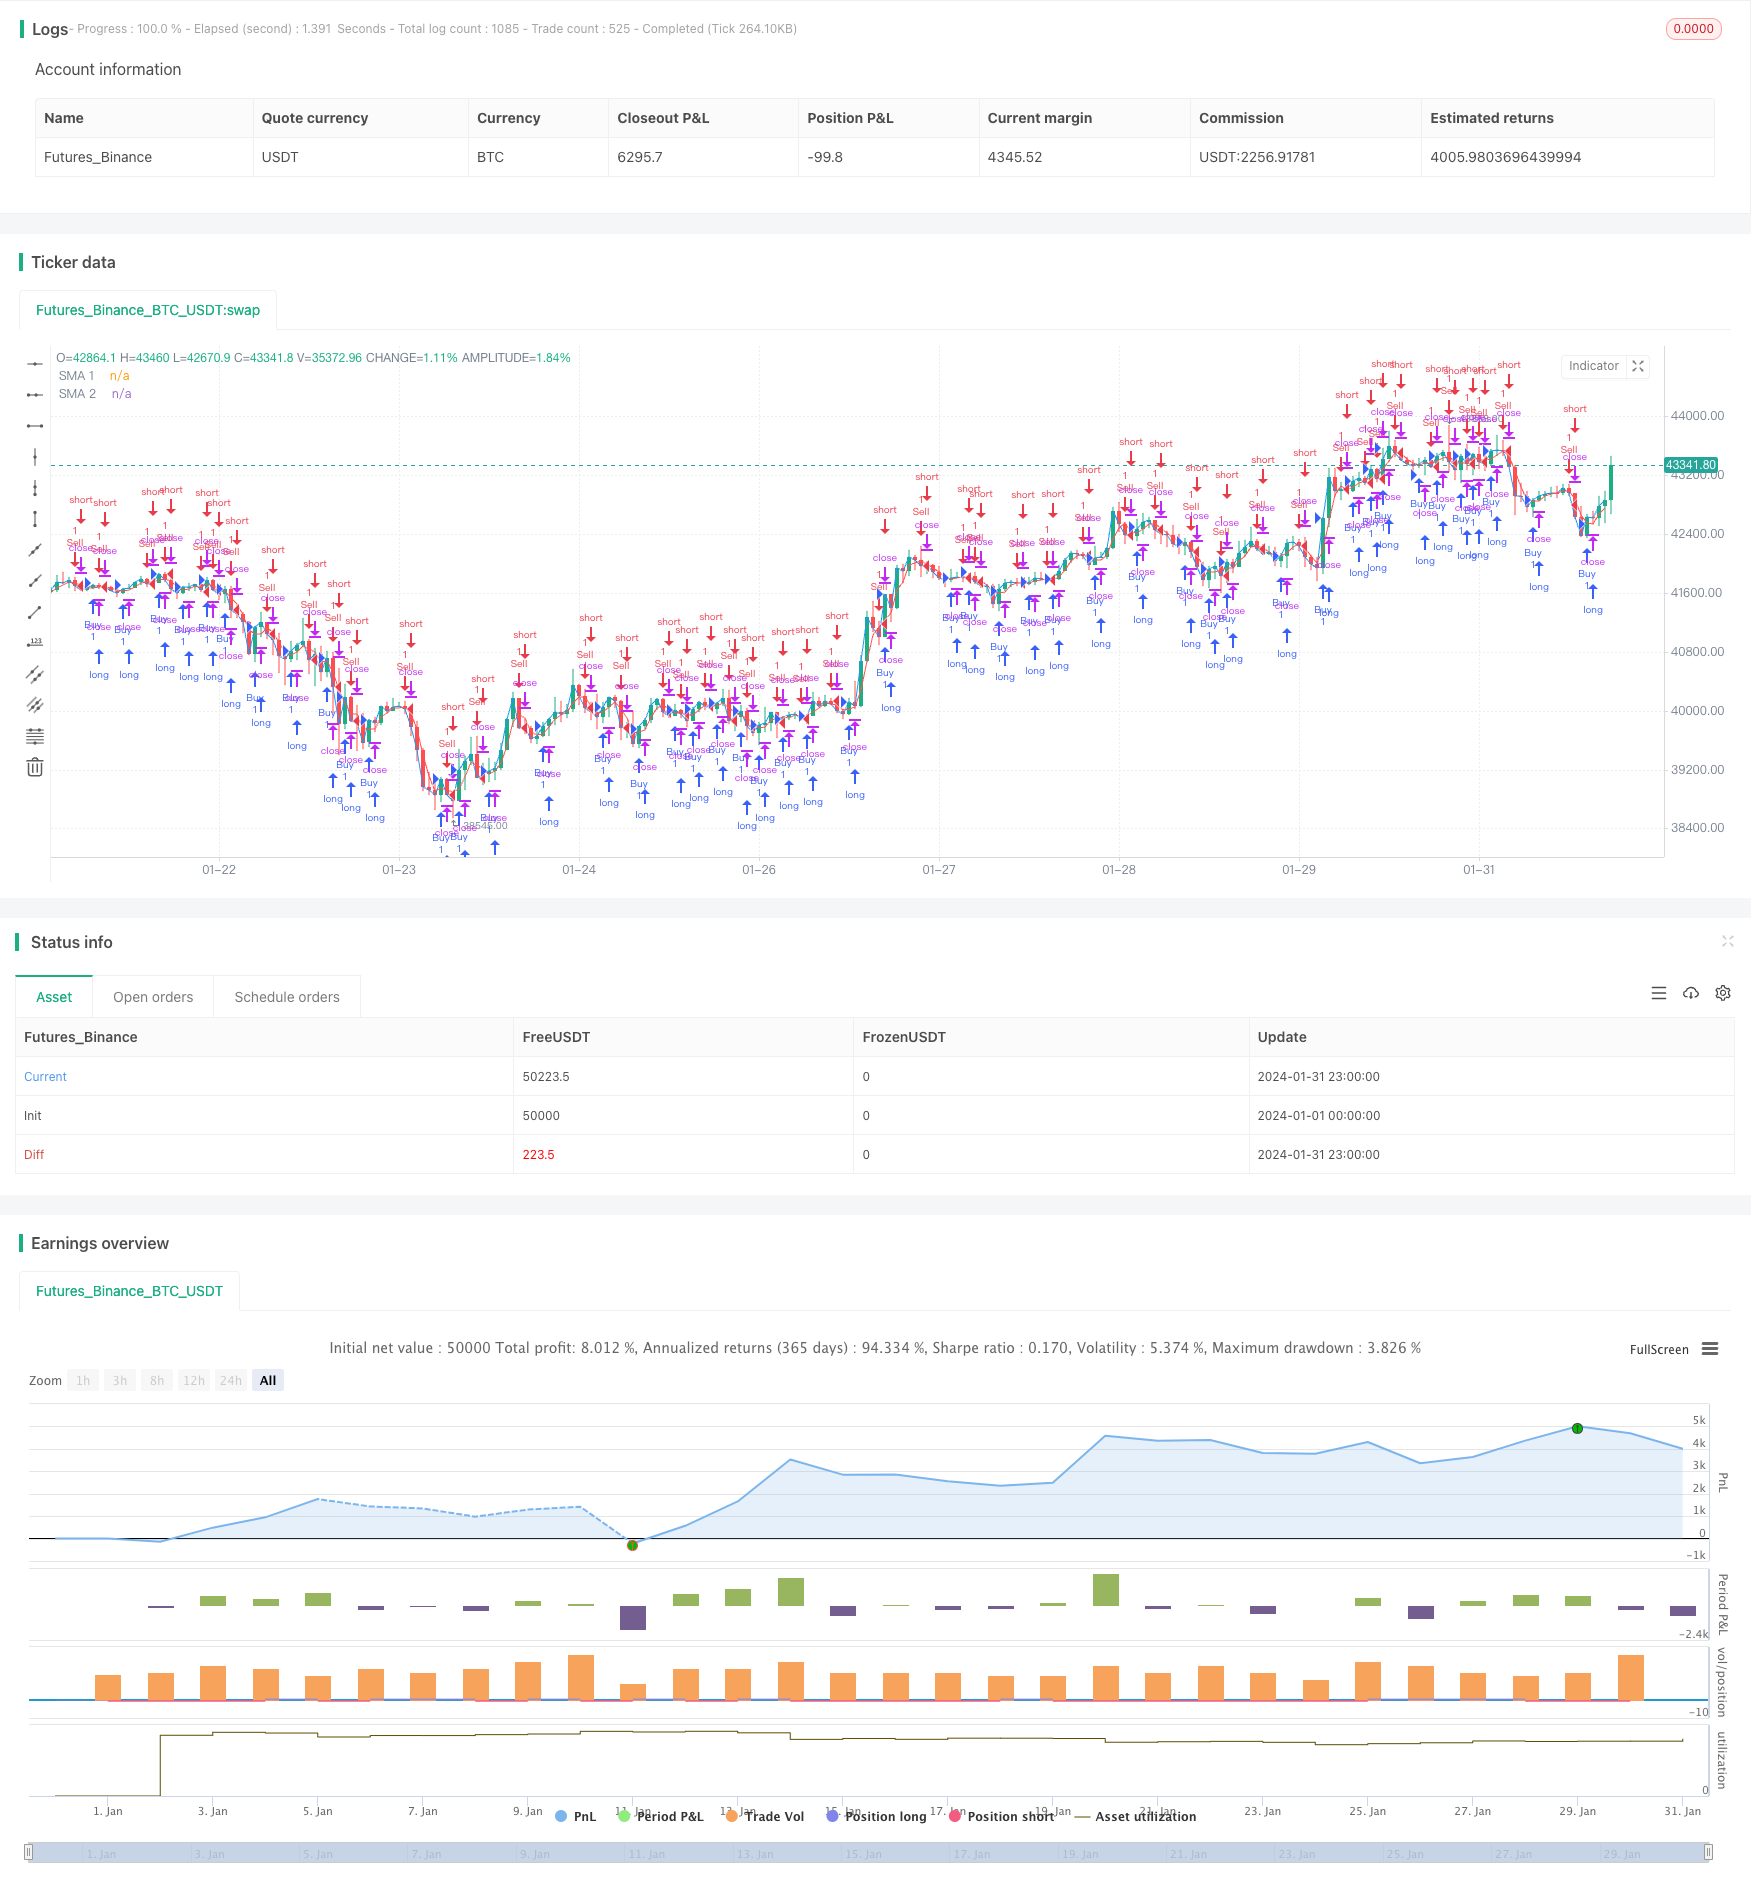
Overview
The strategy is named "SMA System Trend Following Strategy". The main idea is to construct trading signals based on the SMA lines with different parameter lengths and enter the market at breakpoint, with stop loss mechanism to control the risk.
Strategy Principle
The strategy uses two SMA lines, SMA1 and SMA2. SMA1 length is 1 and SMA2 length is 3. By calculating these two SMA lines, when SMA1 crosses above SMA2, a buy signal is generated. When SMA1 crosses below SMA2, a sell signal is generated. This aims to capture the trend of the price.
Specifically, the strategy judges the crossover relationship between the SMA lines through the ta.crossover and ta.crossunder functions, generating the longCondition and shortCondition boolean variables. When longCondition is true, a buy signal is generated. When shortCondition is true, a sell signal is generated. The strategy will enter the market at the signal point and update the profitAccumulated and lastTradeProfit variables to track accumulated profits.
For risk control, the strategy also sets a stop loss mechanism based on fixed points. If the price reaches the set stop loss point from the entry point, it will trigger the closing of the stop loss order.
Advantage Analysis
The biggest advantage of this strategy is that it utilizes the trend tracking capability of SMA lines to effectively capture changes in price trends. Compared with single line strategies, double line strategies can use the crossover relationship between the lines to determine the trend direction and thus generate trading signals. In addition, the stop loss mechanism can effectively control single loss.
Risk Analysis
The main risk of this strategy is that the moving average strategy tends to generate false signals. When the price oscillates, the SMA line may frequently cross, resulting in unnecessary trading signals. At this point, large losses may occur without effective stop loss.
Optimization Directions
The strategy can be optimized in the following aspects:
Adjust SMA parameters to find the best combination of moving average lengths through backtesting.
Increase filtering conditions and set price breakthrough conditions near the moving average crossover point to avoid false signals.
Different types of stop loss methods can be tested, such as mobile stop loss, pending order stop loss, etc.
Add Position Size control to optimize capital utilization efficiency.
Conclusion
Overall, this is a typical trend following strategy. It uses the breakthrough relationship between SMA lines to determine the direction of the price trend and enter at the turning point of the trend. At the same time, the strategy has a fixed stop loss function to control risks. The strategy is simple, easy to understand, but still needs in-depth testing and optimization before making stable profits in real trading.
Parameters
| Name | Default | What it controls |
|---|---|---|
| v_input_1 | true | SMA 1 Longitud |
| v_input_2 | 3 | SMA 2 Longitud |
| v_input_3 | 5000 | Stop Loss (en pips) |
Source Pine Script
/*backtest
start: 2024-01-01 00:00:00
end: 2024-01-31 23:59:59
period: 1h
basePeriod: 15m
exchanges: [{"eid":"Futures_Binance","currency":"BTC_USDT"}]
*/

// This Pine Script™ code is subject to the terms of the Mozilla Public License 2.0 at https://mozilla.org/MPL/2.0/
// © cesarpieres72

//@version=5
strategy("Estrategia SMA y Ganancias Acumuladas con Stop Loss", shorttitle="SMA_Ganancias", overlay=true)

// Definir las variables de las medias móviles
sma1_length = input(1, title="SMA 1 Longitud")
sma2_length = input(3, title="SMA 2 Longitud")

// Calcular las medias móviles
sma1 = ta.sma(close, sma1_length)
sma2 = ta.sma(close, sma2_length)

// Condiciones para las señales de compra y venta
longCondition = ta.crossover(sma1, sma2)
shortCondition = ta.crossunder(sma1, sma2)

// Acumular las ganancias
var float profitAccumulated = 0.0
var float lastTradeProfit = na

if (longCondition)
    strategy.entry("Buy", strategy.long)
    lastTradeProfit := strategy.netprofit - (profitAccumulated + lastTradeProfit)
    profitAccumulated := strategy.netprofit

if (shortCondition)
    strategy.entry("Sell", strategy.short)
    lastTradeProfit := strategy.netprofit - (profitAccumulated + lastTradeProfit)
    profitAccumulated := strategy.netprofit

// Mostrar las señales en el gráfico
plot(sma1, color=color.blue, title="SMA 1")
plot(sma2, color=color.red, title="SMA 2")

// Añadir stop loss
stopLossPips = input(5000, title="Stop Loss (en pips)")
stopLossPrice = strategy.position_avg_price * (1 - stopLossPips * syminfo.mintick)
strategy.exit("SL", "Buy", stop=stopLossPrice)
Published by ChaoZhang on the FMZ strategy square · last modified 2024-02-23. Collected in the Quant Trading Vault. Unvalidated research: re-test with your own data and costs before trusting it.
Build this with AgenKit
A spec is not a trading system. Paste this into your coding agent and AgenKit runs a specialist team — architecture, test-first build, risk gates, review — with paper trading on by default.
/agenkit build a production-grade trading bot with a backtest engine, risk controls and paper trading by default from strategies/SMA-System-Trend-Following-Strategy.md- npx agenkit install engineering-kit in your project
- Paste the command into your agent and approve each phase
- Get tests, backtest, risk controls and a paper-trading switch
Understand it first
Before you run this, read the lesson behind the idea and how to backtest it honestly. Specs like this one are the survivors of an unknown number of trials; deflate their results accordingly.
Related specs
- ADX MA and EMA Long Only Trend Tracking StrategyPine Script · Trend following · 1d
- ATR and Moving Average Crossover Hybrid StrategyPine Script · Trend following · 1h
- Adaptive FVG Detection and MA Trend Trading Strategy with Dynamic ResistancePine Script · Trend following · 1d
- Adaptive Risk Management Strategy Based on Dynamic ATR and Moving Average CrossoverPine Script · Trend following · 2h
- Adaptive Trading Strategy Based on Stochastic RSI Dual Line CrossoverPine Script · Trend following · 4h
- Adaptive Volatility Based Trend Following Short Strategy with Time Delay and Stop Loss ProtectionPine Script · Trend following · 2m