Strategy vault / Mean reversion
Smart Quantitative Bottom Reversal Trading Strategy
This strategy is a smart quantitative bottom reversal trading strategy designed for cryptocurrencies. It utilizes multi-timeframe technology and adaptive RSI indicator to identify potential short-term bottoms of the…
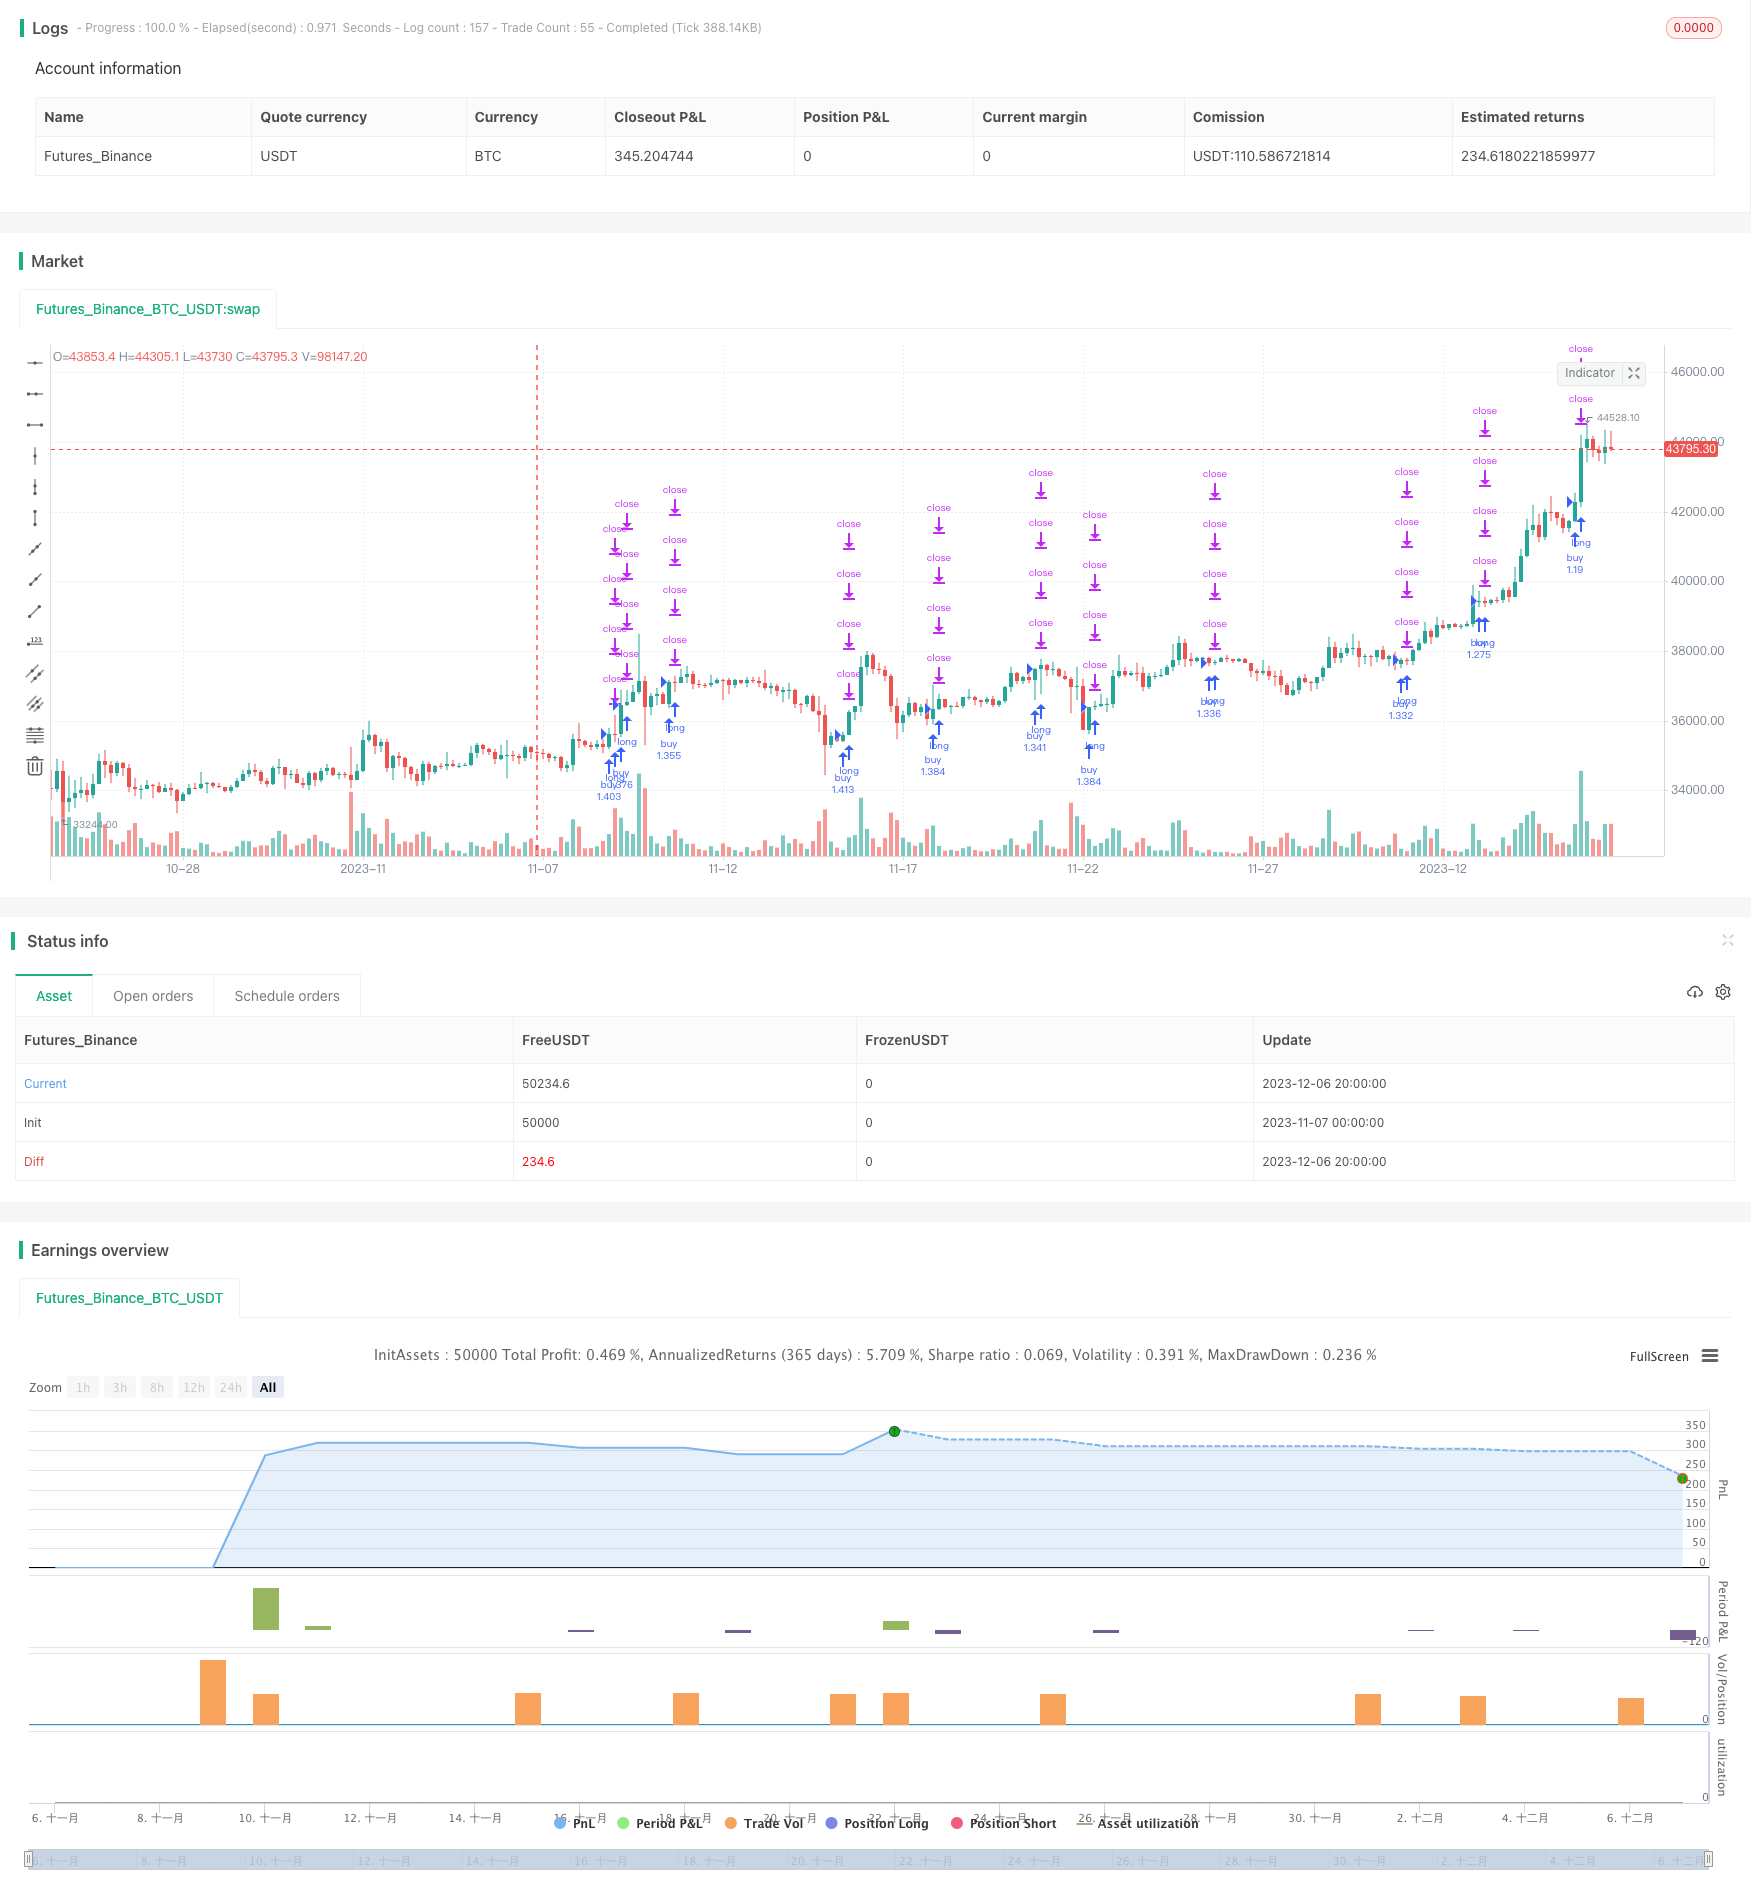
Overview
This strategy is a smart quantitative bottom reversal trading strategy designed for cryptocurrencies. It utilizes multi-timeframe technology and adaptive RSI indicator to identify potential short-term bottoms of the market, and enters for reversal near the bottom to achieve excessive returns.
Strategy Principle
Firstly, the strategy employs change in price and trading volume to calculate the adaptive RSI indicator, judging possible short-term market bottoms. Then, combined with multi-timeframe technology, it confirms bottom signals on a larger timeframe. Buy signals are generated when the adaptive RSI line crosses above the 0 level.
Specifically, the adaptive RSI indicator is calculated as follows: First calculate the change in price for each candlestick, then calculate the trading volume of that candlestick. Multiply the two to get quantified momentum for that candlestick. Apply RSI calculation on quantified momentum and take N period average to obtain the final adaptive RSI indicator. This indicator can clearly identify market bottoms.
On top of that, this strategy incorporates multi-timeframe technology to judge signals on a higher timeframe, avoiding interference from short-term market noise. When the moving average on the higher timeframe turns from the bottom, it is considered the buy timing for this strategy.
Advantage Analysis
The biggest advantage of this strategy lies in the accurate identification of short-term market bottoms using the adaptive RSI indicator, which provides effective signals for bottom reversal trading. In addition, the incorporation of multi-timeframe technology also improves signal quality by avoiding interference from short-term noises.
Compared to traditional RSI indicators, the adaptive RSI indicator introduces quantified momentum in its calculation, making it more sensitive to the rapidly changing cryptocurrency market, and hence able to identify bottoms earlier and more precisely, providing a head start for bottom reversal trading.
In addition, this strategy combines the advantages of both trend following and reversal trading. In uncertain market conditions, it can profit from reversal trading. In a clear bull market, it can also follow the trend.
Risk Analysis
The main risk of this strategy is that the accuracy of bottom identification cannot be 100% guaranteed. There can be huge irrational fluctuations in the market in the short run. If the bottom extends further down, large stop loss risks would be faced.
In addition, divergences can occur between different timeframes. If signals from higher timeframes lag behind, it may lead to trading losses.
To control risks, this strategy adopts relatively conservative stop loss mechanisms and takes profits in batches, progressively optimizing returns. Also, parameters of the adaptive RSI can be adjusted to optimize accuracy in bottom judging.
Optimization Directions
This strategy can be optimized in the following aspects:
Optimize parameters of the adaptive RSI to improve accuracy in market bottom judgment. Different period parameters can be tested.
Add other indicators for confirmation to avoid false signals, such as combining with volume indicators etc.
Optimize the stop loss mechanism to allow wider stop loss range while ensuring good risk-reward ratio, in order to capture more trend profits.
Optimize timeframe selection to ensure signal reliability on a larger scale. Daily, weekly or even higher timeframes can be tested.
Test this strategy on different cryptocurrency products and select the best performing ones.
Summary
This smart quantitative bottom reversal trading strategy identifies potential short-term bottoms by using the adaptive RSI indicator and multi-timeframe technology. Its reversal nature enables excessive profits in uncertain market conditions, while also being able to follow clear trends. With continuous optimizations, this strategy has the potential to generate more reliable trading signals and achieve long-term steady profits.
Parameters
| Name | Default | What it controls |
|---|---|---|
| v_input_1 | 0 | Strategy Direction: long | short | all |
| v_input_2 | 10 | min |
| v_input_3 | 60 | tf3 |
| v_input_4 | true | min1 |
| v_input_5 | 0 | Timeframe: 60 | 5 | 15 | 30 | 1 | 120 | 240 | 360 | 720 | D | W |
| v_input_6 | 24 | Period |
| v_input_7 | true | Shift |
| v_input_8 | 25 | len |
| v_input_9 | 10 | stop loss |
| v_input_10 | 25 | qty_percent1 |
| v_input_11 | 25 | qty_percent2 |
| v_input_12 | 25 | qty_percent3 |
| v_input_13 | true | Take profit1 |
| v_input_14 | 2 | Take profit2 |
| v_input_15 | 3 | Take profit3 |
| v_input_16 | 5 | Take profit4 |
Source Pine Script
/*backtest
start: 2023-11-07 00:00:00
end: 2023-12-07 00:00:00
period: 4h
basePeriod: 15m
exchanges: [{"eid":"Futures_Binance","currency":"BTC_USDT"}]
*/

// © theCrypster 2020

//@version=4
strategy(title = "Low Scanner strategy crypto", overlay = false, pyramiding=1,initial_capital = 1000, default_qty_type= strategy.percent_of_equity, default_qty_value = 100, calc_on_order_fills=false, slippage=0,commission_type=strategy.commission.percent,commission_value=0.075)
strat_dir_input = input(title="Strategy Direction", defval="long", options=["long", "short", "all"])
strat_dir_value = strat_dir_input == "long" ? strategy.direction.long : strat_dir_input == "short" ? strategy.direction.short : strategy.direction.all
strategy.risk.allow_entry_in(strat_dir_value)
leng=1
p1=close[1]
min=input(10)
len55 = timeframe.isintraday and timeframe.multiplier >= 1 ?
   min / timeframe.multiplier * 7 :
   timeframe.isintraday and timeframe.multiplier < 60 ?
   60 / timeframe.multiplier * 24 * 7 : 7
//taken from https://www.tradingview.com/script/Ql1FjjfX-security-free-MTF-example-JD/
tf3 = input("60", type=input.resolution)
ti = change( time(tf3) ) != 0
T_c = fixnan( ti ? close : na )

vrsi = rsi(cum(change(T_c) * volume), leng)
pp=wma(vrsi,len55)

d=(vrsi[1]-pp[1])
min1 =input(1)
len100 = timeframe.isintraday and timeframe.multiplier >= 1 ?
   min1 / timeframe.multiplier * 7 :
   timeframe.isintraday and timeframe.multiplier < 60 ?
   60 / timeframe.multiplier * 24 * 7 : 7
x=ema(d,len100)
//
zx=x/-1
col=zx > 0? color.lime : color.orange
plot(zx,color=col,linewidth=1)
//

tf10 = input("60", title = "Timeframe", type = input.resolution, options = ["1", "5", "15", "30", "60","120", "240","360","720", "D", "W"])

length = input(24, title = "Period", type = input.integer)
shift = input(1, title = "Shift", type = input.integer)

hma(_src, _length)=>
    wma((2 * wma(_src, _length / 2)) - wma(_src, _length), round(sqrt(_length)))

hma3(_src, _length)=>
    p = length/2
    wma(wma(close,p/3)*3 - wma(close,p/2) - wma(close,p),p)


a = security(syminfo.tickerid, tf10, hma(close, length))
b =security(syminfo.tickerid, tf10, hma3(close[1], length)[shift])
//plot(a,color=color.gray)
//plot(b,color=color.yellow)
close_price = close[0]
len = input(25)

linear_reg = linreg(close_price, len, 0)


//plot(linear_reg, color=color.blue, title="LR", linewidth=3)

buy=crossover(linear_reg, b)
sell=crossunder(linear_reg, b)
//
l = crossover(zx,0) or buy

if l
    strategy.entry("buy", strategy.long)

per(pcnt) =>
    strategy.position_size != 0 ? round(pcnt / 100 * strategy.position_avg_price / syminfo.mintick) : float(na)
stoploss=input(title=" stop loss", defval=10, minval=0.01)
los = per(stoploss)
q1=input(title=" qty_percent1", defval=25, minval=1)
q2=input(title=" qty_percent2", defval=25, minval=1)
q3=input(title=" qty_percent3", defval=25, minval=1)
tp1=input(title=" Take profit1", defval=1, minval=0.01)
tp2=input(title=" Take profit2", defval=2, minval=0.01)
tp3=input(title=" Take profit3", defval=3, minval=0.01)
tp4=input(title=" Take profit4", defval=5, minval=0.01)
strategy.exit("x1", qty_percent = q1, profit = per(tp1), loss = los)
strategy.exit("x2", qty_percent = q2, profit = per(tp2), loss = los)
strategy.exit("x3", qty_percent = q3, profit = per(tp3), loss = los)
strategy.exit("x4", profit = per(tp4), loss = los)
Published by ChaoZhang on the FMZ strategy square · last modified 2023-12-08. Collected in the Quant Trading Vault. Unvalidated research: re-test with your own data and costs before trusting it.
Build this with AgenKit
A spec is not a trading system. Paste this into your coding agent and AgenKit runs a specialist team — architecture, test-first build, risk gates, review — with paper trading on by default.
/agenkit build a production-grade trading bot with a backtest engine, risk controls and paper trading by default from strategies/Smart-Quantitative-Bottom-Reversal-Trading-Strategy.md- npx agenkit install engineering-kit in your project
- Paste the command into your agent and approve each phase
- Get tests, backtest, risk controls and a paper-trading switch
Understand it first
Before you run this, read the lesson behind the idea and how to backtest it honestly. Specs like this one are the survivors of an unknown number of trials; deflate their results accordingly.
Related specs
- ATR and EMA based Dynamic Take Profit and Stop Loss Adaptive StrategyPine Script · Mean reversion · 1h
- Advanced 15 Minute Chart Trading Signal StrategyPine Script · Mean reversion · 3h
- Advanced Momentum EMA Trend Following with RSI Overbought Oversold Trading StrategyPine Script · Mean reversion · 1d
- Advanced Quantitative Trading Strategy Combining RSI Divergence and Moving AveragesPine Script · Mean reversion · 1h
- BONK Multi Factor Trading StrategyPine Script · Mean reversion · 1d
- Chaikin Oscillator StrategyPine Script · Mean reversion · 3h