Smooth Volatility Band Strategy
This strategy generates price bands based on the smoothed volatility of price, and produces trading signals when price breaks through the bands.
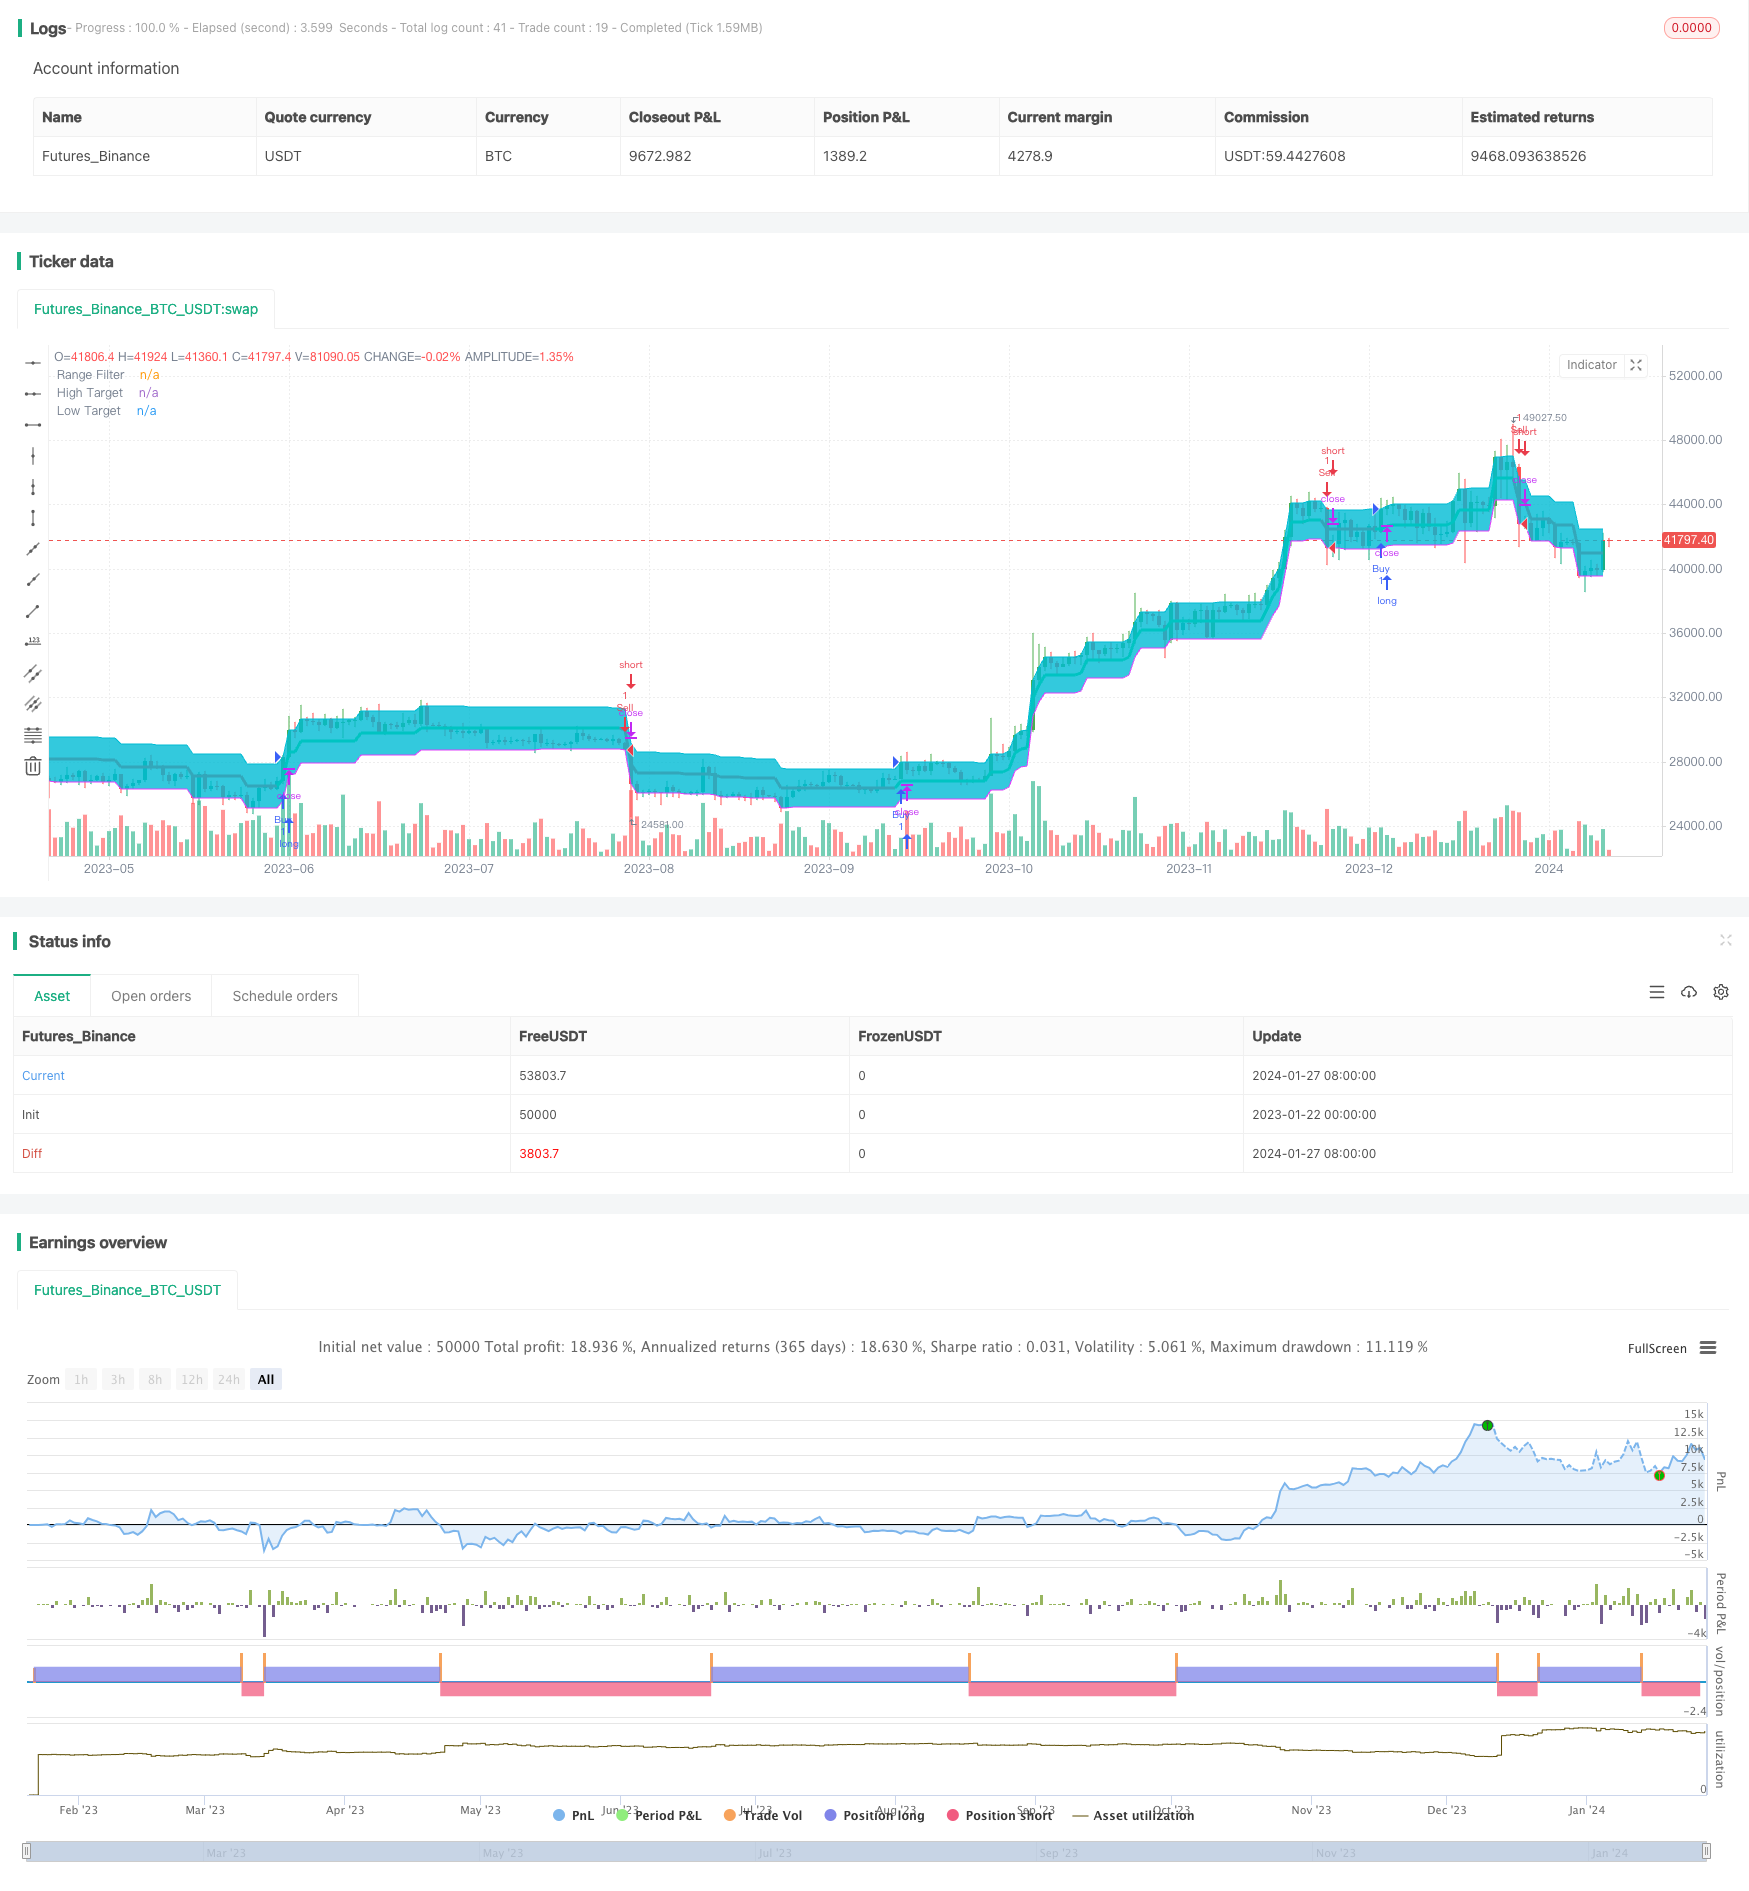
Overview
This strategy generates price bands based on the smoothed volatility of price, and produces trading signals when price breaks through the bands.
Strategy Logic
The strategy first calculates the average volatility range of price over a certain period, then smoothes the volatility range using an exponential moving average to generate smoothed volatility. The smoothed volatility multiplied by a coefficient gives the range of the bands. When price breaks above the upper band, a buy signal is generated. When price breaks below the lower band, a sell signal is generated.
Specifically, the smoothed volatility smrng is calculated by the smoothrng function. The upper band hband and lower band lband of the price bands are then calculated based on smrng. The long condition longCondition and short condition shortCondition are set up based on that. When longCondition is met, a buy signal is generated. When shortCondition is met, a sell signal is generated.
Advantage Analysis
The advantages of this strategy are:
Using price volatility to construct trading signals can effectively track market changes.
Smoothing volatility with exponential moving average can filter noise and generate more reliable trading signals.
The range of bands can be adjusted through the volatility coefficient, making the strategy more flexible.
Combined with breakout judgment, it can capture trading opportunities timely when trend reversal occurs.
Risk Analysis
There are also some risks in this strategy:
In abnormal market volatility, the smoothed volatility may fail to accurately reflect the actual volatility, leading to wrong signals. Parameters can be optimized to improve the model.
Improper band range setting may lead to overtrading or insufficient signals. Different parameters can be tested to find the optimal range.
There is time lag in breakout signals, which may cause premature entry or late entry. Other indicators can be introduced for confirmation.
Optimization Directions
The strategy can be optimized through:
Testing different price data cycles to find the most appropriate period for calculating volatility.
Trying different moving average algorithms like weighted moving average.
Introducing trading volume or other indicators to confirm breakout signals.
Setting stop loss or trailing stop to control losses per trade.
Optimizing the volatility coefficient mult to determine optimal band range.
Summary
The overall logic of this strategy is clear, using price volatility to construct bands and price breakouts to generate trading signals, which can effectively track market trend changes. But there is room for improvement via parameter optimization, signal confirmation etc to make strategy more robust.
Parameters
| Name | Default | What it controls |
|---|---|---|
| v_input_1_close | 0 | Source: close | high | low | open | hl2 | hlc3 | hlcc4 | ohlc4 |
| v_input_2 | 100 | Sampling Period |
| v_input_3 | 3 | Range Multiplier |
Source Pine Script
/*backtest
start: 2023-01-22 00:00:00
end: 2024-01-28 00:00:00
period: 1d
basePeriod: 1h
exchanges: [{"eid":"Futures_Binance","currency":"BTC_USDT"}]
*/

//@version=4
strategy("1SmSm1 Strategy", shorttitle="1SmSm1", overlay=true)

// Source
src = input(defval=close, title="Source")

// Sampling Period
per = input(defval=100, minval=1, title="Sampling Period")

// Range Multiplier
mult = input(defval=3.0, minval=0.1, title="Range Multiplier")

// Smooth Average Range
smoothrng(x, t, m) =>
    wper = (t * 2) - 1
    avrng = ema(abs(x - x[1]), t)
    smoothrng = ema(avrng, wper) * m
    smoothrng

smrng = smoothrng(src, per, mult)

// Range Filter
rngfilt(x, r) =>
    rngfilt = x
    rngfilt := x > nz(rngfilt[1]) ? ((x - r) < nz(rngfilt[1]) ? nz(rngfilt[1]) : (x - r)) : ((x + r) > nz(rngfilt[1]) ? nz(rngfilt[1]) : (x + r))
    rngfilt

filt = rngfilt(src, smrng)

// Filter Direction
upward = 0.0
upward := filt > filt[1] ? nz(upward[1]) + 1 : filt < filt[1] ? 0 : nz(upward[1])

downward = 0.0
downward := filt < filt[1] ? nz(downward[1]) + 1 : filt > filt[1] ? 0 : nz(downward[1])

// Target Bands
hband = filt + smrng
lband = filt - smrng

// Breakouts
longCondition = (src > filt) and (src > src[1]) and (upward > 0)
shortCondition = (src < filt) and (src < src[1]) and (downward > 0)

strategy.entry("Buy", strategy.long, when = longCondition)
strategy.entry("Sell", strategy.short, when = shortCondition)

// Plotting
plot(filt, color=upward > 0 ? color.lime : downward > 0 ? color.red : color.orange, linewidth=3, title="Range Filter")
hbandplot = plot(hband, color=color.aqua, transp=100, title="High Target")
lbandplot = plot(lband, color=color.fuchsia, transp=100, title="Low Target")

// Fills
fill(hbandplot, lbandplot, color=color.aqua, title="Target Range")

// Bar Color
barcolor(longCondition ? color.green : shortCondition ? color.red : na)

// Alerts
alertcondition(longCondition, title="Buy Alert", message="BUY")
alertcondition(shortCondition, title="Sell Alert", message="SELL")Published by ChaoZhang on the FMZ strategy square · last modified 2024-01-29. Collected in the Quant Trading Vault. Unvalidated research: re-test with your own data and costs before trusting it.
Build this with AgenKit
A spec is not a trading system. Paste this into your coding agent and AgenKit runs a specialist team — architecture, test-first build, risk gates, review — with paper trading on by default.
/agenkit build a production-grade trading bot with a backtest engine, risk controls and paper trading by default from strategies/Smooth-Volatility-Band-Strategy.md- npx agenkit install engineering-kit in your project
- Paste the command into your agent and approve each phase
- Get tests, backtest, risk controls and a paper-trading switch
Understand it first
Before you run this, read the lesson behind the idea and how to backtest it honestly. Specs like this one are the survivors of an unknown number of trials; deflate their results accordingly.
Related specs
- Dual EMA Volatility Adaptive Trading Strategy with Multi Tiered Profit Optimization SystemPine Script · Volatility · 1d
- Dual Moving Average Volatility Tracking StrategyPine Script · Volatility · 1h
- Multi Indicator Volatility Trading RSI EMA ATR StrategyPine Script · Volatility · 3m
- Quantitative Trading Strategy Based on Double EMA and Price Volatility IndexPine Script · Volatility · 1h
- Dynamic Volatility Trading System Multi Timeframe Nested Technical Indicator Strategy with Extreme Market Condition Monitoring for FuturesPine Script · Volatility · 1h
- Advanced Dual EMA Strategy with ATR Volatility Filter SystemPine Script · Volatility · 1d