Squeeze Momentum Breakout Strategy
This is a quantitative trading strategy developed based on LazyBear's Momentum Squeeze indicator. The strategy integrates Bollinger Bands, Keltner Channels, and momentum indicators to achieve high-win-rate momentum…
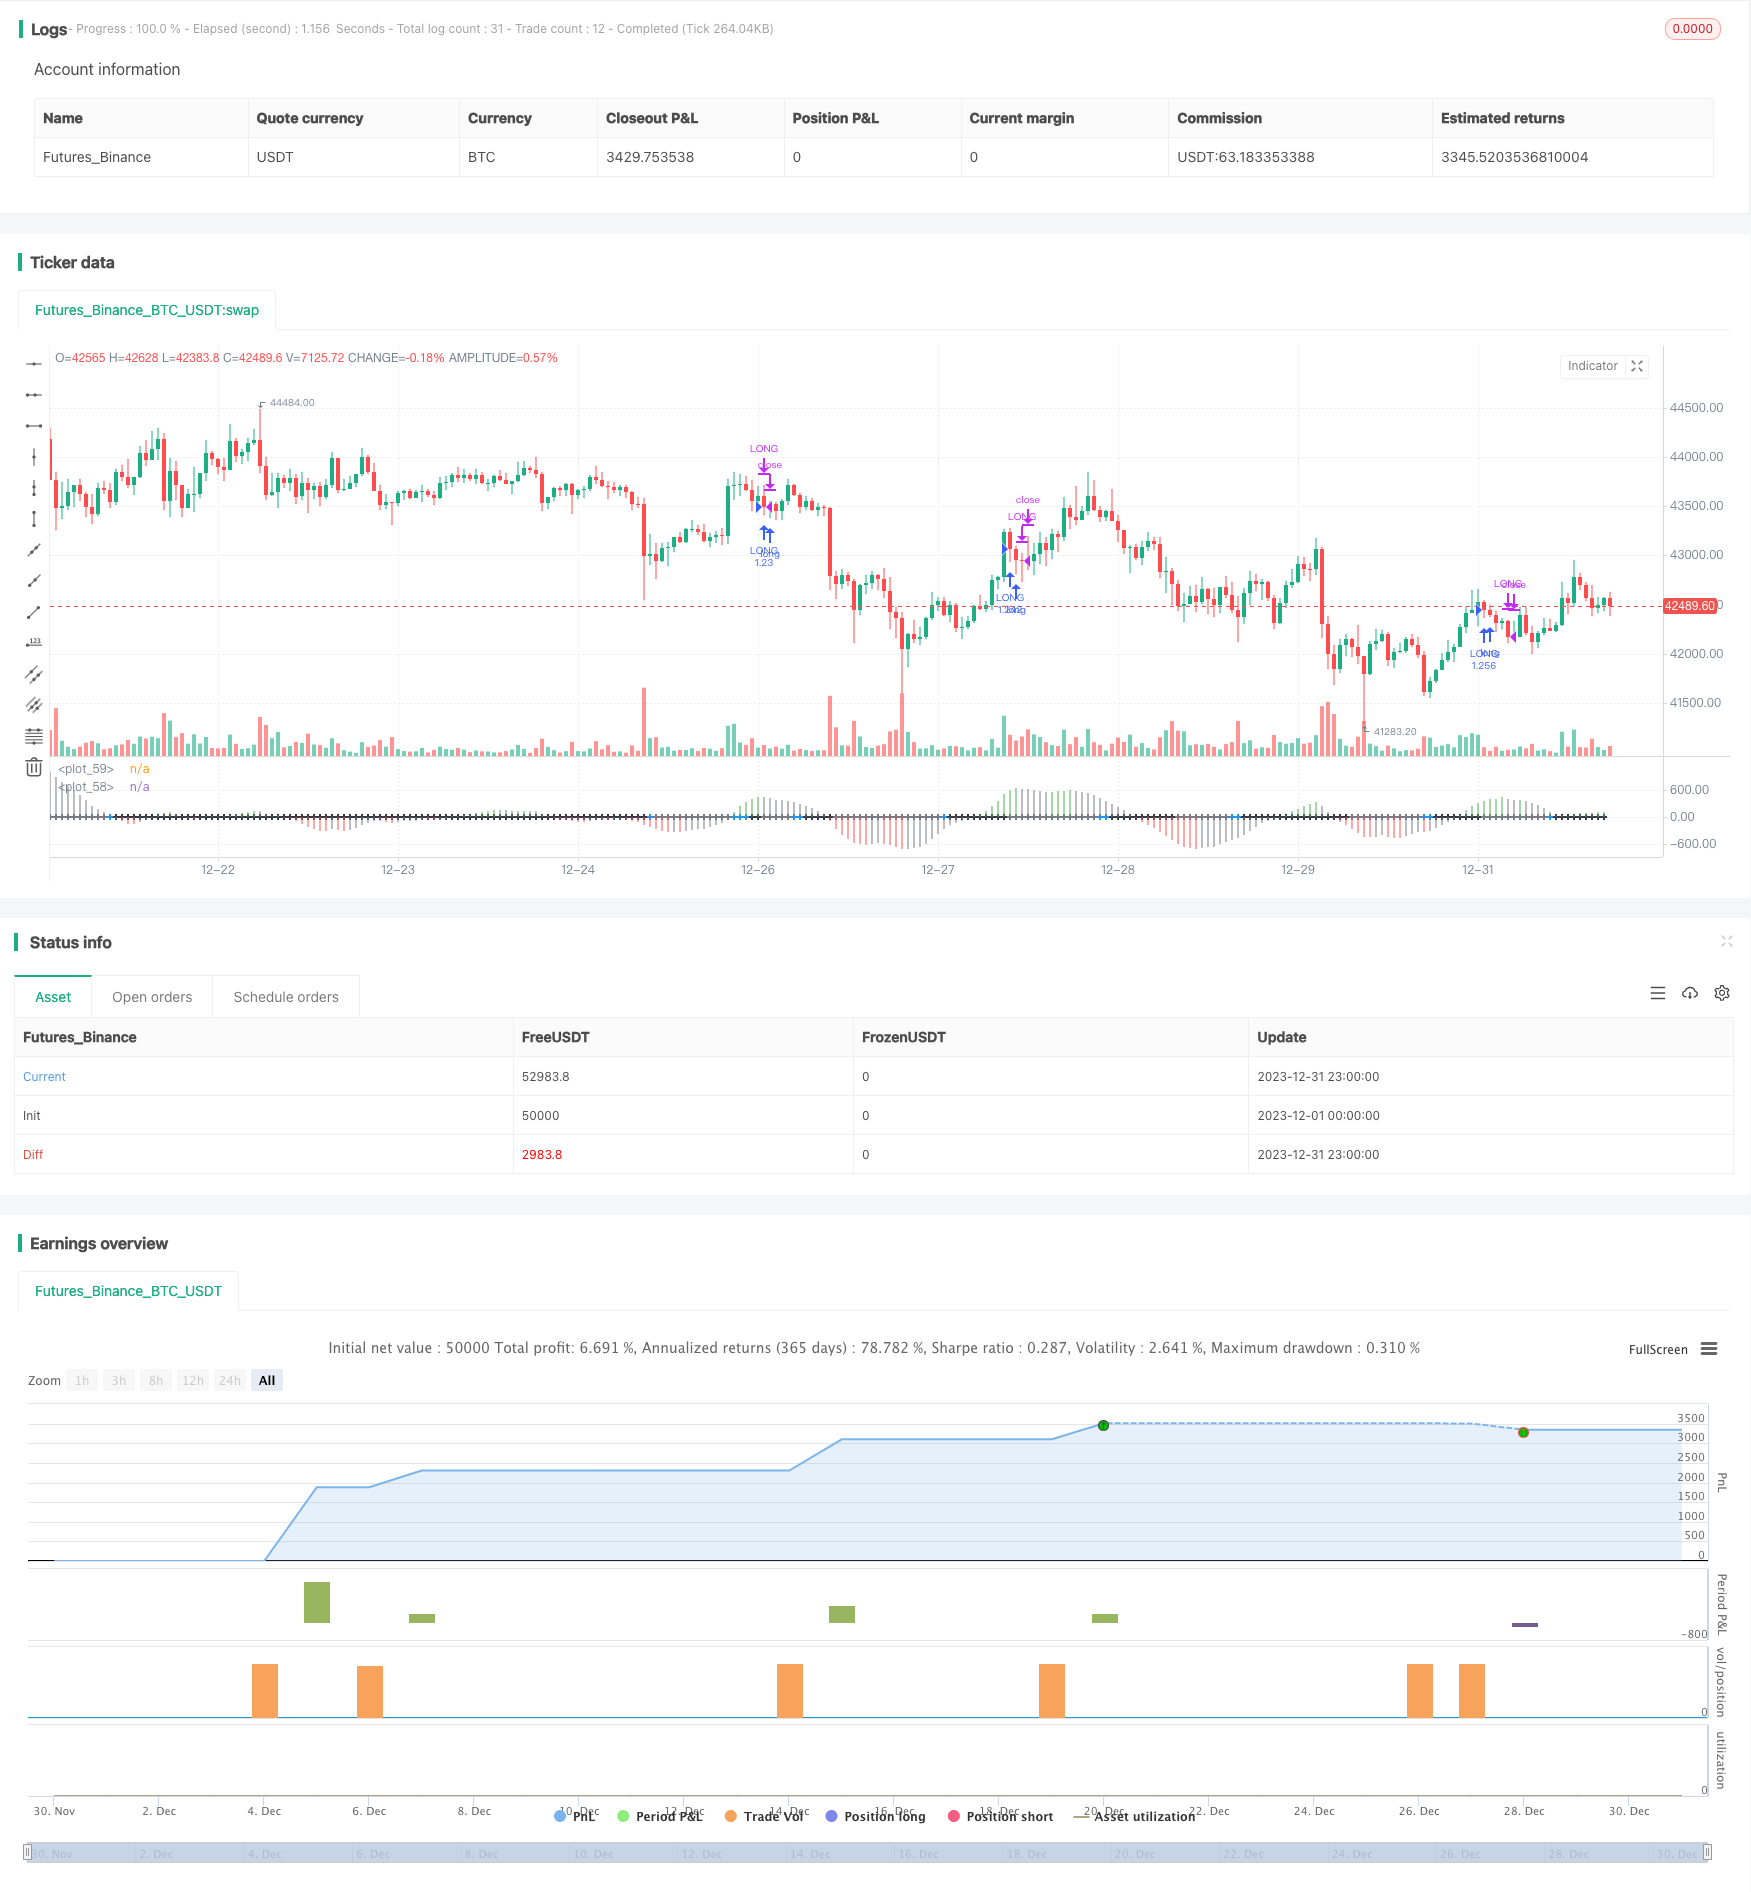
Overview
This is a quantitative trading strategy developed based on LazyBear's Momentum Squeeze indicator. The strategy integrates Bollinger Bands, Keltner Channels, and momentum indicators to achieve high-win-rate momentum breakout trading through the combination of multiple technical indicators.
Strategy Logic
The core indicator of this strategy is LazyBear's Momentum Squeeze indicator. This indicator determines if the Bollinger Bands are being "squeezed" by the Keltner Channels. When the squeeze occurs, it represents that the market has entered a potential outbreak point. By combining the direction of the momentum indicator, trades can be taken when the squeeze releases to capture the market outbreak.
Specifically, the strategy first calculates the 21-period Bollinger Bands, with a width of 2 standard deviations of the price. At the same time, it calculates the 20-period Keltner Channels, with a width of 1.5 times the price amplitude. When the Bollinger Bands are "squeezed" by the Keltner Channels, a squeeze signal is triggered. In addition, the strategy also calculates the momentum of the price relative to the mid-point of its own price channel over a period of time. When a squeeze occurs, combined with the directionality of the momentum indicator, it determines whether to buy or sell.
For exits, when the color of the momentum indicator changes to gray, it represents that the squeeze state has ended and the trend may reverse.
Advantages
- Integrates multiple technical indicators to improve accuracy
By judging the overall relationship between these indicators, the accuracy of trading decisions can be improved and the probability of erroneous trades reduced.
- Accurate momentum squeeze points with large profit potential
The momentum squeeze strategy can capture key points where the market is likely to outbreak. These points are often inflection points where the market makes important directional judgments. If judged correctly, the subsequent market movement will be relatively long, so the potential profit space of the strategy is great.
- Achieve high-success-rate breakout trading
Compared to random breakout trading, the entry point selected by this strategy is at the squeeze point between Bollinger Bands and Keltner Channels. Through the integrated indicator judgement, the trading success rate is very high.
Risks
- Risk of improper parameter settings
The cycle parameters and bandwidth parameters of the Bollinger Bands and Keltner Channels have a great impact on the trading results. If the parameters are set inappropriately, misjudgements may occur. This requires finding the optimal parameters through a lot of backtesting.
- Breakout failure risk
There is always a risk that the price may retrace after breaking through the point selected by this strategy, causing a loss. This needs to be strictly stopped out to control losses.
- Trend reversal risk
When the squeeze state ends, this strategy will close all positions. However, sometimes the price trend may still continue, which poses the risk of premature exit. The exit logic needs to be optimized.
Optimization Directions
- Optimize parameter settings
Through more backtesting data tryouts, better cycle and bandwidth parameter settings can be found to improve strategy performance.
- Add stop loss strategy
Set moving or oscillating stops to quickly cut losses when prices reverse.
- Add re-entry conditions
When the strategy exits positions, certain re-entry conditions can be set to re-enter the market if the trend continues.
- Incorporate more indicators
Try to incorporate more indicators of different types, such as other volatility indicators, volume indicators, etc., to establish a composite strategy of indicator integration, so as to improve the accuracy of decisions.
Summary
The strategy integrates Bollinger Bands, Keltner Channels and momentum indicators. By judging the relationships between these indicators, it enters at high success rate breakout points. There are optimization spaces in many aspects such as parameter optimization, stop loss strategies, re-entry conditions, and composite indicator integration to further improve strategy performance.
Parameters
| Name | Default | What it controls |
|---|---|---|
| v_input_1 | 4 | From Month |
| v_input_2 | 2020 | From Year |
| v_input_3 | true | To Month |
| v_input_4 | 9999 | To Year |
| v_input_5 | true | Trade - Leverage |
| v_input_6 | 100 | Trade - Risk Percent |
| v_input_7 | 0 | What trades should be taken : : LONG | SHORT | BOTH |
| v_input_8 | 21 | BB Length |
| v_input_9 | 2 | BB MultFactor |
| v_input_10 | 20 | KC Length |
| v_input_11 | 1.5 | KC MultFactor |
| v_input_12 | true | Use TrueRange (KC) |
| v_input_13 | false | Use VWMA to selectively long/short? |
| v_input_14 | 42 | VWMA Length |
| v_input_15 | false | Use Cumulative Volume for VWMA? |
Source Pine Script
/*backtest
start: 2023-12-01 00:00:00
end: 2023-12-31 23:59:59
period: 1h
basePeriod: 15m
exchanges: [{"eid":"Futures_Binance","currency":"BTC_USDT"}]
*/

//@version=4
//All credits to LazyBear. All I did was turn it into a strategy!

strategy(title = "SQZMOM STRAT", overlay=false)

// --- GENERAL INPUTS ---
FromMonth = input(defval = 4, title = "From Month", minval = 1, maxval = 12)
FromYear  = input(defval = 2020, title = "From Year", minval = 2012)
ToMonth   = input(defval = 1, title = "To Month", minval = 1, maxval = 12)
ToYear    = input(defval = 9999, title = "To Year", minval = 2017)
FromDay   = 1
ToDay     = 1
start     = timestamp(FromYear, FromMonth, FromDay, 00, 00)  // backtest start window
finish    = timestamp(ToYear, ToMonth, ToDay, 23, 59)        // backtest finish window
window()  => true

get_round(value, precision) => round(value * (pow(10, precision))) / pow(10, precision)
trade_leverage = input(1, title = "Trade - Leverage", step = 0.25)
trade_risk     = input(100, title = "Trade - Risk Percent", type = input.float, step = 0.1, minval = 0.1, maxval = 100)
tradeType   = input("LONG", title="What trades should be taken : ", options=["LONG", "SHORT", "BOTH"])

// --- SQZMOM CODE

length = input(21, title="BB Length")
mult = input(2.0,title="BB MultFactor")
lengthKC=input(20, title="KC Length")
multKC = input(1.5, title="KC MultFactor")

useTrueRange = input(true, title="Use TrueRange (KC)", type=input.bool)

// Calculate BB
source = close
basis = sma(source, length)
dev = multKC * stdev(source, length)
upperBB = basis + dev
lowerBB = basis - dev

// Calculate KC
ma = sma(source, lengthKC)
range = useTrueRange ? tr : (high - low)
rangema = sma(range, lengthKC)
upperKC = ma + rangema * multKC
lowerKC = ma - rangema * multKC

sqzOn  = (lowerBB > lowerKC) and (upperBB < upperKC)
sqzOff = (lowerBB < lowerKC) and (upperBB > upperKC)
noSqz  = (sqzOn == false) and (sqzOff == false)

val = linreg(source  -  avg(avg(highest(high, lengthKC), lowest(low, lengthKC)),sma(close,lengthKC)), lengthKC,0)

bcolor = color.gray
if (val > 0 and val > nz(val[1]))
    bcolor := color.green
if (val < 0 and val < nz(val[1]))
    bcolor := color.red

scolor = noSqz ? color.blue : sqzOn ? color.black : color.gray
plot(val, color=bcolor, style=plot.style_histogram, linewidth=4)
plot(0, color=scolor, style=plot.style_cross, linewidth=2)

// --- VWMA CODE ---
useVWMA        = input(false, title = "Use VWMA to selectively long/short?", type = input.bool)
lengthVWMA=input(42, title = "VWMA Length", step = 1, minval = 1)
useCV=input(false, type=input.bool, title="Use Cumulative Volume for VWMA?")
nbfs = useCV ? cum(volume) : sum(volume, lengthVWMA)
medianSrc=close

calc_evwma(price, lengthVWMA, nb_floating_shares) => data = (nz(close[1]) * (nb_floating_shares - volume)/nb_floating_shares) + (volume*price/nb_floating_shares)

m=calc_evwma(medianSrc, lengthVWMA, nbfs)


// ---STRATEGY---
if ((tradeType == "LONG" or tradeType == "BOTH") and (m>0 or useVWMA == false))
    longCondition = (val > 0 and noSqz == 0 and sqzOn == 0 and sqzOn[1] == 1)
    if (longCondition)
        contracts = get_round((strategy.equity * trade_leverage / close) * (trade_risk / 100), 4)
        strategy.entry("LONG", strategy.long, qty = contracts, when = window())

if((tradeType == "SHORT" or tradeType == "BOTH") and (m<0 or useVWMA == false))
    shortCondition = (val < 0 and noSqz == 0 and sqzOn == 0 and sqzOn[1] == 1)
    if (shortCondition)
        contracts = get_round((strategy.equity * trade_leverage / close) * (trade_risk / 100), 4)
        strategy.entry("SHORT", strategy.short, qty = contracts, when = window())

if (bcolor == color.gray)
    strategy.close("LONG")
strategy.close("SHORT")Published by ChaoZhang on the FMZ strategy square · last modified 2024-01-30. Collected in the Quant Trading Vault. Unvalidated research: re-test with your own data and costs before trusting it.
Build this with AgenKit
A spec is not a trading system. Paste this into your coding agent and AgenKit runs a specialist team — architecture, test-first build, risk gates, review — with paper trading on by default.
/agenkit build a production-grade trading bot with a backtest engine, risk controls and paper trading by default from strategies/Squeeze-Momentum-Breakout-Strategy.md- npx agenkit install engineering-kit in your project
- Paste the command into your agent and approve each phase
- Get tests, backtest, risk controls and a paper-trading switch
Understand it first
Before you run this, read the lesson behind the idea and how to backtest it honestly. Specs like this one are the survivors of an unknown number of trials; deflate their results accordingly.
Related specs
- Momentum Breakthrough TTM StrategyPine Script · Breakout · 1d
- Dual MA Indicator Oscillating Price Tracking StrategyPine Script · Breakout · 2h
- MACD Bollinger Turtle Trading StrategyPine Script · Breakout · 1d
- Triple Indicators Sentiment Driven Breakout StrategyPine Script · Breakout · 1h
- Dual Channel Breakout StrategyPine Script · Breakout · 1d
- Trading Psychology Balancing StrategyPine Script · Breakout · 1h