Strategy vault / Mean reversion
Statistical Deviation Based Market Extreme Drawdown Strategy
This strategy is based on the statistical characteristics of extreme market downturns. By analyzing drawdowns statistically and using standard deviations to measure market volatility extremes, it initiates buying…
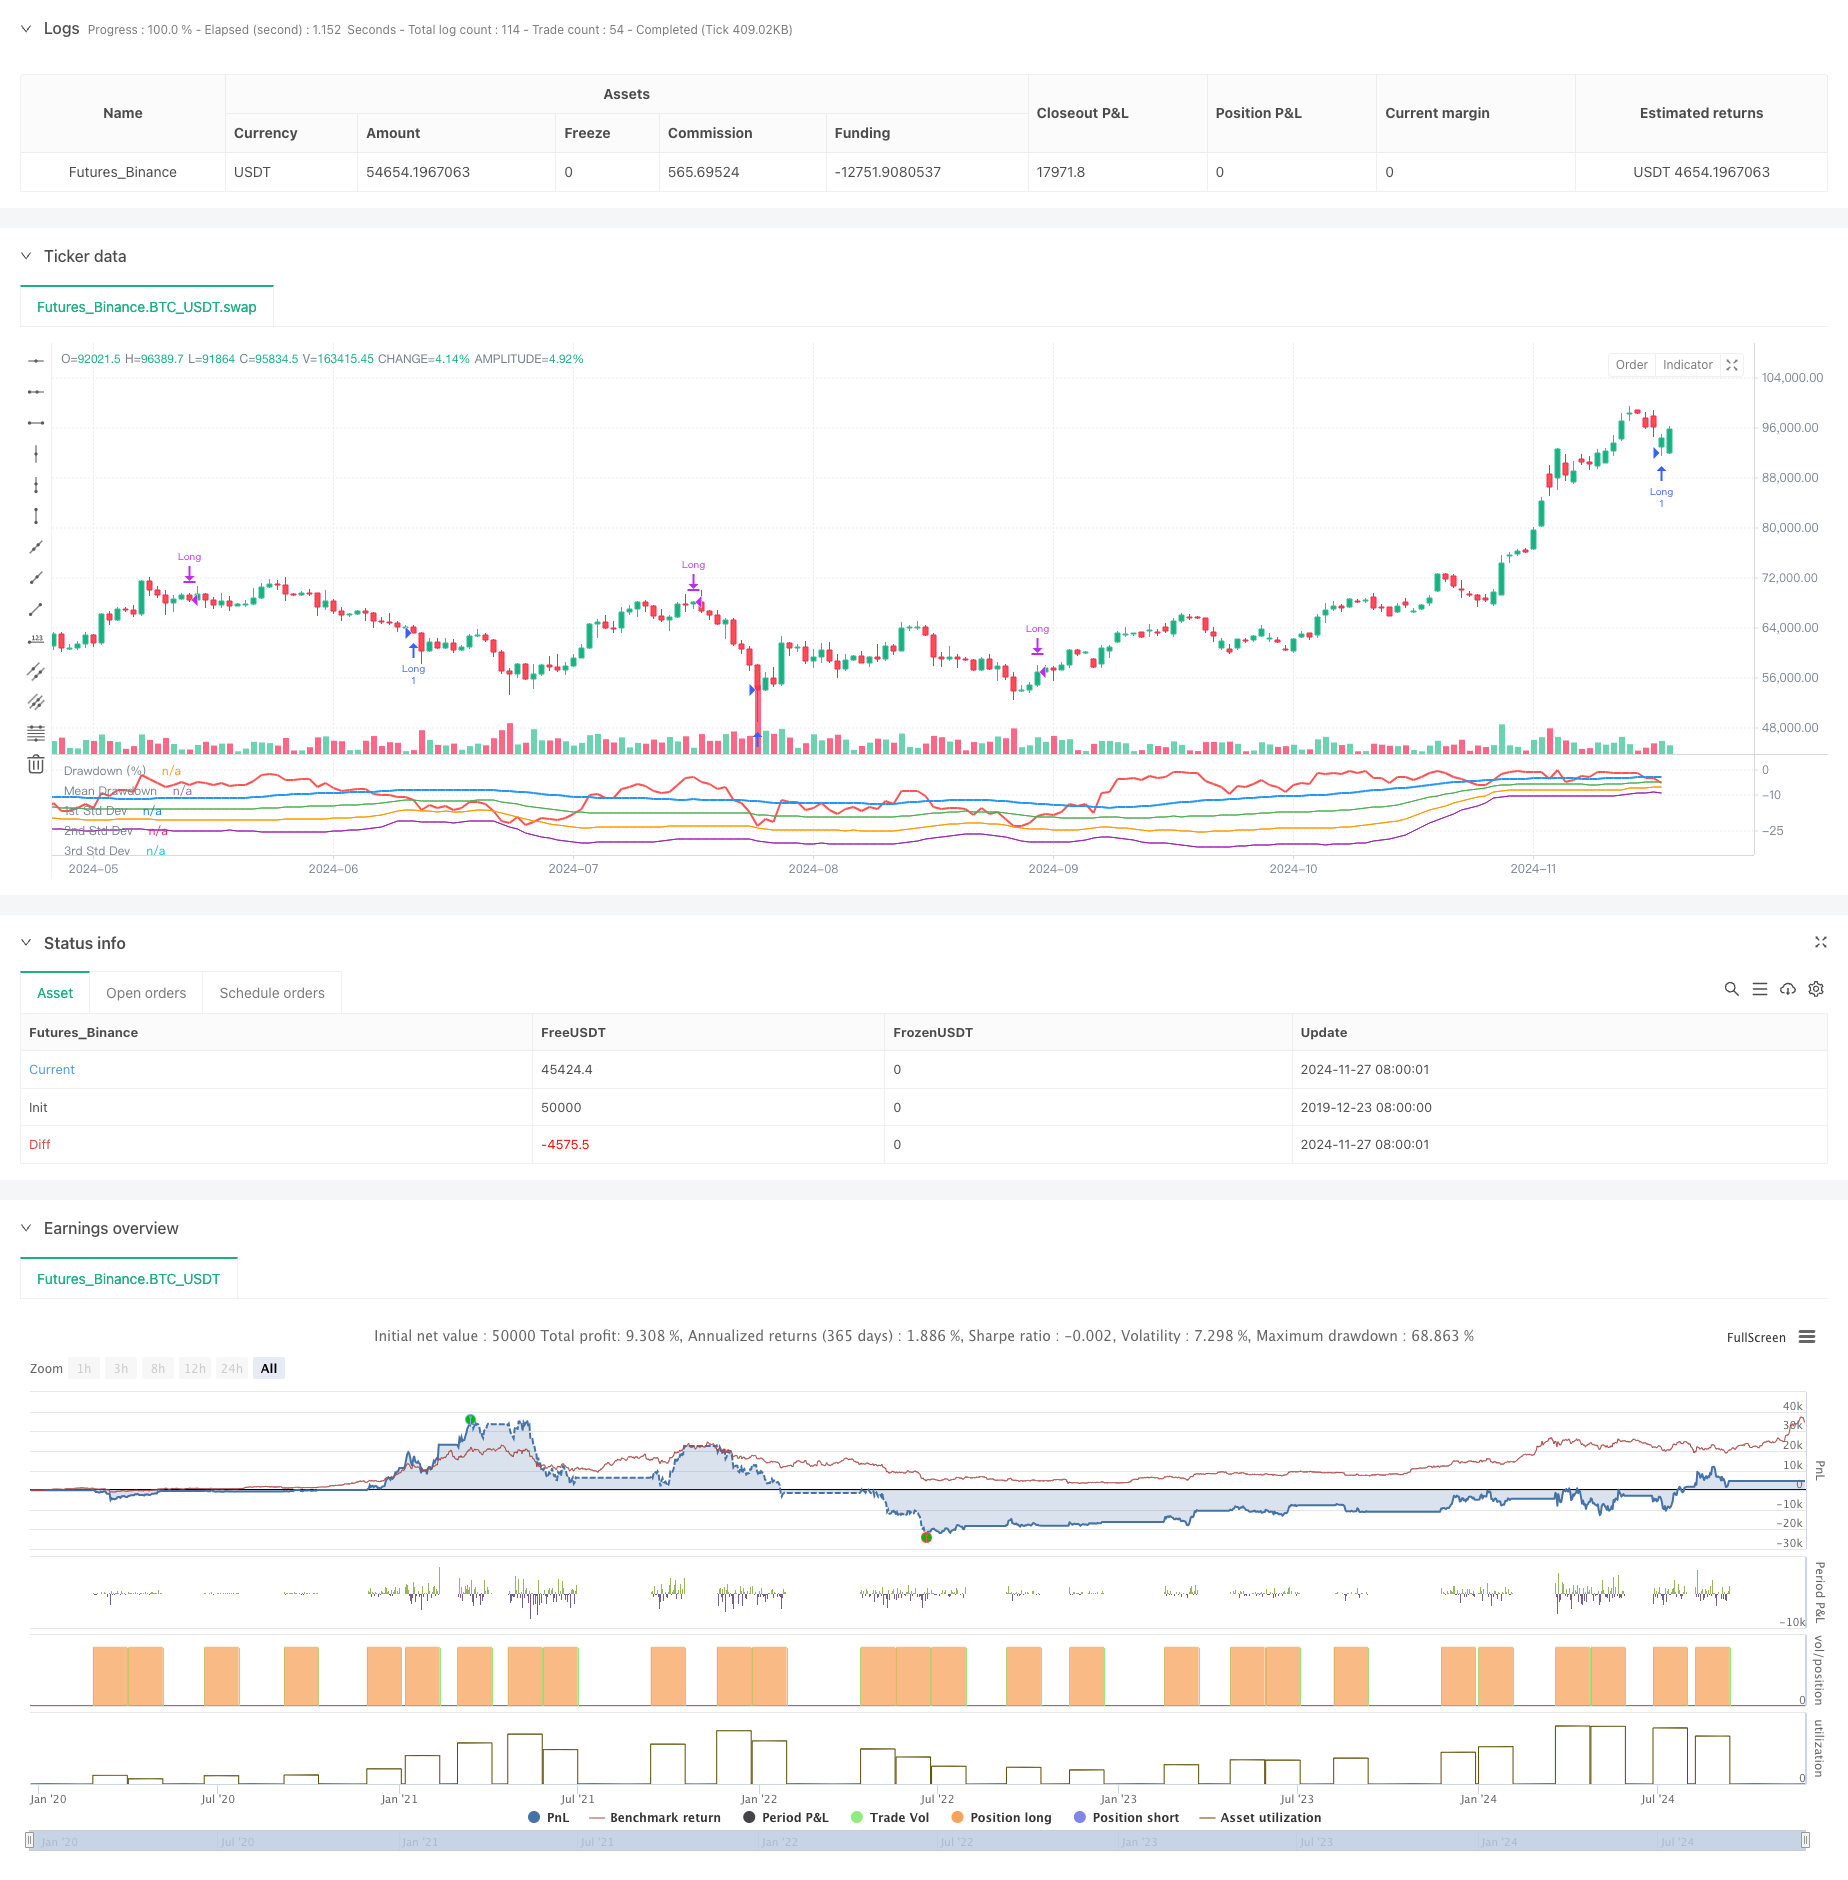
Overview
This strategy is based on the statistical characteristics of extreme market downturns. By analyzing drawdowns statistically and using standard deviations to measure market volatility extremes, it initiates buying positions when market declines exceed normal ranges. The core idea is to capture oversold opportunities caused by market panic, identifying investment opportunities through mathematical statistical methods that arise from market irrationality.
Strategy Principle
The strategy employs a rolling time window to calculate price maximum drawdowns and their statistical characteristics. It first calculates the highest price over the past 50 periods, then computes the drawdown percentage of current closing price relative to the highest price. It then calculates the mean and standard deviation of drawdowns, setting -1 standard deviation as the trigger threshold. When market drawdown exceeds the mean minus a set multiple of standard deviations, indicating potential oversold conditions, a long position is entered. Positions are automatically closed after 35 periods. The strategy also plots drawdown curves and one, two, and three standard deviation levels for visual assessment of market oversold conditions.
Strategy Advantages
- The strategy is based on statistical principles with solid theoretical foundation. Using standard deviation to measure market volatility extremes is objective and scientific.
- Effectively captures investment opportunities during market panic periods. Entering positions during irrational market declines aligns with value investing principles.
- Fixed-period position closure avoids missing rebounds that might occur with trailing stops.
- Highly adjustable parameters allow flexibility for different market environments and trading instruments.
- Simple calculation of drawdown and standard deviation indicators makes the strategy logic clear and easy to understand and execute.
Strategy Risks
- Markets may experience continuous decline, leading to frequent losing entries. Consider setting maximum position limits.
- Fixed-period exits may miss larger upside potential. Consider adding trend-following exit methods.
- Drawdown statistical characteristics may change with market conditions. Consider regular parameter updates.
- Strategy doesn't consider volume and other market information. Consider cross-validation with multiple indicators.
- Standard deviation may become unreliable in highly volatile markets. Consider implementing risk control measures.
Optimization Directions
- Incorporate volume indicators to confirm market panic levels.
- Add trend indicators to avoid frequent entries in downtrends.
- Optimize exit mechanism with dynamic holding period adjustments based on market performance.
- Add stop-loss settings to control single-trade risk.
- Consider using adaptive parameters to improve strategy adaptation to market changes.
Summary
This strategy captures market oversold opportunities through statistical methods, with strong theoretical foundation and practical value. The strategy logic is simple and clear with adjustable parameters, suitable as a base strategy for expansion and optimization. Strategy stability and profitability can be further enhanced by adding technical indicators and risk control measures. In live trading, carefully set parameters considering market conditions and trading instrument characteristics, while maintaining proper risk control.
Source Pine Script
/*backtest
start: 2019-12-23 08:00:00
end: 2024-11-28 00:00:00
period: 1d
basePeriod: 1d
exchanges: [{"eid":"Futures_Binance","currency":"BTC_USDT"}]
*/

//@version=5
strategy("Buy When There's Blood in the Streets Strategy", overlay=false, shorttitle="BloodInTheStreets")


//This strategy identifies opportunities to buy during extreme market drawdowns based on standard deviation thresholds.
//It calculates the maximum drawdown over a user-defined lookback period, identifies extreme deviations from the mean,
//and triggers long entries when specific conditions are met. The position is exited after a defined number of bars.


// User Inputs
lookbackPeriod = input.int(50, title="Lookback Period", minval=1, tooltip="Period to calculate the highest high for drawdown")
stdDevLength = input.int(50, title="Standard Deviation Length", minval=1, tooltip="Length of the period to calculate standard deviation")
stdDevThreshold = input.float(-1.0, title="Standard Deviation Threshold", tooltip="Trigger level for long entry based on deviations")
exitBars = input.int(35, title="Exit After (Bars)", minval=1, tooltip="Number of bars after which to exit the trade")

// Drawdown Calculation
peakHigh = ta.highest(high, lookbackPeriod)
drawdown = ((close - peakHigh) / peakHigh) * 100

// Standard Deviation Calculation
drawdownStdDev = ta.stdev(drawdown, stdDevLength)
meanDrawdown = ta.sma(drawdown, stdDevLength)

// Define Standard Deviation Levels
stdDev1 = meanDrawdown - drawdownStdDev
stdDev2 = meanDrawdown - 2 * drawdownStdDev
stdDev3 = meanDrawdown - 3 * drawdownStdDev

// Plot Drawdown and Levels
plot(drawdown, color=color.red, linewidth=2, title="Drawdown (%)")
plot(meanDrawdown, color=color.blue, linewidth=2, title="Mean Drawdown")
plot(stdDev1, color=color.green, linewidth=1, title="1st Std Dev")
plot(stdDev2, color=color.orange, linewidth=1, title="2nd Std Dev")
plot(stdDev3, color=color.purple, linewidth=1, title="3rd Std Dev")

// Entry Condition
var float entryBar = na
goLong = drawdown <= meanDrawdown + stdDevThreshold * drawdownStdDev

if (goLong and strategy.position_size == 0)
    strategy.entry("Long", strategy.long)
    entryBar := bar_index

// Exit Condition
if (strategy.position_size > 0 and not na(entryBar) and bar_index - entryBar >= exitBars)
    strategy.close("Long")
Published by ChaoZhang on the FMZ strategy square · last modified 2024-11-29. Collected in the Quant Trading Vault. Unvalidated research: re-test with your own data and costs before trusting it.
Build this with AgenKit
A spec is not a trading system. Paste this into your coding agent and AgenKit runs a specialist team — architecture, test-first build, risk gates, review — with paper trading on by default.
/agenkit build a production-grade trading bot with a backtest engine, risk controls and paper trading by default from strategies/Statistical-Deviation-Based-Market-Extreme-Drawdown-Strategy.md- npx agenkit install engineering-kit in your project
- Paste the command into your agent and approve each phase
- Get tests, backtest, risk controls and a paper-trading switch
Understand it first
Before you run this, read the lesson behind the idea and how to backtest it honestly. Specs like this one are the survivors of an unknown number of trials; deflate their results accordingly.
Related specs
- 3 10 Oscillator Profile Flagging StrategyPine Script · Mean reversion · 1d
- A Trend Reversal Strategy Based on Moving Averages Price Patterns and VolumePine Script · Mean reversion · 1d
- Adaptive Mean Reversion Trading Strategy Based on Chande Momentum OscillatorPine Script · Mean reversion · 1d
- Adaptive Trading Strategy Combining Dynamic Trend Reversal and Stochastic IndicatorPine Script · Mean reversion · 1d
- Advanced 15 Minute Chart Trading Signal StrategyPine Script · Mean reversion · 3h
- Advanced Momentum EMA Trend Following with RSI Overbought Oversold Trading StrategyPine Script · Mean reversion · 1d