Statistical Volatility Backtest Strategy Based on Extreme Value Method
This strategy uses the extreme value method to calculate the statistical volatility, also known as historical volatility. It measures the volatility based on the extreme values of highest price, lowest price and…
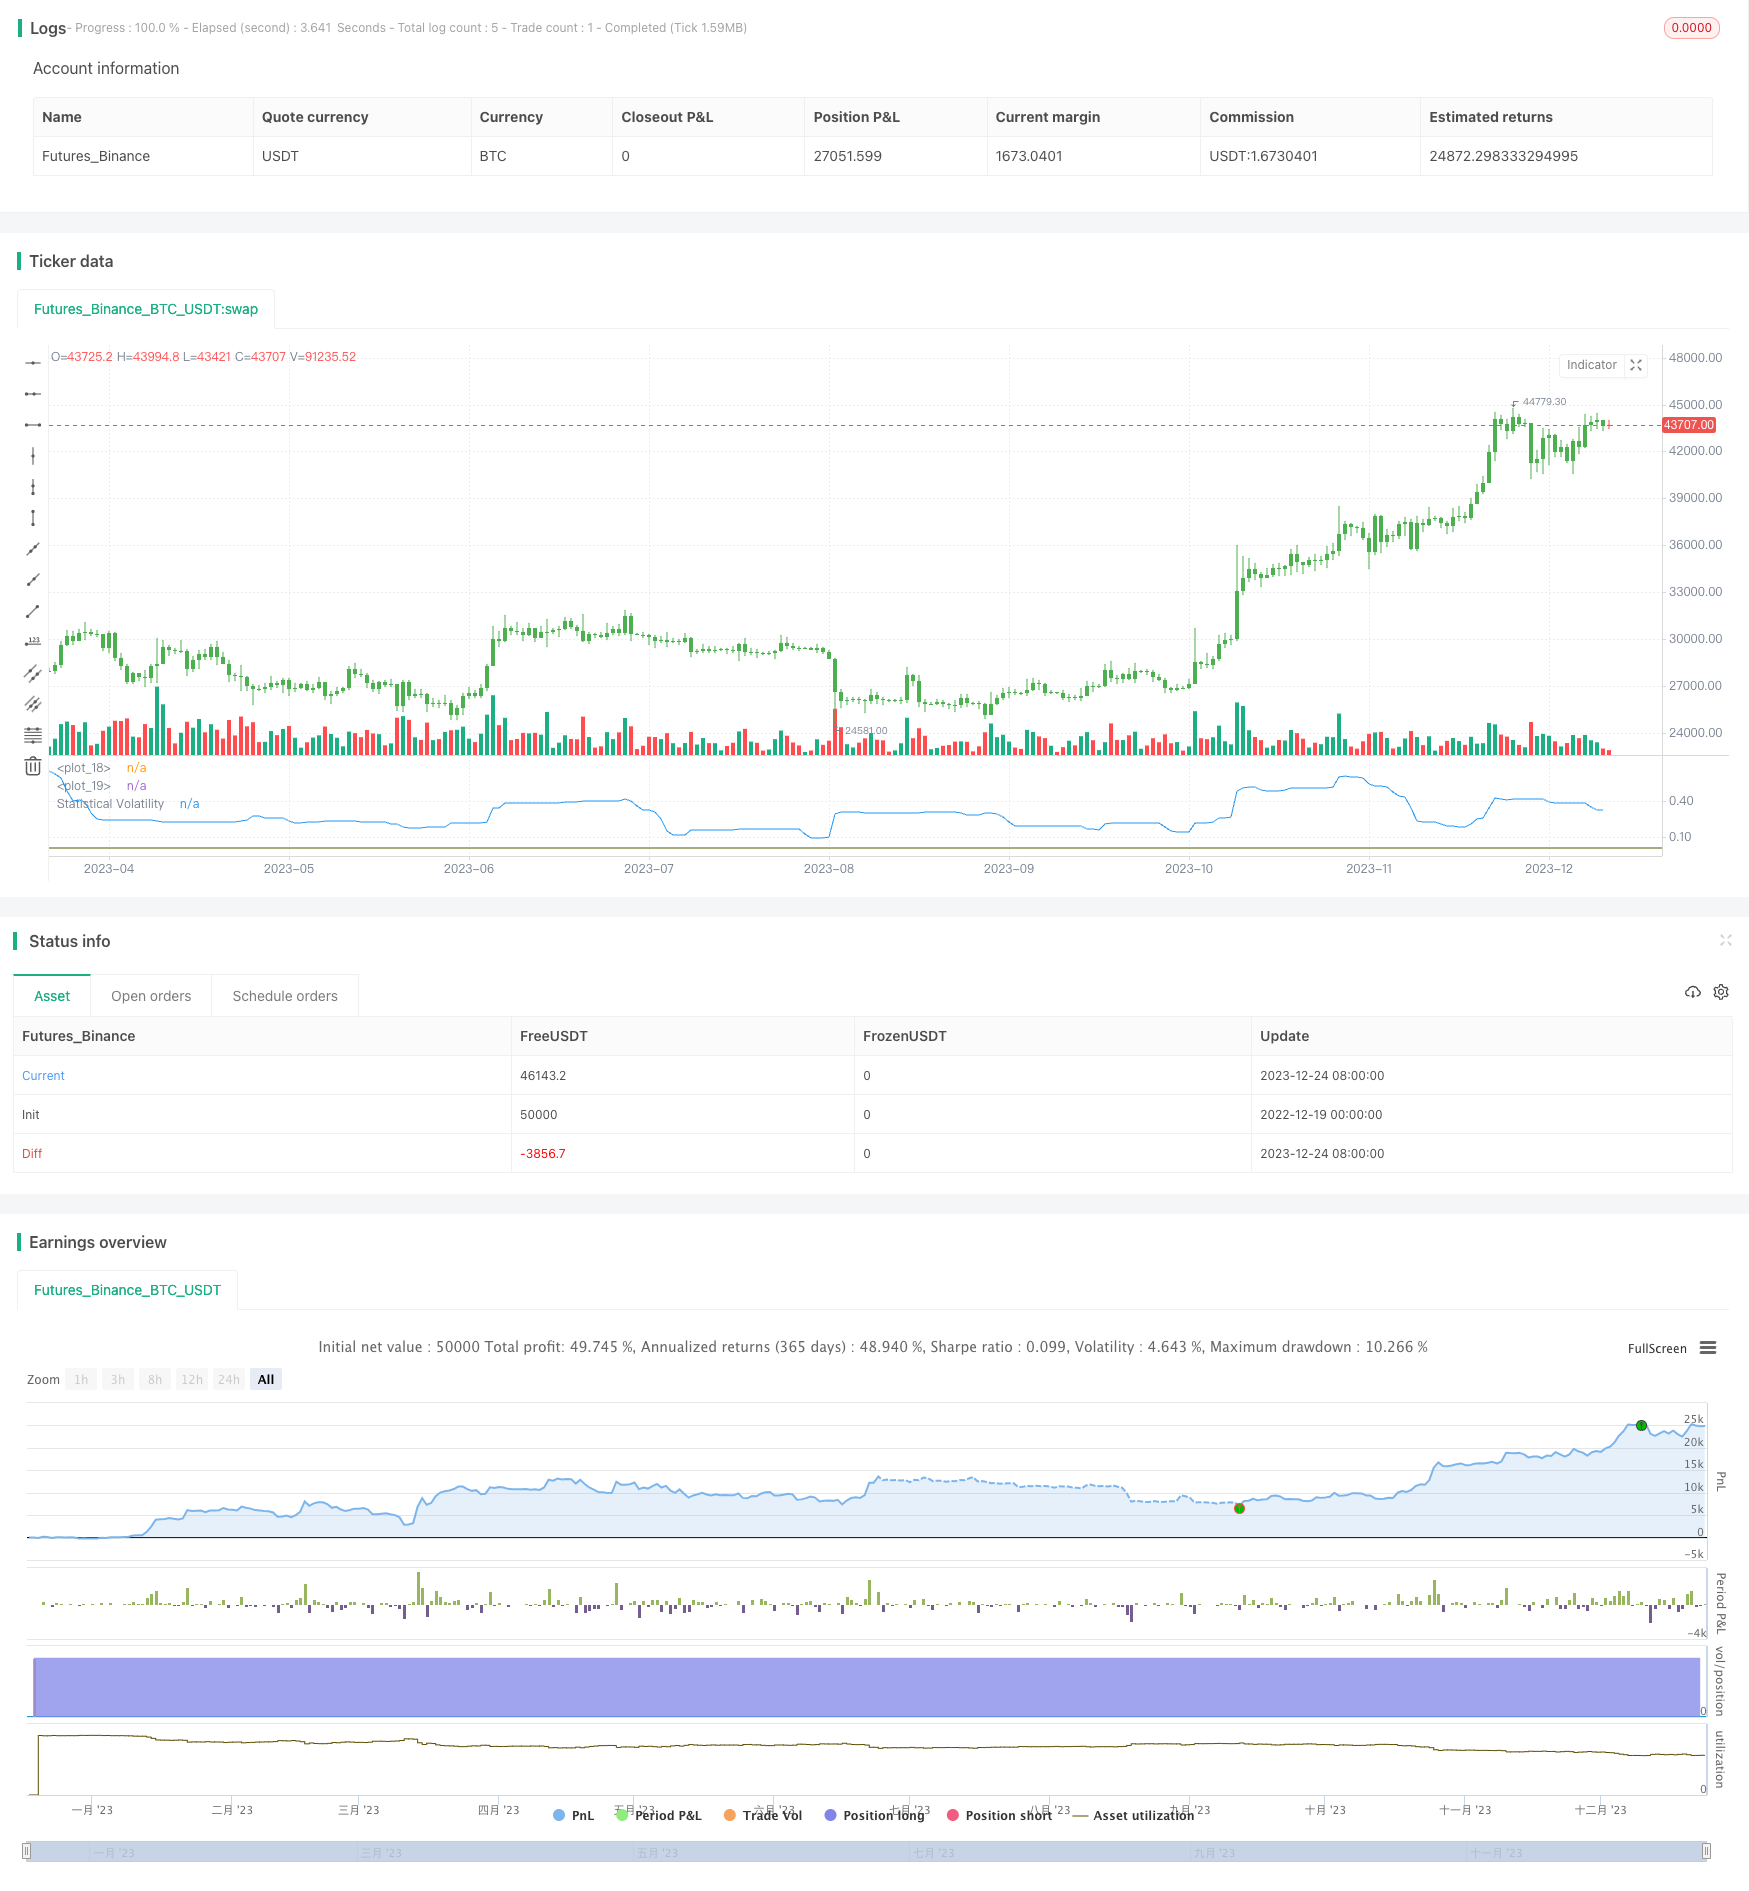
Overview
This strategy uses the extreme value method to calculate the statistical volatility, also known as historical volatility. It measures the volatility based on the extreme values of highest price, lowest price and close price, combined with the time factor. The volatility reflects the fluctuation of the asset price. The strategy will make corresponding long or short trades when the volatility is higher or lower than the threshold.
Strategy Principle
- Calculate the extreme values of highest price, lowest price and close price in a certain time period
- Apply the extreme value method formula to calculate the statistical volatility
SqrTime = sqrt(253 / Length) Vol = ((0.6 * log(xMaxC / xMinC) * SqrTime) + (0.6 * log(xMaxH / xMinL) * SqrTime)) * 0.5 - Compare the volatility with the upper and lower thresholds to generate trading signals
pos = iff(nRes > TopBand, 1, iff(nRes < LowBand, -1, nz(pos[1], 0))) - Make long or short trades based on the trading signals
Advantage Analysis
The main advantages of this strategy are:
- Using the statistical volatility indicator can effectively capture market hotspots and reversal opportunities
- The extreme value method for calculating volatility is not sensitive to extreme prices, resulting in more stable and reliable results
- Parameters can be adjusted to adapt to trading in different volatility environments
Risk Analysis
The main risks of this strategy are:
- The statistical volatility itself has some lag, and cannot accurately grasp market turning points
- The volatility indicator reacts slowly to sudden events, possibly missing short-term trading opportunities
- There are some risks of wrong trades and stop loss
Countermeasures and solutions:
- Appropriately shorten the statistical cycle to increase sensitivity to market changes
- Use other indicators as an aid to improve signal accuracy
- Set stop loss points to control single loss
Optimization Directions
The optimization directions for this strategy:
- Test different statistical period parameters to find the optimal parameters
- Add a position management module to adjust positions based on volatility
- Add filter conditions like moving average lines to reduce wrong trades
Summary
This strategy uses the extreme value method to calculate statistical volatility, and generates trading signals by capturing volatility anomalies. Compared to simple indicators like moving average lines, it better reflects market volatility and captures reversals. Meanwhile, the extreme value method algorithm also makes the results more stable and reliable. Through parameter adjustment and optimization, this strategy can adapt to different market conditions, and its trading logic and statistical volatility indicator are worth further research and application.
Parameters
| Name | Default | What it controls |
|---|---|---|
| v_input_1 | 30 | Length |
| v_input_2 | 0.005 | TopBand |
| v_input_3 | 0.0016 | LowBand |
| v_input_4 | false | Trade reverse |
Source Pine Script
/*backtest
start: 2022-12-19 00:00:00
end: 2023-12-25 00:00:00
period: 1d
basePeriod: 1h
exchanges: [{"eid":"Futures_Binance","currency":"BTC_USDT"}]
*/

//@version=2
////////////////////////////////////////////////////////////
//  Copyright by HPotter v1.0 22/11/2014
// This indicator used to calculate the statistical volatility, sometime
// called historical volatility, based on the Extreme Value Method.
// Please use this link to get more information about Volatility.
//
// You can change long to short in the Input Settings
// WARNING:
// - For purpose educate only
// - This script to change bars colors.
////////////////////////////////////////////////////////////
strategy(title="Statistical Volatility - Extreme Value Method ", shorttitle="Statistical Volatility Backtest")
Length = input(30, minval=1)
TopBand = input(0.005, step=0.001)
LowBand = input(0.0016, step=0.001)
reverse = input(false, title="Trade reverse")
hline(TopBand, color=red, linestyle=line)
hline(LowBand, color=green, linestyle=line)
xMaxC = highest(close, Length)
xMaxH = highest(high, Length)
xMinC = lowest(close, Length)
xMinL = lowest(low, Length)
SqrTime = sqrt(253 / Length)
Vol = ((0.6 * log(xMaxC / xMinC) * SqrTime) + (0.6 * log(xMaxH / xMinL) * SqrTime)) * 0.5
nRes = iff(Vol < 0,  0, iff(Vol > 2.99, 2.99, Vol))
pos = iff(nRes > TopBand, 1,
	   iff(nRes < LowBand, -1, nz(pos[1], 0)))
possig = iff(reverse and pos == 1, -1,
          iff(reverse and pos == -1, 1, pos))
if (possig == 1)
    strategy.entry("Long", strategy.long)
if (possig == -1)
    strategy.entry("Short", strategy.short)
barcolor(possig == -1 ? red: possig == 1 ? green : blue )
plot(nRes, color=blue, title="Statistical Volatility")
Published by ChaoZhang on the FMZ strategy square · last modified 2023-12-26. Collected in the Quant Trading Vault. Unvalidated research: re-test with your own data and costs before trusting it.
Build this with AgenKit
A spec is not a trading system. Paste this into your coding agent and AgenKit runs a specialist team — architecture, test-first build, risk gates, review — with paper trading on by default.
/agenkit build a production-grade trading bot with a backtest engine, risk controls and paper trading by default from strategies/Statistical-Volatility-Backtest-Strategy-Based-on-Extreme-Value-Method.md- npx agenkit install engineering-kit in your project
- Paste the command into your agent and approve each phase
- Get tests, backtest, risk controls and a paper-trading switch
Understand it first
Before you run this, read the lesson behind the idea and how to backtest it honestly. Specs like this one are the survivors of an unknown number of trials; deflate their results accordingly.
Related specs
- Dual Bollinger Band Volatility Tracking StrategyPine Script · Volatility · 1d
- Dual EMA Volatility Adaptive Trading Strategy with Multi Tiered Profit Optimization SystemPine Script · Volatility · 1d
- Dual Moving Average Volatility Tracking StrategyPine Script · Volatility · 1h
- Dynamic ATR Trailing Stop Trading Strategy Market Volatility Adaptive SystemPine Script · Volatility · 1d
- Multi Indicator Dynamic Volatility Alert Trading SystemPine Script · Volatility · 1m
- Multi Indicator Volatility Trading RSI EMA ATR StrategyPine Script · Volatility · 3m