Strategy vault / Trend following
stoch supertrd atr 200 ma
This strategy combines Supertrend, 200 EMA , Stochastic , and an ATR stop loss indicator. For buy conditions, the Stochastic has to be below the 20 level, price has to be above the 200 Ema and the Supertrend has to…
This strategy combines Supertrend, 200 EMA , Stochastic , and an ATR stop loss indicator. For buy conditions, the Stochastic has to be below the 20 level, price has to be above the 200 Ema and the Supertrend has to be green. For sell conditions, it has to be the opposite. the Stochastic has to be above the 80 level, price has to be below the 200 Ema and the Supertrend has to be red.
backtest
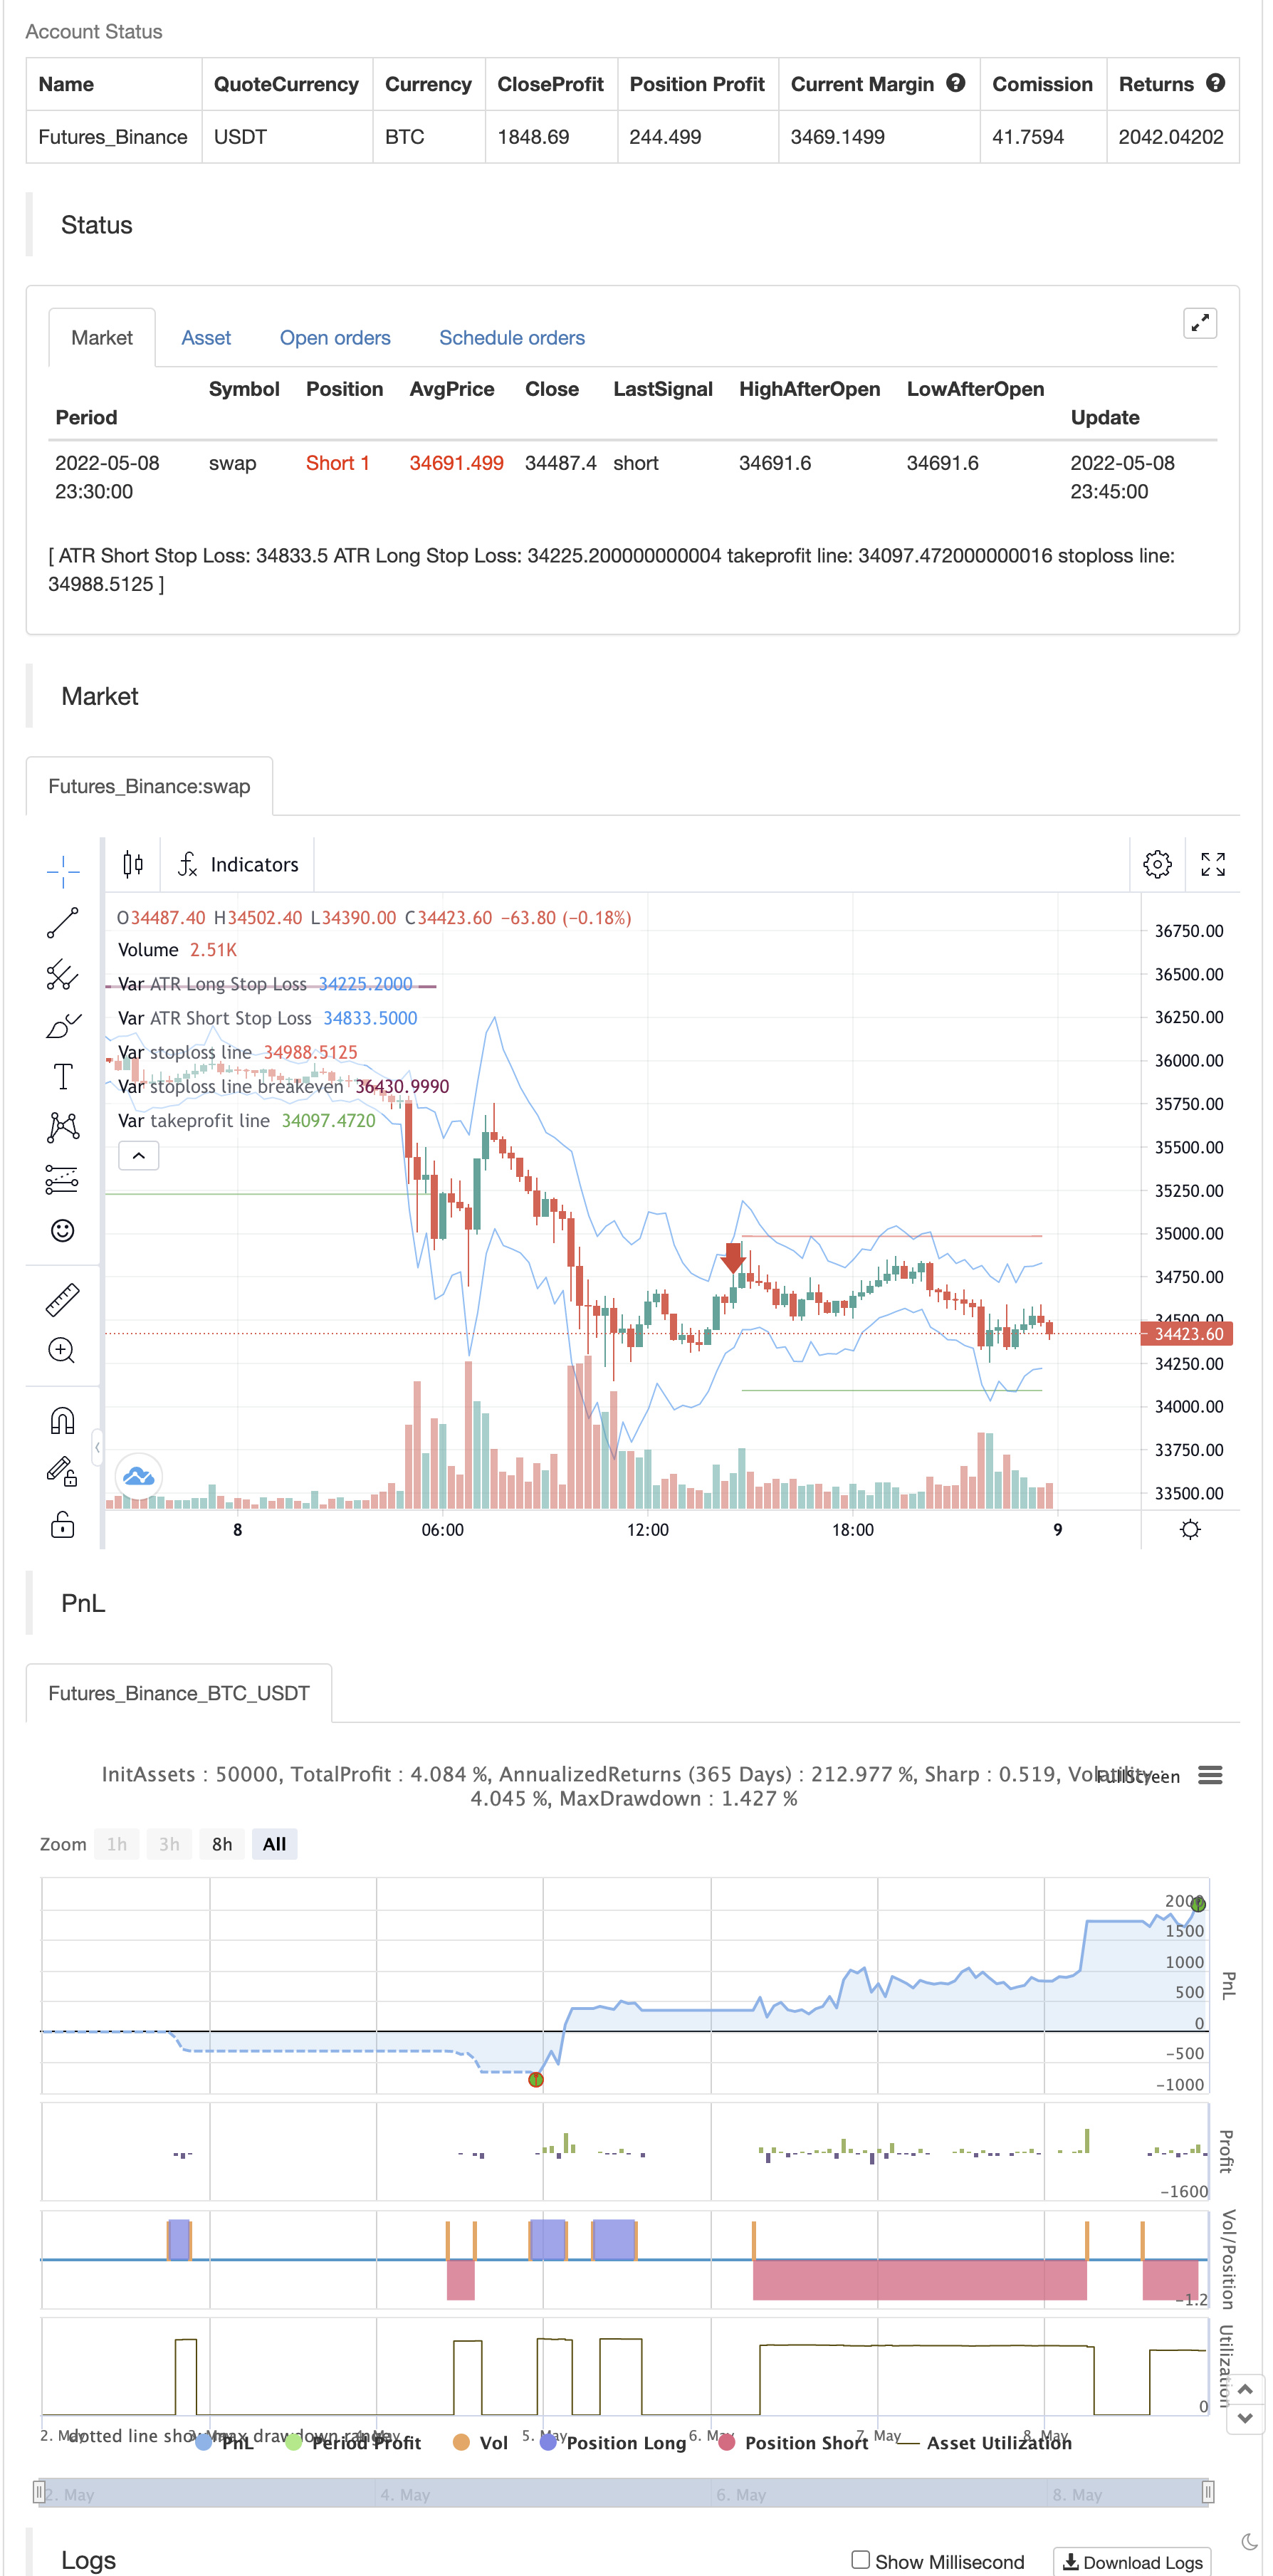
Parameters
| Name | Default | What it controls |
|---|---|---|
| v_input_bool_1 | true | ema needed? |
| v_input_1 | 10 | ATR Length |
| v_input_float_1 | 3 | Factor |
| v_input_int_1 | 200 | ema period |
| v_input_int_2 | 14 | length k% |
| v_input_int_3 | 3 | smoothing k% |
| v_input_int_4 | 3 | smoothing d% |
| v_input_int_5 | 12 | Length |
| v_input_string_1 | 0 | Smoothing: SMA | RMA | EMA | WMA |
| v_input_2 | 1.5 | Multiplier |
| v_input_3_high | 0 | src1: high | close | low | open | hl2 | hlc3 | hlcc4 | ohlc4 |
| v_input_4_low | 0 | src2: low | high | close | open | hl2 | hlc3 | hlcc4 | ohlc4 |
| v_input_5 | true | Show Price Lines |
| v_input_6 | blue | ATR Text Color |
| v_input_7 | teal | Low Text Color |
| v_input_8 | red | High Text Color |
| v_input_9 | teal | Low Line Color |
| v_input_10 | red | High Line Color |
Source Pine Script
// This source code is subject to the terms of the Mozilla Public License 2.0 at https://mozilla.org/MPL/2.0/
// © araamas

//@version=5
strategy("stoch supertrd atr 200ma", overlay=true, shorttitle="STOCH SUPTR ATR MA", process_orders_on_close=true, max_bars_back=5000)

ema_condition = input.bool(defval=true, title="ema needed?", tooltip="You can choose whether to include the Ema in the buy and sell conditions")
atrPeriod = input(10, "ATR Length")
factor = input.float(3.0, "Factor", step = 0.01)

[supertrend, direction] = ta.supertrend(factor, atrPeriod)

// bodyMiddle = plot((open + close) / 2, display=display.none)
// upTrend = plot(direction < 0 ? supertrend : na, "Up Trend", color = color.green, style=plot.style_linebr)
// downTrend = plot(direction < 0? na : supertrend, "Down Trend", color = color.red, style=plot.style_linebr)

period = input.int(defval=200, title="ema period")
ema = ta.ema(close, period)
// plot(ema, title="200 ema", color=color.yellow)

b = input.int(defval=14, title="length k%")
d = input.int(defval=3, title="smoothing k%")
s = input.int(defval=3, title="smoothing d%")
smooth_k = ta.sma(ta.stoch(close, high, low, b), d)
smooth_d = ta.sma(smooth_k, s)

////////////////////////////////////////////////////////////////////////////////
length = input.int(title="Length", defval=12, minval=1)
smoothing = input.string(title="Smoothing", defval="SMA", options=["RMA", "SMA", "EMA", "WMA"])
m = input(1.5, "Multiplier")
src1 = input(high)
src2 = input(low)
pline = input(true, "Show Price Lines")
col1 = input(color.blue, "ATR Text Color")
col2 = input(color.teal, "Low Text Color",inline ="1")
col3 = input(color.red, "High Text Color",inline ="2")

collong = input(color.teal, "Low Line Color",inline ="1")
colshort = input(color.red, "High Line Color",inline ="2")

ma_function(source, length) =>
	if smoothing == "RMA"
		ta.rma(source, length)
	else
		if smoothing == "SMA"
			ta.sma(source, length)
		else
			if smoothing == "EMA"
				ta.ema(source, length)
			else
				ta.wma(source, length)

a = ma_function(ta.tr(true), length) * m
x = ma_function(ta.tr(true), length) * m + src1
x2 = src2 - ma_function(ta.tr(true), length) * m

p1 = plot(x, title = "ATR Short Stop Loss", color=color.blue)
p2 = plot(x2, title = "ATR Long Stop Loss", color= color.blue)


///////////////////////////////////////////////////////////////////////////////////////////////

shortCondition = high < ema and direction == 1 and smooth_k > 80 or (ema_condition == false and direction == 1 and smooth_k > 80)
if (shortCondition) and strategy.position_size == 0
    strategy.entry("sell", strategy.short)

longCondition = low > ema and direction == -1 and smooth_k < 20 or (ema_condition == false and direction == -1 and smooth_k < 20)
if (longCondition) and strategy.position_size == 0
    strategy.entry("buy", strategy.long)

x2_val = x2[bar_index - strategy.opentrades.entry_bar_index(0)]
g = (strategy.opentrades.entry_price(0) - x2_val) * 2 // tp for buy

x_val = x[bar_index - strategy.opentrades.entry_bar_index(0)]
k = (x_val - strategy.opentrades.entry_price(0)) * 2 //tp for sell

activate_breakeven_sl_price = strategy.opentrades.entry_price(0) + (strategy.opentrades.entry_price(0) - x2_val) //price to activate sl for buy
sl_breakeven_price_activated = ta.highest(high, strategy.position_size == 0 ? nz(strategy.opentrades.entry_bar_index(0), 1):bar_index - strategy.opentrades.entry_bar_index(0)) > activate_breakeven_sl_price ? true:false //checks if 1:1 ratio has been reached

activate_breakeven_sl_price1 = strategy.opentrades.entry_price(0) - (x_val - strategy.opentrades.entry_price(0)) //price to activate sl for buy
sl_breakeven_price_activated1 = ta.lowest(high, strategy.position_size == 0 ? nz(strategy.opentrades.entry_bar_index(0), 1):bar_index - strategy.opentrades.entry_bar_index(0)) < activate_breakeven_sl_price1 ? true:false //checks if 1:1 ratio has been reached

if strategy.position_size > 0
    strategy.exit(id="buy exit", from_entry="buy",limit=strategy.opentrades.entry_price(0) + g, stop=sl_breakeven_price_activated ? strategy.opentrades.entry_price(0):x2_val)

if strategy.position_size < 0
    strategy.exit(id="sell exit", from_entry="sell",limit=strategy.opentrades.entry_price(0) - k, stop=sl_breakeven_price_activated1 ? strategy.opentrades.entry_price(0):x_val)


plot(strategy.position_size > 0 ? strategy.opentrades.entry_price(0) + g:na, color=color.green, style=plot.style_linebr, title="takeprofit line") //to plot tp line for buy
plot(strategy.position_size > 0 and sl_breakeven_price_activated == false ? x2_val:na, color=color.red, style=plot.style_linebr, title="stoploss line") //to plot sl line for buy
plot(sl_breakeven_price_activated and strategy.position_size > 0 ? strategy.opentrades.entry_price(0):na, color=color.maroon, style=plot.style_linebr, linewidth=2, title="stoploss line breakeven") //to plot breakeven sl for buy

plot(strategy.position_size < 0 ? strategy.opentrades.entry_price(0) - k:na, color=color.green, style=plot.style_linebr, title="takeprofit line") //to plot tp line for sell
plot(strategy.position_size < 0 and sl_breakeven_price_activated1 == false ? x_val:na, color=color.red, style=plot.style_linebr, title="stoploss line") //to plot sl line for sell
plot(sl_breakeven_price_activated1 and strategy.position_size < 0 ? strategy.opentrades.entry_price(0):na, color=color.maroon, style=plot.style_linebr, linewidth=2, title="stoploss line breakeven") //to plot breakeven sl for sell
Published by ChaoZhang on the FMZ strategy square · last modified 2022-05-10. Collected in the Quant Trading Vault. Unvalidated research: re-test with your own data and costs before trusting it.
Build this with AgenKit
A spec is not a trading system. Paste this into your coding agent and AgenKit runs a specialist team — architecture, test-first build, risk gates, review — with paper trading on by default.
/agenkit build a production-grade trading bot with a backtest engine, risk controls and paper trading by default from strategies/stoch-supertrd-atr-200ma.md- npx agenkit install engineering-kit in your project
- Paste the command into your agent and approve each phase
- Get tests, backtest, risk controls and a paper-trading switch
Understand it first
Before you run this, read the lesson behind the idea and how to backtest it honestly. Specs like this one are the survivors of an unknown number of trials; deflate their results accordingly.
Related specs
- Mini Pullback Supertrend StrategyPine Script · Trend following · 1h
- Triple SuperTrend Quantitative Trading StrategyPine Script · Trend following · 1d
- Triple SuperTrend and Stoch RSI StrategyPine Script · Trend following · 1d
- Multi Technical Indicator Gold Real Time Movement Detection and Risk Management StrategyPine Script · Trend following · 1d
- Stochastic Supertrend Tracking Stop Loss Trading StrategyPine Script · Trend following · 1h
- SuperTrend Trading Strategy with Multiple FiltersPine Script · Trend following · 1h