Stochastic Crossover Indicator Momentum Trading Strategy
This strategy uses the crossover signals of the Stochastic Oscillator to identify potential buying and selling opportunities. When the %K line of the Stochastic Oscillator crosses above the %D line and the %K value…
Overview
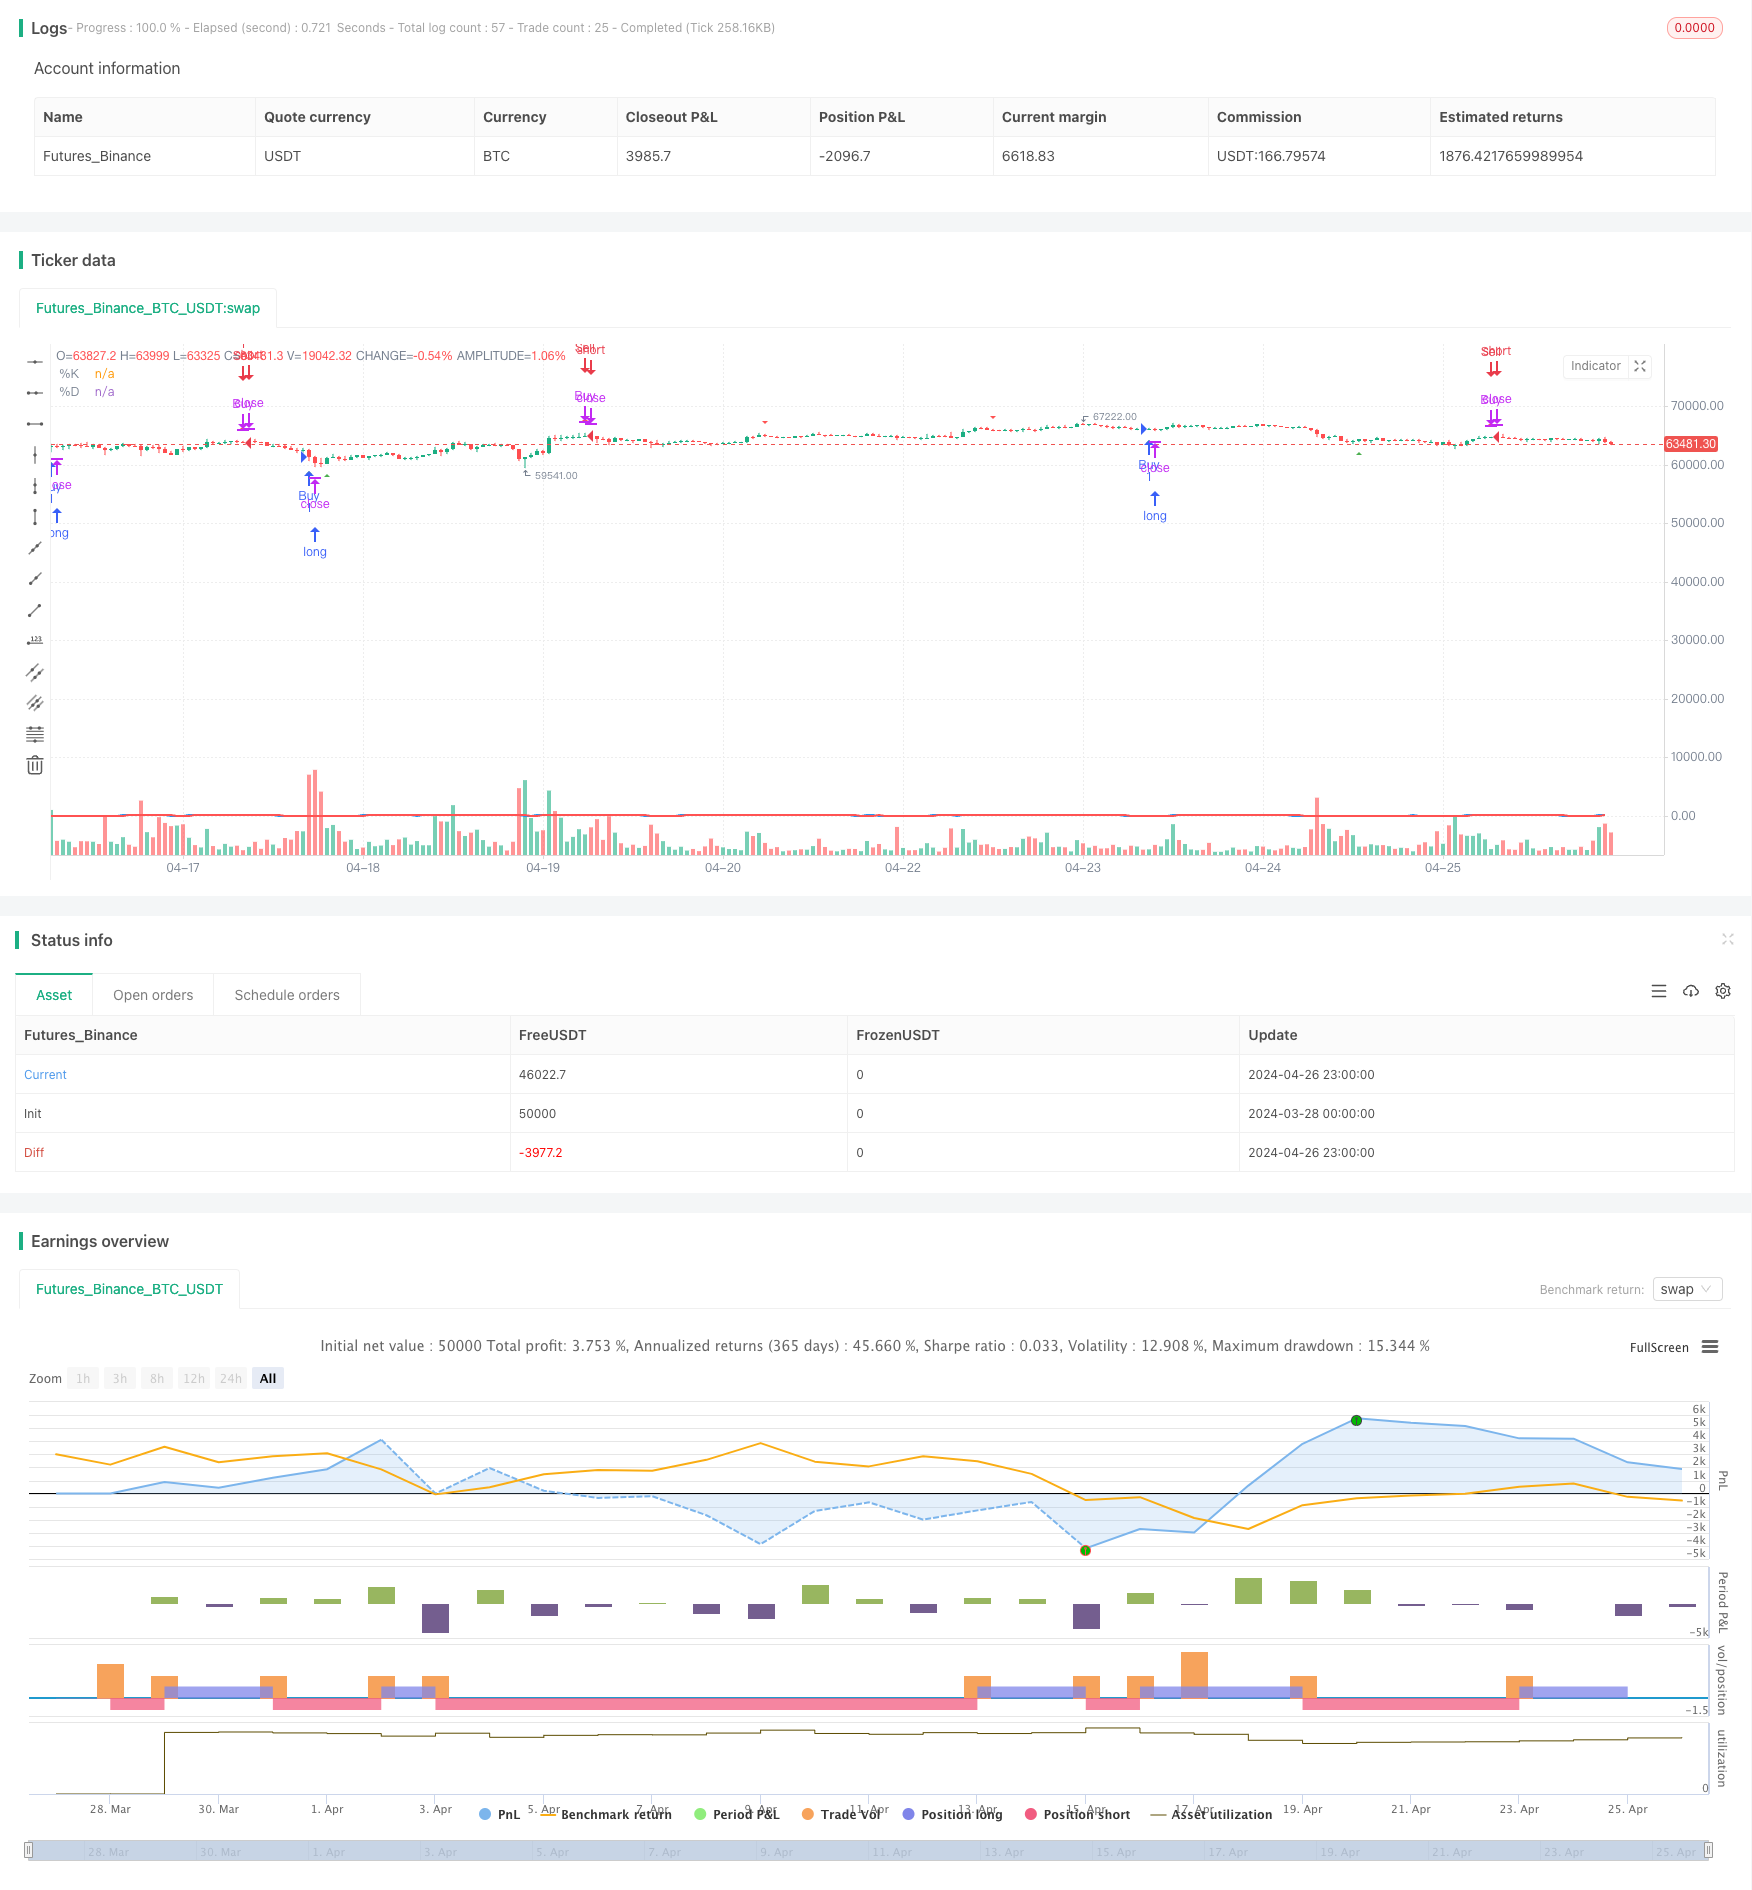
This strategy uses the crossover signals of the Stochastic Oscillator to identify potential buying and selling opportunities. When the %K line of the Stochastic Oscillator crosses above the %D line and the %K value is below 20, the strategy generates a buy signal. Conversely, when the %K line crosses below the %D line and the %K value is above 80, the strategy generates a sell signal. The strategy is applied to a 5-minute time frame.
Strategy Principle
The Stochastic Oscillator consists of the %K line and the %D line. The %K line measures the position of the closing price relative to the high and low prices over a specified period. The %D line is a moving average of the %K line, used to smooth the %K line and generate more reliable signals. When the %K line crosses the %D line, it indicates a change in price momentum, which can be interpreted as a potential buy or sell signal. This strategy uses the crossovers of the Stochastic Oscillator to identify potential trend reversals or momentum changes. When the %K line crosses above the %D line and the %K value is below 20 (indicating oversold conditions), the strategy generates a buy signal. Conversely, when the %K line crosses below the %D line and the %K value is above 80 (indicating overbought conditions), the strategy generates a sell signal. This approach attempts to capture shifts in the trend before a price reversal occurs.
Strategy Advantages
- Simplicity: The strategy is based on a widely used technical indicator and is easy to understand and implement.
- Trend identification: By using the crossovers of the Stochastic Oscillator, the strategy can identify potential trend reversals and momentum changes.
- Overbought/oversold signals: By combining the crossovers of the Stochastic Oscillator with overbought/oversold levels, the strategy attempts to identify extreme conditions before a price reversal occurs.
Strategy Risks
- False signals: The Stochastic Oscillator may generate false signals, leading to unprofitable trades.
- Lag: As a lagging indicator, the Stochastic Oscillator may generate signals after the price has already reversed.
- Lack of trend confirmation: The strategy may generate frequent trading signals in choppy markets, resulting in overtrading and potential losses.
Strategy Optimization
- Trend confirmation: Additional technical indicators or price action analysis can be incorporated to confirm the trend before generating trading signals. This can help filter out false signals in choppy markets.
- Dynamic parameters: The parameters of the Stochastic Oscillator can be dynamically adjusted based on market volatility or other market conditions to optimize the strategy's performance.
- Risk management: Proper stop-loss and position sizing controls can be implemented to limit potential losses and protect profits.
Summary
The Stochastic Crossover Indicator Momentum Trading Strategy uses the crossovers of the Stochastic Oscillator to identify potential buying and selling opportunities while considering the overbought/oversold state of the asset. Although the strategy is simple and can identify trend reversals, it may also generate false signals and lack trend confirmation. By incorporating trend confirmation indicators, dynamic parameter optimization, and risk management, the strategy's performance can be further enhanced. However, it is essential to thoroughly test and evaluate the strategy under different market conditions before implementation.
Parameters
| Name | Default | What it controls |
|---|---|---|
| v_input_1 | 14 | Stochastic Length |
| v_input_2 | 3 | Stochastic %K Smoothing |
| v_input_3 | 3 | Stochastic %D Smoothing |
Source Pine Script
/*backtest
start: 2024-03-28 00:00:00
end: 2024-04-27 00:00:00
period: 1h
basePeriod: 15m
exchanges: [{"eid":"Futures_Binance","currency":"BTC_USDT"}]
*/

//@version=4
strategy("Stochastic Crossover Buy/Sell", shorttitle="Stochastic Crossover", overlay=true)

// Stochastic Oscillator Parameters
length = input(14, title="Stochastic Length")
smoothK = input(3, title="Stochastic %K Smoothing")
smoothD = input(3, title="Stochastic %D Smoothing")

// Calculate %K and %D
stoch = stoch(close, high, low, length)
k = sma(stoch, smoothK)
d = sma(k, smoothD)

// Plot Stochastic Lines
plot(k, color=color.blue, linewidth=2, title="%K")
plot(d, color=color.red, linewidth=2, title="%D")

// Stochastic Crossover Buy/Sell Signals
buySignal = crossover(k, d) and k < 20 // Buy when %K crosses above %D and %K is below 20
sellSignal = crossunder(k, d) and k > 80 // Sell when %K crosses below %D and %K is above 80

// Plot Buy/Sell Arrows
plotshape(series=buySignal, style=shape.triangleup, location=location.belowbar, color=color.green, size=size.small, title="Buy Signal")
plotshape(series=sellSignal, style=shape.triangledown, location=location.abovebar, color=color.red, size=size.small, title="Sell Signal")

// Entry and Exit Points
strategy.entry("Buy", strategy.long, when=buySignal)
strategy.close("Buy", when=sellSignal)

strategy.entry("Sell", strategy.short, when=sellSignal)
strategy.close("Sell", when=buySignal)
Published by ChaoZhang on the FMZ strategy square · last modified 2024-04-28. Collected in the Quant Trading Vault. Unvalidated research: re-test with your own data and costs before trusting it.
Build this with AgenKit
A spec is not a trading system. Paste this into your coding agent and AgenKit runs a specialist team — architecture, test-first build, risk gates, review — with paper trading on by default.
/agenkit build a production-grade trading bot with a backtest engine, risk controls and paper trading by default from strategies/Stochastic-Crossover-Indicator-Momentum-Trading-Strategy.md- npx agenkit install engineering-kit in your project
- Paste the command into your agent and approve each phase
- Get tests, backtest, risk controls and a paper-trading switch
Understand it first
Before you run this, read the lesson behind the idea and how to backtest it honestly. Specs like this one are the survivors of an unknown number of trials; deflate their results accordingly.
Related specs
- Momentum Trend Following SuperTrend and Stochastic Crossover StrategyPine Script · Momentum · 2d
- MoonFlag MACD Momentum StochRSI Trading StrategyPine Script · Momentum · 1d
- Multi EMA Trend Momentum Trading Strategy with Risk Management SystemPine Script · Momentum · 1h
- Multi Indicator Probability Threshold Momentum Trend Trading StrategyPine Script · Momentum · 1d
- Multi factor Adaptive Momentum Tracking StrategyPine Script · Momentum · 3m
- Pivot and Momentum StrategyPine Script · Momentum · 1d